[go: up one dir, main page]

Next Issue
Volume 10, March
Previous Issue
Volume 10, January
 
 
polymers-logo

Journal Browser

Journal Browser

Polymers, Volume 10, Issue 2 (February 2018) – 121 articles

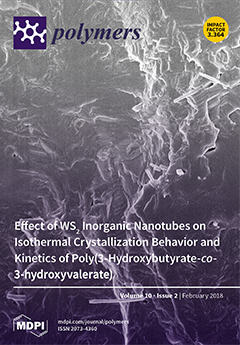
Cover Story (view full-size image): Well-dispersed tungsten disulfide inorganic nanotubes (INT-WS2) are used as a novel nanoreinforcement for enhancing the processability and performance of a poly(3-hydroxybutyrate-co-3-hydroxyvalerate) PHBV biopolymer. INT-WS2 is found to have a pronounced impact on the morphology and crystallization kinetics of PHBV, reducing the fold surface free energy by up to 24%. This is ascribed to the high nucleation efficiency of INT-WS2 on the crystallization of PHBV. The research reported provides a better understanding of the structure–property relationship of a PHBV biopolymer and its nanocomposites, with an outlook towards extending their practical applications. View this paper.
  • Issues are regarded as officially published after their release is announced to the table of contents alert mailing list.
  • You may sign up for e-mail alerts to receive table of contents of newly released issues.
  • PDF is the official format for papers published in both, html and pdf forms. To view the papers in pdf format, click on the "PDF Full-text" link, and use the free Adobe Reader to open them.
Order results
Result details
Section
Select all
Export citation of selected articles as:
19 pages, 9678 KiB  
Article
Woven Fabrics Made of Auxetic Plied Yarns
by Wing Sum Ng and Hong Hu
Polymers 2018, 10(2), 226; https://doi.org/10.3390/polym10020226 - 24 Feb 2018
Cited by 60 | Viewed by 8416
Abstract
Auxetic plied yarns are specially constructed with two types of single yarns of different sizes and moduli. This paper investigates how to use these types of yarns to produce woven fabrics with auxetic effects. Four-ply auxetic yarns were first incorporated into a series [...] Read more.
Auxetic plied yarns are specially constructed with two types of single yarns of different sizes and moduli. This paper investigates how to use these types of yarns to produce woven fabrics with auxetic effects. Four-ply auxetic yarns were first incorporated into a series of woven fabrics with different design parameters to study their auxetic behavior and percent open area during extension. Effects of auxetic plied yarn arrangement, single component yarn properties, weft yarn type, and weave structure were then evaluated. Additional double helical yarn (DHY) and 6-ply auxetic yarn woven fabrics were also made for comparison. The results show that the alternative arrangement of S- and Z-twisted 4-ply auxetic yarns in a woven fabric can generate a higher negative Poisson’s ratio (NPR) of the fabric. While the higher single stiff yarn modulus of auxetic yarn can result in greater NPR behavior, finer soft auxetic yarn does not necessarily generate such an effect. Weft yarns with low modulus and short float over the 4-ply auxetic yarns in fabric structure are favorable for producing high NPR behavior. The weft cover factor greatly affects the variation of the percent open area of the 4-ply auxetic yarn fabrics during extension. When different kinds of helical auxetic yarns (HAYs) are made into fabrics, the fabric made of DHY does not have the highest NPR effect but it has the highest percent open area, which increases with increasing tensile strain. Full article
(This article belongs to the Special Issue Textile and Textile-Based Materials)
Show Figures

Graphical abstract

Graphical abstract
Full article ">Figure 1
<p>Four-ply auxetic yarn: (<b>a</b>) at rest; (<b>b</b>) under extension; and (<b>c</b>) cross-section views in different stretched states.</p>
Full article ">Figure 2
<p>Six-ply auxetic yarn: (<b>a</b>) side view; and (<b>b</b>) cross-section views at different stretched states.</p>
Full article ">Figure 3
<p>Schematic diagram of the HAY spinning device.</p>
Full article ">Figure 4
<p>Woven fabric design with crimp-free auxetic plied yarns.</p>
Full article ">Figure 5
<p>Schematic diagram and photograph of the fabric tensile testing system.</p>
Full article ">Figure 6
<p>Conversion of the cropped image: (<b>a</b>) original image; (<b>b</b>) threshold color; (<b>c</b>) binary image.</p>
Full article ">Figure 7
<p>Tensile behavior of a typical auxetic woven fabric and its constituent auxetic yarn: (<b>a</b>) load-strain curves (the inset shows the enlargement at small load); (<b>b</b>) transverse-tensile strain curves; (<b>c</b>) PR-tensile strain curves.</p>
Full article ">Figure 8
<p>PR-tensile strain curves of fabrics F1 and F2 made of auxetic yarns with the same twist direction (S/S) and alternative twist direction (S/Z).</p>
Full article ">Figure 9
<p>Ideal arrangement of two neighboring 4-ply auxetic yarns: (<b>a</b>) at zero strain; (<b>b</b>) under tension.</p>
Full article ">Figure 10
<p>Actual alignment of two neighboring 4-ply auxetic yarns: (<b>a</b>) in the fabric; (<b>b</b>) at zero strain; (<b>c</b>) under tension.</p>
Full article ">Figure 11
<p>Percent open area-tensile strain curves of fabrics F1 and F2 made of different auxetic yarn arrangements.</p>
Full article ">Figure 12
<p>PR-tensile strain curves of fabrics F1 and F3 made with different types of weft yarn.</p>
Full article ">Figure 13
<p>Tensile stress-strain curves of the weft yarns used.</p>
Full article ">Figure 14
<p>Percent open area-tensile strain curves of fabrics F1 and F3 made with different types of weft yarn.</p>
Full article ">Figure 15
<p>PR-tensile strain curves of fabrics F3, F4, F5 and their respective 4-ply auxetic yarns.</p>
Full article ">Figure 16
<p>Percent open area-tensile strain curves of fabrics F3, F4, and F5.</p>
Full article ">Figure 17
<p>PR-tensile strain curves of fabrics F3, F6, F7 and their respective 4-ply auxetic yarns.</p>
Full article ">Figure 18
<p>Percent open area-tensile strain curves of fabrics F3, F6 and F7.</p>
Full article ">Figure 19
<p>PR-tensile strain curves of fabrics F1, F8, F9 and F10 made of different weave structures.</p>
Full article ">Figure 20
<p>Percent open area-tensile strain curves of fabrics F1, F8, F9 and F10 made of different weave structures.</p>
Full article ">Figure 21
<p>PR-tensile strain curves of fabrics F11, F3 and F12 made of auxetic yarns with different helical structures.</p>
Full article ">Figure 22
<p>Fabric F12 stretched at a strain of 0.4.</p>
Full article ">Figure 23
<p>Percent open area-tensile strain curves of fabrics F11, F3 and F12 made of auxetic yarns with different helical structures.</p>
Full article ">
16 pages, 2136 KiB  
Article
Preparation and Characterization of Poly(ether-block-amide)/Polyethylene Glycol Composite Films with Temperature-Dependent Permeation
by Sarinthip Thanakkasaranee, Dowan Kim and Jongchul Seo
Polymers 2018, 10(2), 225; https://doi.org/10.3390/polym10020225 - 24 Feb 2018
Cited by 53 | Viewed by 7706
Abstract
A series of poly(ether-block-amide) (PEBAX)/polyethylene glycol (PEG) composite films (PBXPG) were prepared by solution casting technique. This study demonstrates how the incorporation of different molecular weight PEG into PEBAX can improve the as-prepared composite film performance in gas permeability as a function of [...] Read more.
A series of poly(ether-block-amide) (PEBAX)/polyethylene glycol (PEG) composite films (PBXPG) were prepared by solution casting technique. This study demonstrates how the incorporation of different molecular weight PEG into PEBAX can improve the as-prepared composite film performance in gas permeability as a function of temperature. Additionally, we investigated the effect of PEG with different molecular weights on gas transport properties, morphologies, thermal properties, and water sorption. The thermal stability of the composite films increased with increasing molecular weight of PEG, whereas the water sorption and total surface energy decreased. As the temperature increased from 10 to 80 °C, the low (L)-PBXPG and medium (M)-PBXPG films showed a trend similar to the pure PEBAX film. However, the high (H)-PBXPG film with relatively high molecular weight exhibited a distinct permeation jump in the phase change region of H-PEG, which is related to the temperature dependent changes in the morphology structure such as crystallinity and the chemical affinity between the polymer film and gas molecule. Based on these results, it can be expected that H-PBXPG composite films can be used as self-ventilating materials in microwave cooking. Full article
(This article belongs to the Special Issue Polymers for Packaging Applications)
Show Figures

Figure 1

Figure 1
<p>Fourier Transform Infrared (FT-IR) spectra of the pure poly(ether-block-amide) (PEBAX) and composite films.</p>
Full article ">Figure 2
<p>Scanning Electron Microscopy (SEM) images of the pure PEBAX and composite films.</p>
Full article ">Figure 3
<p>Differential Scanning Calorimetry (DSC) curves of the pure PEBAX and composite films.</p>
Full article ">Figure 4
<p>Thermogravimetry (TGA) curves of the pure PEBAX and composite films.</p>
Full article ">Figure 5
<p>Tensile strength and elongation at break of the pure PEBAX and composite films.</p>
Full article ">Figure 6
<p>Water sorption isotherms of the pure PEBAX and composite films measured at 95 % relative humidity (RH) and 25 °C.</p>
Full article ">Figure 7
<p>Contact angle and surface energy of the pure PEBAX and composite films.</p>
Full article ">Figure 8
<p>Oxygen transmission rate of the pure PEBAX and composite films.</p>
Full article ">
15 pages, 2409 KiB  
Article
RAFT Polymerization of Tert-Butyldimethylsilyl Methacrylate: Kinetic Study and Determination of Rate Coefficients
by Minh Ngoc Nguyen, André Margaillan, Quang Trung Pham and Christine Bressy
Polymers 2018, 10(2), 224; https://doi.org/10.3390/polym10020224 - 24 Feb 2018
Cited by 5 | Viewed by 6452
Abstract
Well-defined poly(tert-butyldimethylsilyl methacrylate)s (TBDMSMA) were prepared by the reversible addition-fragmentation chain transfer (RAFT) process using cyanoisopropyl dithiobenzoate (CPDB) as chain-transfer agents (CTA). The experimentally obtained molecular weight distributions are narrow and shift linearly with monomer conversion. Propagation rate coefficients (k [...] Read more.
Well-defined poly(tert-butyldimethylsilyl methacrylate)s (TBDMSMA) were prepared by the reversible addition-fragmentation chain transfer (RAFT) process using cyanoisopropyl dithiobenzoate (CPDB) as chain-transfer agents (CTA). The experimentally obtained molecular weight distributions are narrow and shift linearly with monomer conversion. Propagation rate coefficients (kp) and termination rate coefficients (kt) for free radical polymerization of TBDMSMA have been determined for a range of temperature between 50 and 80 °C using the pulsed laser polymerization-size-exclusion chromatography (PLP-SEC) method and the kinetic method via steady-state rate measurement, respectively. The CPDB-mediated RAFT polymerization of TBDMSMA has been subjected to a combined experimental and PREDICI modeling study at 70 °C. The rate coefficient for the addition reaction to RAFT agent (kβ1, kβ2) and to polymeric RAFT agent (kβ) is estimated to be approximately 1.8 × 10⁴ L·mol−1·s−1 and for the fragmentation reaction of intermediate RAFT radicals in the pre-equilibrium (k-β1, k-β2) and main equilibrium (k) is close to 2.0 × 10⁻² s−1. The transfer rate coefficient (ktr) to cyanoisopropyl dithiobenzoate is found to be close to 9.0 × 10³ L·mol−1·s−1 and the chain-transfer constant (Ctr) for CPDB-mediated RAFT polymerization of TBDMSMA is about 9.3. Full article
(This article belongs to the Special Issue RAFT Living Radical Polymerization and Self-Assembly)
Show Figures

Graphical abstract

Graphical abstract
Full article ">Figure 1
<p>Arrhenius plot of the propagation rate coefficient <span class="html-italic">k</span><sub>p</sub> for <span class="html-italic">tert</span>-butyldimethylsilyl methacrylate polymerization. Points: experimental data; line: best fit of linearized Arrhenius equation to points.</p>
Full article ">Figure 2
<p>Plot of ln(1/(1 − <span class="html-italic">x</span>))/[I]<sup>1/2</sup> versus time for free-radical polymerization of TBDMSMA at 60, 70, and 80 °C in toluene. [TBDMSMA] = 1.5 mol·L<sup>−1</sup>, [AIBN] = 6.0 × 10<sup>−3</sup> mol·L<sup>−1</sup>.</p>
Full article ">Figure 3
<p>Evolution of monomer conversion and ln([M]<sub>0</sub>/[M]) versus reaction time for CPDB-mediated polymerization of TBDMSMA in toluene at 70 °C with initial concentration of CPDB ranging from 1.5 × 10<sup>−2</sup> to 6.0 × 10<sup>−2</sup> mol·L<sup>−1</sup>. The graph compares predicted values (lines) with experimental data (points).</p>
Full article ">Figure 4
<p>Evolution of CPDB conversion versus reaction time and of monomer conversion versus CPDB conversion for CPDB-mediated polymerization of TBDMSMA in toluene at 70 °C with initial concentration of CPDB ranging from 1.5 × 10<sup>−2</sup> to 6.0 × 10<sup>−2</sup> mol·L<sup>−1</sup>. The graph compares predicted values (lines) with experimental data (points).</p>
Full article ">Figure 5
<p>Evolution of monomer and CPDB conversion versus reaction time for CPDB-mediated polymerization of TBDMSMA in toluene at 70 °C with initial concentration of CPDB of 3.0 × 10<sup>−2</sup> mol·L<sup>−1</sup>. The graph compares predicted values (lines) with experimental data (points).</p>
Full article ">Figure 6
<p>Evolution of <span class="html-italic">M</span><sub>w</sub> and <span class="html-italic">Đ</span> versus reaction time for CPDB-mediated polymerization of TBDMSMA in toluene at 70 °C with initial concentration of CPDB ranging from 1.5 × 10<sup>−2</sup> to 6.0 × 10<sup>−2</sup> mol·L<sup>−1</sup>. The graph compares predicted values (lines) with experimental data (points).</p>
Full article ">Figure 7
<p>Evolution of monomer conversion and <span class="html-italic">M</span><sub>w</sub> versus reaction time for CPDB-mediated polymerization of TBDMSMA in toluene at 70 °C with initial concentration of AIBN ranging from 1.5 × 10<sup>−3</sup> to 6.0 × 10<sup>−3</sup> mol·L<sup>−1</sup>. The graph compares predicted values (lines) with experimental data (points).</p>
Full article ">Figure 8
<p>Evolution of <span class="html-italic">M</span><sub>w</sub> and <span class="html-italic">Đ</span> versus monomer conversion for CPDB-mediated polymerization of TBDMSMA in toluene at 70 °C with initial concentration of AIBN ranging from 1.5 × 10<sup>−3</sup> to 6.0 × 10<sup>−3</sup> mol·L<sup>−1</sup>. The graph compares predicted values (lines) with experimental data (points).</p>
Full article ">Scheme 1
<p>Detailed mechanism of the RAFT process.</p>
Full article ">
19 pages, 4860 KiB  
Article
Multi-Alkenylsilsesquioxanes as Comonomers and Active Species Modifiers of Metallocene Catalyst in Copolymerization with Ethylene
by Paweł Groch, Katarzyna Dziubek, Krystyna Czaja, Katarzyna Mituła and Beata Dudziec
Polymers 2018, 10(2), 223; https://doi.org/10.3390/polym10020223 - 24 Feb 2018
Cited by 9 | Viewed by 5018
Abstract
The copolymers of ethylene (E) with open-caged iso-butyl-substituted tri-alkenyl-silsesquioxanes (POSS-6-3 and POSS-10-3) and phenyl-substituted tetra-alkenyl-silsesquioxane (POSS-10-4) were synthesized by copolymerization over the ansa-metallocene catalyst. The influence of the kind of silsesquioxane and of the copolymerization conditions on the reaction performance and on [...] Read more.
The copolymers of ethylene (E) with open-caged iso-butyl-substituted tri-alkenyl-silsesquioxanes (POSS-6-3 and POSS-10-3) and phenyl-substituted tetra-alkenyl-silsesquioxane (POSS-10-4) were synthesized by copolymerization over the ansa-metallocene catalyst. The influence of the kind of silsesquioxane and of the copolymerization conditions on the reaction performance and on the properties of the copolymers was studied. In the case of copolymerization of E/POSS-6-3, the positive comonomer effect was observed, which was associated with the influence of POSS-6-3 on transformation of the bimetallic ion pair to the active catalytic species. Functionality of silsesquioxanes and polymerization parameters affected the polyhedral oligomeric silsesquioxanes (POSS) contents in the copolymers which varied in the range of 1.33–7.43 wt %. Tri-alkenyl-silsesquioxanes were incorporated into the polymer chain as pendant groups while the tetra-alkenyl-silsesquioxane derivative could act as a cross-linking agent which was proved by the changes in the contents of unsaturated end groups, by the glass transition temperature values, and by the gel contents (up to 81.3% for E/POSS-10-4). Incorporation of multi-alkenyl-POSS into the polymer chain affected also the melting and crystallization behaviors. Full article
(This article belongs to the Special Issue Olefin Polymerization and Polyolefin)
Show Figures

Graphical abstract

Graphical abstract
Full article ">Figure 1
<p>Structures of tri- and tetra-alkenyl-silsesquioxane comonomers.</p>
Full article ">Figure 2
<p>Effect of polyhedral oligomeric silsesquioxanes (POSS) comonomer on performance of ethylene copolymerization with POSS, over the <span class="html-italic">rac</span>-Et(Ind)<sub>2</sub>ZrCl<sub>2</sub>/MMAO catalytic system.</p>
Full article ">Figure 3
<p>Effect of the reaction time on the activity of the <span class="html-italic">rac</span>-Et(Ind)<sub>2</sub>ZrCl<sub>2</sub>/MMAO catalytic system in (co)polymerization.</p>
Full article ">Figure 4
<p><sup>1</sup>H NMR spectra in two different ranges (<b>a</b>,<b>b</b>) in toluene-d8 at 20 °C of <span class="html-italic">rac</span>-Et(Ind)<sub>2</sub>ZrCl<sub>2</sub> (1), MMAO (2), <span class="html-italic">rac</span>-Et(Ind)<sub>2</sub>ZrCl<sub>2</sub>/MMAO: Al/Zr = 50 (3), Al/Zr=100 (4), Al/Zr = 500 (5), Al/Zr = 1000 (6), and <span class="html-italic">rac</span>-Et(Ind)<sub>2</sub>ZrCl<sub>2</sub>/MMAO/POSS-6-3: Al/Zr = 50 (7); ([Zr] = 1.25 × 10<sup>−2</sup> mol/dm<sup>3</sup>).</p>
Full article ">Figure 5
<p>Proposed structures of catalytic intermediates formed within the <span class="html-italic">rac</span>-Et(Ind)<sub>2</sub>ZrCl<sub>2</sub>/MMAO catalytic system for the range of Al/Zr molar ratios used.</p>
Full article ">Figure 6
<p><sup>1</sup>H NMR spectra in toluene-d8 at 20 °C of <span class="html-italic">rac</span>-Et(Ind)<sub>2</sub>ZrCl<sub>2</sub>/MMAO/POSS-10-3: Al/Zr = 50 (1) and <span class="html-italic">rac</span>-Et(Ind)<sub>2</sub>ZrCl<sub>2</sub>/MMAO/POSS-10-4: Al/Zr = 50 (2); ([Zr] = 1.25 × 10<sup>−2</sup> mol/dm<sup>3</sup>).</p>
Full article ">Figure 7
<p><sup>1</sup>H NMR (<b>a</b>) and <sup>13</sup>C NMR (<b>b</b>) spectra of E/POSS-6-3 copolymer.</p>
Full article ">Figure 8
<p>FT-IR spectra for neat POSS comonomers, polyethylenes, and E/POSS copolymers obtained over <span class="html-italic">rac</span>-Et(Ind)<sub>2</sub>ZrCl<sub>2</sub> under ethylene pressure of 0.2 MPa (<b>a</b>) and 0.5 MPa (<b>b</b>) at the concentration of the POSS comonomer in the reaction feed of: 1.67 × 10<sup>−3</sup> mol/dm<sup>3</sup> (1) and 6.67 × 10<sup>−3</sup> mol/dm<sup>3</sup> (2).</p>
Full article ">Figure 9
<p>GPC curves for polyethylene and E/POSS copolymers obtained by the <span class="html-italic">rac</span>-Et(Ind)<sub>2</sub>ZrCl<sub>2</sub> catalyst.</p>
Full article ">Figure 10
<p>Unsaturation region in <sup>1</sup>H NMR spectra of E/POSS-10-3 copolymers for various contents of POSS: 1.65 wt % (1), 1.94 wt % (2), 3.25 wt % (3).</p>
Full article ">Figure 11
<p>Some possible ways of incorporation of tri- or tetra-alkenyl-POSS comonomers into the polymer chain for ethylene/POSS copolymers: POSS as a pendant group (type <b>I</b>), intermolecular cyclic group (type <b>II</b>), and POSS as a cross-linking agent (type <b>III</b>).</p>
Full article ">Figure 12
<p>DSC curves of glass transition of selected ethylene copolymers with tri- (<b>a</b>) or tetra-alkenyl-silsesquioxane (<b>b</b>).</p>
Full article ">Figure 13
<p>DSC curves of neat polyethylene and E/POSS copolymers synthesized by <span class="html-italic">rac</span>-Et(Ind)<sub>2</sub>ZrCl<sub>2</sub> (p<sub>e</sub> = 0.5 MPa) (<b>a</b>,<b>b</b>).</p>
Full article ">
14 pages, 3809 KiB  
Article
Effects of Particle Size and Surface Chemistry on the Dispersion of Graphite Nanoplates in Polypropylene Composites
by Raquel M. Santos, Sacha T. Mould, Petr Formánek, Maria C. Paiva and José A. Covas
Polymers 2018, 10(2), 222; https://doi.org/10.3390/polym10020222 - 24 Feb 2018
Cited by 25 | Viewed by 5568
Abstract
Carbon nanoparticles tend to form agglomerates with considerable cohesive strength, depending on particle morphology and chemistry, thus presenting different dispersion challenges. The present work studies the dispersion of three types of graphite nanoplates (GnP) with different flake sizes and bulk densities in a [...] Read more.
Carbon nanoparticles tend to form agglomerates with considerable cohesive strength, depending on particle morphology and chemistry, thus presenting different dispersion challenges. The present work studies the dispersion of three types of graphite nanoplates (GnP) with different flake sizes and bulk densities in a polypropylene melt, using a prototype extensional mixer under comparable hydrodynamic stresses. The nanoparticles were also chemically functionalized by covalent bonding polymer molecules to their surface, and the dispersion of the functionalized GnP was studied. The effects of stress relaxation on dispersion were also analyzed. Samples were removed along the mixer length, and characterized by microscopy and dielectric spectroscopy. A lower dispersion rate was observed for GnP with larger surface area and higher bulk density. Significant re-agglomeration was observed for all materials when the deformation rate was reduced. The polypropylene-functionalized GnP, characterized by increased compatibility with the polymer matrix, showed similar dispersion effects, albeit presenting slightly higher dispersion levels. All the composites exhibit dielectric behavior, however, the alternate current (AC) conductivity is systematically higher for the composites with larger flake GnP. Full article
(This article belongs to the Special Issue Polymer Nanocomposites)
Show Figures

Graphical abstract

Graphical abstract
Full article ">Figure 1
<p>Prototype small-scale mixer, with two mixing zones separated by a large diameter channel. Each mixing zone contains a series of circular channels with alternating diameters, creating sequences of converging/diverging flows. Removing the sleeve and separating the individual rings gives access to material samples for subsequent characterization.</p>
Full article ">Figure 2
<p>TEM micrographs of as-received GnPC, GnPM, and GnPH (<b>a</b>,<b>c</b>,<b>e</b>) and <span class="html-italic">f</span>GnPC-PP, <span class="html-italic">f</span>GnPM-PP, and <span class="html-italic">f</span>GnPH-PP (<b>b</b>,<b>d</b>,<b>f</b>).</p>
Full article ">Figure 3
<p>Optical micrographs of samples of PP nanocomposites containing GnP and <span class="html-italic">f</span>GnP-PP collected from a prototype small-scale extensional mixer.</p>
Full article ">Figure 4
<p>TEM micrographs of the GnPC composite collected along the extensional mixer.</p>
Full article ">Figure 5
<p>Representation of the cumulative agglomerate area distribution measured for the PP/GnP and PP/<span class="html-italic">f</span>GnP-PP composites collected along the mixer.</p>
Full article ">Figure 6
<p>Evolution of dispersion (in terms of Area Ratio, <span class="html-italic">A</span><sub>r</sub>) along the length of the extensional mixer of GnP and <span class="html-italic">f</span>GnP-PP in a PP melt matrix.</p>
Full article ">Figure 7
<p>AC electrical conductivity of PP nanocomposites with 2 wt % of (<b>a</b>) as-received GnP and (<b>b</b>) <span class="html-italic">f</span>GnP-PP.</p>
Full article ">
13 pages, 2927 KiB  
Article
Synthesis and Crosslinking of Polyether-Based Main Chain Benzoxazine Polymers and Their Gas Separation Performance
by Muntazim Munir Khan, Karabi Halder, Sergey Shishatskiy and Volkan Filiz
Polymers 2018, 10(2), 221; https://doi.org/10.3390/polym10020221 - 23 Feb 2018
Cited by 33 | Viewed by 10876
Abstract
The poly(ethylene glycol)-based benzoxazine polymers were synthesized via a polycondensation reaction between Bisphenol-A, paraformaldehyde, and poly(ether diamine)/(Jeffamine®). The structures of the polymers were confirmed by proton nuclear magnetic resonance spectroscopy (1H-NMR), indicating the presence of a cyclic benzoxazine ring. [...] Read more.
The poly(ethylene glycol)-based benzoxazine polymers were synthesized via a polycondensation reaction between Bisphenol-A, paraformaldehyde, and poly(ether diamine)/(Jeffamine®). The structures of the polymers were confirmed by proton nuclear magnetic resonance spectroscopy (1H-NMR), indicating the presence of a cyclic benzoxazine ring. The polymer solutions were casted on the glass plate and cross-linked via thermal treatment to produce tough and flexible films without using any external additives. Thermal properties and the crosslinking behaviour of these polymers were studied by thermogravimetric analysis (TGA) and differential scanning calorimetry (DSC). Single gas (H2, O2, N2, CO2, and CH4) transport properties of the crosslinked polymeric membranes were measured by the time-lag method. The crosslinked PEG-based polybenzoxazine membranes show improved selectivities for CO2/N2 and CO2/CH4 gas pairs. The good separation selectivities of these PEG-based polybenzoxazine materials suggest their utility as efficient thin film composite membranes for gas and liquid membrane separation technology. Full article
(This article belongs to the Special Issue Polymeric Membranes)
Show Figures

Graphical abstract

Graphical abstract
Full article ">Figure 1
<p><sup>1</sup>H NMR spectra of (<b>a</b>) Jeffamine<sup>®</sup> (JD-230) (<b>b</b>) Jeffamine<sup>®</sup> benzoxazine polymer [Poly(BZ-JD230)].</p>
Full article ">Figure 2
<p>DSC thermograms (second heating cycle) of (<b>a</b>) uncrosslinked and (<b>b</b>) crosslinked PEG-based polybenzoxazine.</p>
Full article ">Figure 3
<p>Physical appearance of crosslinked polybenzoxazine films.</p>
Full article ">Figure 4
<p>TGA of crosslinked PEG-based polybenzoxazine.</p>
Full article ">Figure 5
<p>Dependence of gas solubility coefficients as a function of critical temperature (T<sub>c</sub>) of gas molecules for PEG-based polybenzoxazine.</p>
Full article ">Figure 6
<p>Dependence of gas diffusivity coefficients as a function of effective kinetic diameter of gas molecules for PEG-based polybenzoxazine.</p>
Full article ">Figure 7
<p>Robeson plot for (<b>a</b>) CO<sub>2</sub>/N<sub>2</sub> and (<b>b</b>) CO<sub>2</sub>/CH<sub>4</sub> gas pair showing data for PEG-based polybenzoxazine films measured at 30°C. [●—Poly(BZ-JD230), <span style="color:red">▲</span>—Poly(BZ-JED600), and <span style="color:blue">▼</span>—Poly(BZ-JED900)].</p>
Full article ">Figure 7 Cont.
<p>Robeson plot for (<b>a</b>) CO<sub>2</sub>/N<sub>2</sub> and (<b>b</b>) CO<sub>2</sub>/CH<sub>4</sub> gas pair showing data for PEG-based polybenzoxazine films measured at 30°C. [●—Poly(BZ-JD230), <span style="color:red">▲</span>—Poly(BZ-JED600), and <span style="color:blue">▼</span>—Poly(BZ-JED900)].</p>
Full article ">Scheme 1
<p>Synthesis of PEG-based main-chain polybenzoxazine.</p>
Full article ">Scheme 2
<p>Predicted crosslinking mechanism of PEG-based polybenzoxazine.</p>
Full article ">
17 pages, 4107 KiB  
Article
Adsorption of Polyelectrolyte onto Nanosilica Synthesized from Rice Husk: Characteristics, Mechanisms, and Application for Antibiotic Removal
by Tien Duc Pham, Thu Thuy Bui, Van Thanh Nguyen, Thi Kieu Van Bui, Thi Thuy Tran, Quynh Chi Phan, Tien Dat Pham and Thu Ha Hoang
Polymers 2018, 10(2), 220; https://doi.org/10.3390/polym10020220 - 23 Feb 2018
Cited by 75 | Viewed by 10950
Abstract
Adsorption of the polyelectrolyte polydiallyldimethylammonium chloride (PDADMAC) onto nanosilica (SiO2) fabricated from rice husk was studied in this work. Nanosilica was characterized by X-ray diffraction, Fourier-transform infrared spectroscopy (FTIR), and scanning electron microscopy (SEM). Adsorption of PDADMAC onto SiO2 increased [...] Read more.
Adsorption of the polyelectrolyte polydiallyldimethylammonium chloride (PDADMAC) onto nanosilica (SiO2) fabricated from rice husk was studied in this work. Nanosilica was characterized by X-ray diffraction, Fourier-transform infrared spectroscopy (FTIR), and scanning electron microscopy (SEM). Adsorption of PDADMAC onto SiO2 increased with increasing pH because the negative charge of SiO2 is higher at high pH. Adsorption isotherms of PDADMAC onto silica at different KCl concentrations were fitted well by a two-step adsorption model. Adsorption mechanisms of PDADMAC onto SiO2 are discussed on the basis of surface charge change, evaluation by ζ potential, surface modification by FTIR measurements, and the adsorption isotherm. The application of PDADMAC adsorption onto SiO2 to remove amoxicillin antibiotic (AMX) was also studied. Experimental conditions such as contact time, pH, and adsorbent dosage for removal of AMX using SiO2 modified with PDADMAC were systematically optimized and found to be 180 min, pH 10, and 10 mg/mL, respectively. The removal efficiency of AMX using PDADMAC-modified SiO2 increased significantly from 19.1% to 92.3% under optimum adsorptive conditions. We indicate that PDADMAC-modified SiO2 rice husk is a novel adsorbent for removal of antibiotics from aqueous solution. Full article
(This article belongs to the Special Issue Polymer-Based Nano-Sorbent Materials)
Show Figures

Graphical abstract

Graphical abstract
Full article ">Figure 1
<p>Chemical structure of polydiallyldimethylammonium chloride (PDADMAC) (<b>A</b>) amoxicillin (AMX) (<b>B</b>).</p>
Full article ">Figure 2
<p>Pictures of (<b>A</b>) rice husk; (<b>B</b>) milled rice husk; and (<b>C</b>) synthesized nanosilica.</p>
Full article ">Figure 3
<p>XRD pattern of nanosilica synthesized from rice husk.</p>
Full article ">Figure 4
<p>FTIR spectrum of nanosilica particles in the wave number range 400–4000 cm<sup>−1</sup>.</p>
Full article ">Figure 5
<p>SEM images of SiO<sub>2</sub> nanoparticles at different scales: (<b>A</b>) 500 nm; and (<b>B</b>) 300 nm.</p>
Full article ">Figure 6
<p>Effect of pH on PDADMAC adsorption on nanosilica. (<span class="html-italic">C<sub>i</sub></span> (PDADMAC) = 1.0 g/L, adsorbent dosage 10 mg/mL, 100 mM KCl). Error bars show standard deviations of three replicates.</p>
Full article ">Figure 7
<p>Effect of KCl concentration on PDADMAC adsorption on nanosilica (<span class="html-italic">C</span><sub>i</sub> (PDADMAC) = 1.0 g/L M, adsorbent dosage 10 mg/mL). Error bars show standard deviations of three replicates.</p>
Full article ">Figure 8
<p>Adsorption isotherms of PDADMAC onto nanosilica at different KCl concentrations (pH 10). Points are experimental data; solid lines are the results of the two-step adsorption model. Error bars show standard deviations of three replicates.</p>
Full article ">Figure 9
<p>The ζ potentials of nanosilica particles without and with PDADMAC adsorption as a function of pH in 1 mM KCl background electrolyte.</p>
Full article ">Figure 10
<p>FTIR spectrum of nanosilica particles after PDADMAC adsorption in the wave number range of 400–4000 cm<sup>–1</sup>. The inset is an FTIR spectrum of PDADMAC solution.</p>
Full article ">Figure 11
<p>Cartoon representation of PDADMAC adsorption onto nanosilica rice husk.</p>
Full article ">Figure 12
<p>Influence of contact time on removal of amoxicillin (AMX) using PDADMAC-modified silica (PMS). Error bars show standard deviations of three replicates.</p>
Full article ">Figure 13
<p>Influence of pH on removal of AMX using PMS. Error bars show standard deviations of three replicates.</p>
Full article ">Figure 14
<p>Influence of adsorbent dosage on removal of AMX using PMS. Error bars show standard deviations of three replicates.</p>
Full article ">Figure 15
<p>Removal of AMX using silica without and with PDADMAC modification. Error bars show standard deviations of three replicates.</p>
Full article ">Figure 16
<p>Efficiency of removing AMX with PMS after being reused three times. Error bars show standard deviations of three replicates of independently-prepared adsorbent.</p>
Full article ">
16 pages, 2421 KiB  
Article
Synthesis of Waterborne Polyurethane by the Telechelic α,ω-Di(hydroxy)poly(n-butyl acrylate)
by Xin Chen, Chi Zhang, Weidong Li, Lei Chen and Wusheng Wang
Polymers 2018, 10(2), 219; https://doi.org/10.3390/polym10020219 - 23 Feb 2018
Cited by 7 | Viewed by 5524
Abstract
A key for the preparation of polyacrylate-based polyurethane is the synthesis of hydroxyl-terminated polyacrylate. To our knowledge, exactly one hydroxyl group of every polyacrylate chain has not been reported. The hydroxyl-terminated poly(butyl acrylate) (PBA) has been successfully synthesized by degenerative iodine transfer polymerization [...] Read more.
A key for the preparation of polyacrylate-based polyurethane is the synthesis of hydroxyl-terminated polyacrylate. To our knowledge, exactly one hydroxyl group of every polyacrylate chain has not been reported. The hydroxyl-terminated poly(butyl acrylate) (PBA) has been successfully synthesized by degenerative iodine transfer polymerization (DITP) of the n-butyl acrylate (n-BA) using 4,4′-azobis(4-cyano-1-pentanol) (ACPO) and diiodoxylene (DIX) as initiator and chain transfer agent, respectively, and subsequently substituted reaction of the iodine-terminated PBA with β-mercaptoethanol in alkaline condition. The latter reaction was highly efficient, and the terminal iodine at the end of polymer chains were almost quantitatively transformed to a hydroxyl group. 2,2′-Azobis(isobutyronitrile) (AIBN) and ACPO were used as initiators in the DITPs of n-BA. The results demonstrated that they had a significant influence on the terminal groups of the formed polymer chains. The structure, molecular weight, and molecular weight distribution of the hydroxyl-terminated PBA have been studied by 1H, 13C NMR, and GPC results. The components of hydroxyl-terminated PBA were determined by MALDI-TOF MS spectra, and their formation is discussed. The broad molecular weight distribution of the PBA and the difference in the polymerization behaviors from typical living radical polymerization are explained based on the results of 1H NMR and MALDI-TOF MS spectra. The hydroxyl-terminated PBA has been successfully used in the preparation of PBA-based polyurethane dispersions (PUDs). The aqueous PUDs were stable, and based on the DSC results it can be said that the miscibility of hard segments with PBA chains was improved. Full article
(This article belongs to the Special Issue Tailored Polymer Synthesis by Advanced Polymerization Techniques)
Show Figures

Graphical abstract

Graphical abstract
Full article ">Figure 1
<p><sup>1</sup>H NMR spectra of the polymers respectively obtained from (<b>a</b>) the DITP of <span class="html-italic">n</span>-BA using AIBN as initiator and DIX as transfer agent for 1 h, and (<b>b</b>) for complete consumption of BA. (<b>c</b>) The polymer obtained after converting the iodide group at the ends of the polymer in (b) into the hydroxyl group through reaction with β-mercaptoethanol.</p>
Full article ">Figure 2
<p>Gel permeation chromatography (GPC) curves of the polymer obtained from the DITP of <span class="html-italic">n</span>-BA with feed molar ratios of [<span class="html-italic">n</span>-BA]/[ACPO]/DIX] = 16/0.08/1 (<span class="html-italic">M</span><sub>n,GPC</sub> = 3200 g/mol).</p>
Full article ">Figure 3
<p><sup>1</sup>H NMR spectrum of the poly(butyl acrylate) (PBA) synthesized by DITP of the <span class="html-italic">n</span>-BA with feed molar ratio of [<span class="html-italic">n</span>-BA]/[ACPO]/[DIX] = 16/0.08/1 at 60 °C for 24 h (<span class="html-italic">M</span><sub>n,GPC</sub> = 3200 g/mol). ACPO: 4,4′-azobis(4-cyano-1-pentanol).</p>
Full article ">Figure 4
<p><sup>13</sup>C NMR spectrum of the PBA synthesized by DITP of the <span class="html-italic">n</span>-BA with feed molar ratio of [<span class="html-italic">n</span>-BA]/[ACPO]/[DIX] = 16/0.08/1 at 60 °C for 24 h (<span class="html-italic">M</span><sub>n,GPC</sub> = 3200 g/mol).</p>
Full article ">Figure 5
<p>(<b>a</b>) Mass-assisted laser desorption ionization time-of-flight mass spectrometry (MALDI-TOF) spectrum and (<b>b</b>) enlarged spectrum of the hydroxyl-terminated PBA obtained by DITP of <span class="html-italic">n</span>-BA with feed molar ratio of [<span class="html-italic">n-</span>BA]/[ACPO]/DIX = 16/0.5/1 in toluene at 60 °C for 24 h (<span class="html-italic">M</span><sub>n,GPC</sub> = 4280 g/mol).</p>
Full article ">Figure 6
<p>Degenerative iodine transfer polymerization of <span class="html-italic">n</span>-BA with molar ratio of [<span class="html-italic">n</span>-BA]/[ACPO]/[DIX] = 16/0.08/1 at 60 °C for different times. Dependence of (<b>a</b>) molecular weight and (<b>b</b>) molecular weight distribution on the conversion of <span class="html-italic">n</span>-BA. The line with solid circles presents the theoretical number-average molecular weight; and the line with solid squares is the molecular weight obtained by GPC in (a).</p>
Full article ">Figure 7
<p>The particle size distribution diagram of the aqueous polyacrylate-based polyurethane by poly(<span class="html-italic">n</span>-butyl acrylate) diol.</p>
Full article ">Figure 8
<p>DSC thermograms of the hydroxyl-terminated PBA (a) and the PBA-based PUD (b).</p>
Full article ">Scheme 1
<p>Mechanism of the degenerative iodine transfer polymerization of <span class="html-italic">n</span>-BA.</p>
Full article ">Scheme 2
<p>Possible intermediates formed in the DITP of <span class="html-italic">n</span>-BA.</p>
Full article ">
8 pages, 3864 KiB  
Communication
Nanosphere Lithography of Chitin and Chitosan with Colloidal and Self-Masking Patterning
by Rakkiyappan Chandran, Kyle Nowlin and Dennis R. LaJeunesse
Polymers 2018, 10(2), 218; https://doi.org/10.3390/polym10020218 - 23 Feb 2018
Cited by 9 | Viewed by 10218
Abstract
Complex surface topographies control, define, and determine the properties of insect cuticles. In some cases, these nanostructured materials are a direct extension of chitin-based cuticles. The cellular mechanisms that generate these elaborate chitin-based structures are unknown, and involve complicated cellular and biochemical “bottom-up” [...] Read more.
Complex surface topographies control, define, and determine the properties of insect cuticles. In some cases, these nanostructured materials are a direct extension of chitin-based cuticles. The cellular mechanisms that generate these elaborate chitin-based structures are unknown, and involve complicated cellular and biochemical “bottom-up” processes. We demonstrated that a synthetic “top-down” fabrication technique—nanosphere lithography—generates surfaces of chitin or chitosan that mimic the arrangement of nanostructures found on the surface of certain insect wings and eyes. Chitin and chitosan are flexible and biocompatible abundant natural polymers, and are a sustainable resource. The fabrication of nanostructured chitin and chitosan materials enables the development of new biopolymer materials. Finally, we demonstrated that another property of chitin and chitosan—the ability to self-assemble nanosilver particles—enables a novel and powerful new tool for the nanosphere lithographic method: the ability to generate a self-masking thin film. The scalability of the nanosphere lithographic technique is a major limitation; however, the silver nanoparticle self-masking enables a one-step thin-film cast or masking process, which can be used to generate nanostructured surfaces over a wide range of surfaces and areas. Full article
(This article belongs to the Special Issue Advances in Chitin/Chitosan Characterization and Applications)
Show Figures

Graphical abstract

Graphical abstract
Full article ">Figure 1
<p>The source of chitin for the colloidal/nanosphere lithography substrate. (<b>A</b>) A forewing from the periodic 17-year cicada Brood II <span class="html-italic">Magicicada septendecim</span>; (<b>B</b>) SEM micrograph of the inter-vein (clear) regions of a wing showing an array of hemispherical nano-features, which is a rough hexagonal close-packed arrangement; (<b>C</b>) A forewing from the periodic 17-year cicada Brood II <span class="html-italic">Magicicada septendecim</span> after in situ chitin purification. Note the loss of all pigment and color from the wing; (<b>D</b>) The surface of the inter-vein region showing the loss of the array of nanofeatures, and the presence of a nanoscale fibrous network.</p>
Full article ">Figure 2
<p>Schematic of the colloidal/nanosphere lithographic process. Step (1) preparation of biopolymer substrate; Step (2) nanosphere masking of substrate; Step (3) Reactive ion etching of masked substrate; and Step (4) completed NSS.</p>
Full article ">Figure 3
<p>Colloidal/nanosphere lithography on chitin substrate derived from the wing of the periodic 17-year cicada Brood II <span class="html-italic">Magicicada septendecim.</span> (<b>A</b>) A nanosphere mask on the chitin substrate. Notice the filaments emanating from the chitin surface to the nanospheres, and the presence of a fibrous network on the nanospheres (as noted by the arrows); (<b>B</b>) An array of chitin nanocones after the etching process. The inset shows the presence of longitudinal ridges along the nanocones; (<b>C</b>) The array of chitin nanocones after incubation in an aqueous solution; note the loss of organization in the array and the structure of the nanocones.</p>
Full article ">Figure 4
<p>Colloidal/nanosphere lithography on drop-cast chitosan thin films. (<b>A</b>) A drop-cast chitosan thin film; note the layers of chitosan nanoscale fibers; (<b>B</b>) 300 nm nanosphere mask on chitosan thin film—note the distortion of the polystyrene nanospheres as they are stretched across the surface of the chitosan substrate; (<b>C</b>) Post-reactive ion etch of a nanosphere-masked chitosan substrate—note the high-aspect ratio nanocone arrays; (<b>D</b>) Flexible nanostructured chitosan thin film.</p>
Full article ">Figure 5
<p>Nanostructured surfaces generated on a self-masking AgNP–chitosan thin film by colloidal-nanosphere lithography. (<b>A</b>) Chitosan–AgNP composite thin film generated by a chitosan–AgNP solution (inset); note the presence of cuboidal AgNP embedded within the film (denoted by arrows) (<b>B</b>) Post-reactive ion etch of the self-masked chitosan–AgNP composite thin film; note that the array is less-organized without a nanosphere mask compared to with one, and note the presence of colloidal AgNP at the nanocone apex. (<b>C</b>,<b>D</b>) Demonstration of the flexibility of the nanostructured chitosan–AgNP composite thin films.</p>
Full article ">
22 pages, 2783 KiB  
Review
Recent Developments in Graphene/Polymer Nanocomposites for Application in Polymer Solar Cells
by Ana Maria Díez-Pascual, José Antonio Luceño Sánchez, Rafael Peña Capilla and Pilar García Díaz
Polymers 2018, 10(2), 217; https://doi.org/10.3390/polym10020217 - 22 Feb 2018
Cited by 113 | Viewed by 9903
Abstract
Graphene (G) and its derivatives, graphene oxide (GO) and reduced graphene oxide (rGO) have enormous potential for energy applications owing to their 2D structure, large specific surface area, high electrical and thermal conductivity, optical transparency, and huge mechanical strength combined with inherent flexibility. [...] Read more.
Graphene (G) and its derivatives, graphene oxide (GO) and reduced graphene oxide (rGO) have enormous potential for energy applications owing to their 2D structure, large specific surface area, high electrical and thermal conductivity, optical transparency, and huge mechanical strength combined with inherent flexibility. The combination of G-based materials with polymers leads to new nanocomposites with enhanced structural and functional properties due to synergistic effects. This review briefly summarizes recent progress in the development of G/polymer nanocomposites for use in polymer solar cells (PSCs). These nanocomposites have been explored as transparent conducting electrodes (TCEs), active layers (ALs) and interfacial layers (IFLs) of PSCs. Photovoltaic parameters, such as the open-circuit voltage (Voc), short-circuit current density (Jsc), fill factor (FF) and power-conversion efficiency (PCE) are compared for different device structures. Finally, future perspectives are discussed. Full article
(This article belongs to the Special Issue Nanoparticle-Reinforced Polymers)
Show Figures

Figure 1

Figure 1
<p>Chemical structure of conjugated polymers typically used in PSCs.</p>
Full article ">Figure 2
<p>Schematic representation of sulfonated graphene (SG)/poly(3,4-ethylenedioxythiophene):poly(styrenesulfonate) (PEDOT) nanocomposite and its synthesis-reaction conditions. Reprinted from Ref. [<a href="#B44-polymers-10-00217" class="html-bibr">44</a>].</p>
Full article ">Figure 3
<p>(<b>A</b>) Schematic representation and band structure of a PSC with the structure glass/indium tin oxide (ITO)/ZnO/P3HT:PCBM/Au/PEDOT:PSS/G; (<b>B</b>) J–V characteristics measured from two sides of the PSC with G top electrode and different active layer thicknesses. Reproduced with permission from Ref. [<a href="#B53-polymers-10-00217" class="html-bibr">53</a>].</p>
Full article ">Figure 4
<p>(<b>a</b>) Scheme of the electrochemical exfoliation of graphite; (<b>b</b>) optical images of the exfoliation process; (<b>c</b>) schematic representation of spray deposition of exfoliated graphene (EG) dispersion onto poly(ethylene 2,6-naphthalate) (PEN); (<b>d</b>) J–V characteristics of the cell under light (solid line) and dark conditions (dashed line). Reprinted with permission from [<a href="#B55-polymers-10-00217" class="html-bibr">55</a>].</p>
Full article ">Figure 5
<p>(<b>a</b>) Schematic representation of the PSC with G anode and structure G/PEDOT:PEG(PC)/PEDOT:PSS/DBP/C<sub>60</sub>/BCP/Al; (<b>b</b>) cross-sectional transmission electron microscope (TEM) image (left) of the device described in (<b>a</b>), with an energy-dispersive line scan on a diagram of the device cross-section (right); (<b>c</b>) flat-band energy level diagram of the PSC; (<b>d</b>) J–V characteristics of the G-based device compared to ITO reference cells (red and blue lines, respectively). Reproduced with permission from Ref. [<a href="#B57-polymers-10-00217" class="html-bibr">57</a>].</p>
Full article ">Figure 6
<p>(<b>A</b>) Schematic representation of ITO/PEDOT:PSS/G-P3HT:C<sub>60</sub>/Al PSC; and (<b>B</b>) J–V characteristics using P3HT:C<sub>60</sub> or G-P3HT:C<sub>60</sub> as the active layer. Reproduced with permission from Ref. [<a href="#B64-polymers-10-00217" class="html-bibr">64</a>].</p>
Full article ">Figure 7
<p>(<b>A</b>) Schematic representation; and (<b>B</b>) J–V curves of ITO/PEDOT:PSS/P3HT:GQDs/Al device based on aniline-modified GQDs with different GQDs content. Reproduced with permission from Ref. [<a href="#B66-polymers-10-00217" class="html-bibr">66</a>,<a href="#B67-polymers-10-00217" class="html-bibr">67</a>].</p>
Full article ">Figure 8
<p>(<b>A</b>) Schematic representation of the synthesis of graphene oxide quantum dots (GOQDs) and reduced graphene oxide quantum dots (rGOQDs), where the edge functional groups are controlled by adjusting the thermal reduction time; (<b>B</b>) J–V curves of the PSCs with different types of GQDs. Reproduced with permission from Ref. [<a href="#B69-polymers-10-00217" class="html-bibr">69</a>].</p>
Full article ">Figure 9
<p>(<b>A</b>) Schematic representation of ITO/ZnO@G:EC/P3HT:PC<sub>61</sub>BM/MoO<sub>3</sub>/Ag device; (<b>B</b>) atomic force microscope (AFM) images of ZnO@G:EC nanocomposites with different G contents; (<b>C</b>) J–V curves of PSCs with the different nanocomposites. Reproduced with permission from Ref. [<a href="#B75-polymers-10-00217" class="html-bibr">75</a>].</p>
Full article ">Scheme 1
<p>Schematic representation of a typical (<b>a</b>) and inverted (<b>b</b>) polymer solar cell (PSC).</p>
Full article ">Scheme 2
<p>Schematic representation of the structure of graphene (G), graphene oxide (GO) and reduced graphene oxide (rGO).</p>
Full article ">
14 pages, 4148 KiB  
Article
Mechanism Analysis of Selective Adsorption and Specific Recognition by Molecularly Imprinted Polymers of Ginsenoside Re
by Wei Zhang, Qian Li, Jingxiang Cong, Bofeng Wei and Shaoyan Wang
Polymers 2018, 10(2), 216; https://doi.org/10.3390/polym10020216 - 22 Feb 2018
Cited by 19 | Viewed by 4694
Abstract
In this article, the molecularly imprinted polymers (MIPs) of ginsenoside Re (Re) were synthesized by suspension polymerization with Re as the template molecule, methacrylic acid (MAA) as the functional monomers, and ethyl glycol dimethacrylate (EGDMA) as the crosslinker. The MIPs were characterized by [...] Read more.
In this article, the molecularly imprinted polymers (MIPs) of ginsenoside Re (Re) were synthesized by suspension polymerization with Re as the template molecule, methacrylic acid (MAA) as the functional monomers, and ethyl glycol dimethacrylate (EGDMA) as the crosslinker. The MIPs were characterized by Fourier transform infrared spectroscopy (FTIR), Field emission scanning electron microscopy (FESEM), and surface porosity detector, and the selective adsorption and specific recognition of MIPs were analyzed using the theory of kinetics and thermodynamics. The experimental results showed that compared with non-imprinted polymers (NIPs), MIPs had a larger specific surface area and special pore structure and that different from the Langmuir model of NIPs, the static adsorption isotherm of MIPs for Re was in good agreement with the Freundlich model based on the two adsorption properties of MIPs. The curves of the adsorption dynamics and the lines of kinetic correlation indicate that there was a fast and selective adsorption equilibrium for Re because of the affinity of MIPs to the template rather than its analogue of ginsenoside Rg1 (Rg1). The study of thermodynamics indicate that the adsorption was controlled by enthalpy and that MIPs had higher enthalpy and entropy than NIPs, which contributed to the specific recognition of MIPs. Full article
(This article belongs to the Special Issue Mechanics of Emerging Polymers with Unprecedented Networks)
Show Figures

Graphical abstract

Graphical abstract
Full article ">Figure 1
<p>Structures of ginsenoside Re (<b>a</b>) and ginsenoside Rg1 (<b>b</b>).</p>
Full article ">Figure 2
<p>Scheme for the preparation of molecularly imprinted polymers of Re (molecularly imprinted polymers (MIPs)).</p>
Full article ">Figure 3
<p>FTIR spectra of MIPs (a), MIP precursor (b), and non-imprinted polymers (NIPs) (c).</p>
Full article ">Figure 4
<p>FESEM images of MIPs (<b>a</b>) and NIPs (<b>b</b>).</p>
Full article ">Figure 5
<p>Nitrogen adsorption/desorption isotherms for MIPs and NIPs.</p>
Full article ">Figure 6
<p>The adsorption dynamics curves of the MIPs and NIPs ((<b>a</b>), Re; (<b>b</b>), Rg1). Adsorption conditions: 20 mL of 0.4 mg/mL solutions (methanol) of Re or Rg1 with 50 mg of MIPs or NIPs.</p>
Full article ">Figure 7
<p>Scatchard plots of MIPs (<b>a</b>) and NIPs (<b>b</b>) for Re.</p>
Full article ">Figure 8
<p>Kinetically correlating the relative adsorption of Re and Rg1 (<b>a</b>) and the relative adsorption of MIPs and NIPs (<b>b</b>).</p>
Full article ">Figure 9
<p><span class="html-italic">Langmuir</span> (<b>a</b>) and <span class="html-italic">Freundlich</span> (<b>b</b>) isotherms for the adsorption of NIPs and MIPs.</p>
Full article ">Figure 10
<p>Thermodynamically correlating the relative adsorption of Re.</p>
Full article ">Figure 11
<p>Chromatograms of (<b>a</b>) the crude extract of ginsenosides and (<b>b</b>) the collected elution with MIPs-SPE.</p>
Full article ">
15 pages, 1708 KiB  
Article
Advantageous Microwave-Assisted Suzuki Polycondensation for the Synthesis of Aniline-Fluorene Alternate Copolymers as Molecular Model with Solvent Sensing Properties
by Rebeca Vázquez-Guilló, Alberto Falco, M. José Martínez-Tomé, C. Reyes Mateo, María Antonia Herrero, Ester Vázquez and Ricardo Mallavia
Polymers 2018, 10(2), 215; https://doi.org/10.3390/polym10020215 - 22 Feb 2018
Cited by 14 | Viewed by 6094
Abstract
Polymerization via Suzuki coupling under microwave (µW) irradiation has been studied for the synthesis of poly{1,4-(2/3-aminobenzene)-alt-2,7-(9,9-dihexylfluorene)} (PAF), chosen as molecular model. Briefly, µW-assisted procedures accelerated by two orders of magnitude the time required when using classical polymerization processes, and [...] Read more.
Polymerization via Suzuki coupling under microwave (µW) irradiation has been studied for the synthesis of poly{1,4-(2/3-aminobenzene)-alt-2,7-(9,9-dihexylfluorene)} (PAF), chosen as molecular model. Briefly, µW-assisted procedures accelerated by two orders of magnitude the time required when using classical polymerization processes, and the production yield was increased (>95%). In contrast, although the sizes of the polymers that were obtained by non-conventional heating reactions were reproducible and adequate for most applications, with this methodology the molecular weight of final polymers were not increased with respect to conventional heating. Asymmetric orientation of the amine group within the monomer and the assignments of each dyad or regioregularity, whose values ranged from 38% to 95% with this molecule, were analysed using common NMR spectroscopic data. Additionally, the synthesis of a new cationic polyelectrolyte, poly{1,4-(2/3-aminobenzene)-co-alt-2,7-[9,9´-bis(6’’-N,N,N-trimethylammonium-hexyl)fluorene]} dibromide (PAFAm), from poly{1,4-(2/3-aminobenzene)-co-alt-2,7-[9,9´-bis(6’’-bromohexyl)fluorene]} (PAFBr) by using previously optimized conditions for µW-assisted heating procedures was reported. Finally, the characterization of the final products from these batches showed unkown interesting solvatochromic properties of the PAF molecule. The study of the solvatochromism phenomena, which was investigated as a function of the polarity of the solvents, showed a well-defined Lippert correlation, indicating that the emission shift observed in PAF might be due to its interaction with surrounding environment. Proven high sensitivity to changes of its environment makes PAF a promising candidate of sensing applications. Full article
(This article belongs to the Special Issue Tailored Polymer Synthesis by Advanced Polymerization Techniques)
Show Figures

Graphical abstract

Graphical abstract
Full article ">Figure 1
<p>Suzuki coupling of poly-{1,4-(2/3-amino)benzene-<span class="html-italic">co</span>-<span class="html-italic">alt</span>-[9,9-bis(6´-X-hexyl)-2,7-fluorene]} derivatives (<b>PAF</b>, X = –CH<sub>3</sub>; <b>PAFBr</b>, X = –CH<sub>2</sub>Br and <b>PAFAm</b>, X = –CH<sub>2</sub>NMe<sub>3</sub> Br).</p>
Full article ">Figure 2
<p>Enlarged region of <sup>1</sup>H-NMR spectra (CDCl<sub>3</sub>, 500 MHz) corresponding to amine protons areas for two <b>PAFs</b> batches. Four dyads and formula of regioregularity (RR) in this proposed model.</p>
Full article ">Figure 3
<p>Effect of the time polymerization in microwave-assisted in SPS mode (µW-SPS) (empty squares) and classical heating (filled circles) at different temperatures (135 °C for µW-assisted and 80 °C for conventional heating) versus percentage of yield (<b>left</b>), regioregularity RR (<b>middle</b>) and weight-average molecular weigth, <span class="html-italic">M</span>w (<b>right</b>).</p>
Full article ">Figure 4
<p>Temperature variation in microwave-assisted polymerizations (µW-SPS) respect to percentage of yield (<b>left</b>), regioregularity RR (<b>middle</b>), and weight-average molecular weigth, <span class="html-italic">M</span>w (<b>right</b>).</p>
Full article ">Figure 5
<p>Comparative FT-IR spectra of new polymers synthesized <b>PAFBr</b> and <b>PAFAm,</b> in BrK pellets.</p>
Full article ">Figure 6
<p>(<b>A</b>) Normalized fluorescence excitation and emission spectra of the same batch of <b>PAF</b> in several solvents (Abs. less 0.05 a.u.): chloroform (solid line), THF (dashed line) and DMF (dotted line). (<b>B</b>) Lippert plot or effect of solvent polarity on the Stokes´ shift of <b>PAF</b>.</p>
Full article ">
18 pages, 6940 KiB  
Article
Novel Amphiphilic, Biodegradable, Biocompatible, Thermo-Responsive ABA Triblock Copolymers Based on PCL and PEG Analogues via a Combination of ROP and RAFT: Synthesis, Characterization, and Sustained Drug Release from Self-Assembled Micelles
by Wenyan Ning, Pei Shang, Jie Wu, Xiaoyu Shi and Shouxin Liu
Polymers 2018, 10(2), 214; https://doi.org/10.3390/polym10020214 - 22 Feb 2018
Cited by 29 | Viewed by 8070
Abstract
Well-defined novel, linear, biodegradable, amphiphilic thermo-responsive ABA-type triblock copolymers, poly[2-(2-methoxyethoxy) ethyl methacrylate-co-oligo(ethylene glycol) methacrylate]-b-poly(ε-caprolactone)-b-poly[2-(2-methoxyethoxy) ethyl methacrylate-co-oligo(ethylene glycol) methacrylate] [P(MEO2MA-co-OEGMA)-b-PCL-b-P(MEO2MA-co-OEGMA)] (tBPs), were [...] Read more.
Well-defined novel, linear, biodegradable, amphiphilic thermo-responsive ABA-type triblock copolymers, poly[2-(2-methoxyethoxy) ethyl methacrylate-co-oligo(ethylene glycol) methacrylate]-b-poly(ε-caprolactone)-b-poly[2-(2-methoxyethoxy) ethyl methacrylate-co-oligo(ethylene glycol) methacrylate] [P(MEO2MA-co-OEGMA)-b-PCL-b-P(MEO2MA-co-OEGMA)] (tBPs), were synthesized via a combination of ring-opening polymerization (ROP) of ε-caprolactone (εCL) and reversible addition-fragmentation chain transfer polymerization (RAFT) of MEO2MA and OEGMA comonomers. The chemical structures and compositions of these copolymers were characterized using Fourier transform infrared spectroscopy (FT-IR) and proton nuclear magnetic resonance (1H NMR). The molecular weights of the copolymers were obtained using gel permeation chromatography (GPC) measurements. Thermo-responsive micelles were obtained by self-assembly of copolymers in aqueous medium. The temperature sensitivity and micelllization behavior of amphiphilic triblock copolymers solutions were studied by transmittance, fluorescence probe, surface tension, dynamic light scattering (DLS) and transmission electron microscopy (TEM). A hydrophobic drug, anethole, was encapsulated in micelles by using the dialysis method. The average particle sizes of drug-loaded micelles were determined by dynamic light scattering measurement. In vitro, the sustained release of the anethole was performed in pH 7.4 phosphate-buffered saline (PBS) at different temperatures. Results showed that the triblock copolymer’s micelles were quite effective in the encapsulation and controlled release of anethole. The vial inversion test demonstrated that the triblock copolymers could trigger the sol-gel transition which also depended on the temperature, and its sol-gel transition temperature gradually decreased with increasing concentration. The hydrogel system could also be used as a carrier of hydrophobic drugs in medicine. Full article
(This article belongs to the Special Issue Stimuli Responsive Polymers)
Show Figures

Graphical abstract

Graphical abstract
Full article ">Figure 1
<p>Photographs of the triblock copolymers aqueous solutions (2 mg·mL<sup>−1</sup>) at 25 °C (<b>a</b>), 35 °C (<b>b</b>), and 45 °C (<b>c</b>).</p>
Full article ">Figure 2
<p>Curves of the triblock copolymers aqueous solutions transmittance versus temperatures with (<b>a</b>) different degrees of polymerization, (<b>b</b>) the different content of OEGMA, (<b>c</b>) different concentrations of tBP3 aqueous solutions, and (<b>d</b>) LCST versus the tBP3 concentration.</p>
Full article ">Figure 3
<p>The CMC of the triblock copolymer tBP2 and tBP3 as determined by the emission spectra (<b>a</b>) or automatic surface tension meter (<b>b</b>).</p>
Full article ">Figure 4
<p>Size distributions of tBPs aqueous solutions (2 mg·mL<sup>−1</sup>) (<b>a</b>) and the evolution of the diameters of the nanoparticles of the tBP3 versus temperature (2 mg·mL<sup>−1</sup>) (<b>b</b>).</p>
Full article ">Figure 5
<p>TEM images and size distribution profiles of tBP3 micelles in distilled water, determined by DLS measurement at 25 °C (<b>a</b>) and 35 °C (<b>b</b>) (2 mg·mL<sup>−1</sup>).</p>
Full article ">Figure 6
<p>Photographs of P(MEO<sub>2</sub>MA-<span class="html-italic">co</span>-OEGMA)-<span class="html-italic">b</span>-PCL-<span class="html-italic">b</span>-P(MEO<sub>2</sub>MA-<span class="html-italic">co</span>-OEGMA) aqueous solutions at different temperature: (<b>left</b>) tBP1, tBP2, and tBP3 aqueous solutions (25 wt %) at different temperatures; and (<b>right</b>) various concentrations of tBP3 aqueous solutions at different temperatures.</p>
Full article ">Figure 7
<p>Photographs of anethole solution: (<b>A</b>) 0.1% anethole in PBS; (<b>B</b>) A<sub>1</sub>-tBP3 (DL = 5.1%); and (<b>C</b>) A<sub>2</sub>-tBP3 (DL = 7.9%).</p>
Full article ">Figure 8
<p>Intensity size distribution: (<b>A</b>) tBP3 (DL = 0); (<b>B</b>) A<sub>1</sub>-tBP3 (DL = 5.1%) and (<b>C</b>) A<sub>2</sub>-tBP3 (DL = 7.9%).</p>
Full article ">Figure 9
<p>The drug release profiles (<b>A</b>) of anethole-loaded micelles: (a) pure anethole; (b) A<sub>1</sub>-tBP3 (DL = 5.1%) at 37 °C; (c) A<sub>1</sub>-tBP3 (DL = 5.1%) at 25 °C; (d) A<sub>2</sub>-tBP3 (DL = 7.9%) at 37 °C; (e) A<sub>2</sub>-tBP3 (DL = 7.9%) at 25 °C; and (<b>B</b>) of anethole-loaded micelles of A-tBP1 (DL = 5.7%), A-tBP2 (DL = 5.3%), and A-tBP3 (DL = 5.1%) at 37 °C.</p>
Full article ">Scheme 1
<p>Synthesis of triblock copolymer P(MEO<sub>2</sub>MA-<span class="html-italic">co</span>-OEGMA)-<span class="html-italic">b</span>-PCL-<span class="html-italic">b</span>-P(MEO<sub>2</sub>MA-<span class="html-italic">co</span>-OEGMA).</p>
Full article ">Scheme 2
<p>Schematic representation of the self-assembled thermo-sensitive core–shell micelles for temperature-stimulated drug release and gelation of tPBs.</p>
Full article ">
25 pages, 995 KiB  
Review
Cosmetics and Cosmeceutical Applications of Chitin, Chitosan and Their Derivatives
by Inmaculada Aranaz, Niuris Acosta, Concepción Civera, Begoña Elorza, Javier Mingo, Carolina Castro, María De los Llanos Gandía and Angeles Heras Caballero
Polymers 2018, 10(2), 213; https://doi.org/10.3390/polym10020213 - 22 Feb 2018
Cited by 287 | Viewed by 20370
Abstract
Marine resources are well recognized for their biologically active substances with great potential applications in the cosmeceutical industry. Among the different compounds with a marine origin, chitin and its deacetylated derivative—chitosan—are of great interest to the cosmeceutical industry due to their unique biological [...] Read more.
Marine resources are well recognized for their biologically active substances with great potential applications in the cosmeceutical industry. Among the different compounds with a marine origin, chitin and its deacetylated derivative—chitosan—are of great interest to the cosmeceutical industry due to their unique biological and technological properties. In this review, we explore the different functional roles of chitosan as a skin care and hair care ingredient, as an oral hygiene agent and as a carrier for active compounds, among others. The importance of the physico-chemical properties of the polymer in its use in cosmetics are particularly highlighted. Moreover, we analyse the market perspectives of this polymer and the presence in the market of chitosan-based products. Full article
(This article belongs to the Special Issue Advances in Chitin/Chitosan Characterization and Applications)
Show Figures

Graphical abstract

Graphical abstract
Full article ">Figure 1
<p>Target organs for cosmetic and cosmeceutical products. (<b>A</b>) Gums and tooth, (<b>B</b>) hair and (<b>C</b>) skin. Adapted from Wikipedia Commons (authors: KDS4444, Human tooth diagram-en.svg CC-BY-SA 4.0, Madhero88, Skinlayers.svg CC-BY-SA 3.0).</p>
Full article ">Figure 2
<p>Major worldwide skin problems.</p>
Full article ">Figure 3
<p>Use of chitosan and derivatives in preventive oral healthcare.</p>
Full article ">Figure 4
<p>Main functions of chitosan derivatives in skin care.</p>
Full article ">
14 pages, 3305 KiB  
Article
Special Resins for Stereolithography: In Situ Generation of Silver Nanoparticles
by Gabriele Taormina, Corrado Sciancalepore, Federica Bondioli and Massimo Messori
Polymers 2018, 10(2), 212; https://doi.org/10.3390/polym10020212 - 22 Feb 2018
Cited by 49 | Viewed by 7745
Abstract
The limited availability of materials with special properties represents one of the main limitations to a wider application of polymer-based additive manufacturing technologies. Filled resins are usually not suitable for vat photo-polymerization techniques such as stereolithography (SLA) or digital light processing (DLP) due [...] Read more.
The limited availability of materials with special properties represents one of the main limitations to a wider application of polymer-based additive manufacturing technologies. Filled resins are usually not suitable for vat photo-polymerization techniques such as stereolithography (SLA) or digital light processing (DLP) due to a strong increment of viscosity derived from the presence of rigid particles within the reactive suspension. In the present paper, the possibility to in situ generate silver nanoparticles (AgNPs) starting from a homogeneous liquid system containing a well dispersed silver salt, which is subsequently reduced to metallic silver during stereolithographic process, is reported. The simultaneous photo-induced cross-linking of the acrylic resin produces a filled thermoset resin with thermal-mechanical properties significantly enhanced with respect to the unfilled resin, even at very low AgNPs concentrations. With this approach, the use of silver salts having carbon-carbon double bonds, such as silver acrylate and silver methacrylate, allows the formation of a nanocomposite structure in which the release of by-products is minimized due to the active role of all the reactive components in the three dimensional (3D)-printing processes. The synergy, between this nano-technology and the geometrical freedom offered by SLA, could open up a wide spectrum of potential applications for such a material, for example in the field of food packaging and medical and healthcare sectors, considering the well-known antimicrobial effects of silver nanoparticles. Full article
(This article belongs to the Special Issue Thermosets)
Show Figures

Graphical abstract

Graphical abstract
Full article ">Figure 1
<p>3D printed specimens: (<b>a</b>) unfilled; (<b>b</b>) 0.5% AgAcr; (<b>c</b>) 1% AgAcr; (<b>d</b>) 2% AgAcr; and (<b>e</b>) 1% AgMAcr.</p>
Full article ">Figure 2
<p>X-ray diffraction (XRD) diffraction pattern of 3D printed materials containing different amount of AgNPs from AgAcr and AgMAcr as precursors.</p>
Full article ">Figure 3
<p>Transmission electron microscopy (TEM) micrographs at two different magnifications of “Unfilled” (<b>a</b>,<b>e</b>); “AgAcr 1%” (<b>b</b>,<b>f</b>); “AgAcr 2%” (<b>c</b>,<b>g</b>); and “AgMAcr 1%” (<b>d</b>,<b>h</b>); as representative.</p>
Full article ">Figure 4
<p>Differential scanning calorimetry (DSC) thermograms (hexo up) of “Unfilled”, “AgAcr <span class="html-italic">x</span>%” and “AgAcr 1%” (TT: after thermal treatment; NT: no thermal treatment; I: first heating scan, II: second heating scan).</p>
Full article ">Figure 5
<p>Representative stress-strain diagram for Ag-filled and unfilled samples.</p>
Full article ">Figure 6
<p>Relative storage modulus as a function of AgNPs volume fraction. A comparison between predicted and experimental values for the AgAcr filled series.</p>
Full article ">Figure 7
<p>Master curves of compliance as a function of time at the reference temperature of 10 °C for “Unfilled”, “AgAcr <span class="html-italic">x</span>%”, and “AgMAcr 1%” samples.</p>
Full article ">Scheme 1
<p>Schematic representation of materials preparation, three dimensional (3D) printing and post-curing steps (<b>a</b>) and expected reactions during the 3D printing process (<b>b</b>).</p>
Full article ">
14 pages, 3381 KiB  
Article
α-Cyclodextrin and α-Cyclodextrin Polymers as Oxygen Nanocarriers to Limit Hypoxia/Reoxygenation Injury: Implications from an In Vitro Model
by Saveria Femminò, Claudia Penna, Federica Bessone, Fabrizio Caldera, Nilesh Dhakar, Daniele Cau, Pasquale Pagliaro, Roberta Cavalli and Francesco Trotta
Polymers 2018, 10(2), 211; https://doi.org/10.3390/polym10020211 - 22 Feb 2018
Cited by 35 | Viewed by 5005
Abstract
The incidence of heart failure (HF) is increasing worldwide and myocardial infarction (MI), which follows ischemia and reperfusion (I/R), is often at the basis of HF development. Nanocarriers are interesting particles for their potential application in cardiovascular disease. Impaired drug delivery in ischemic [...] Read more.
The incidence of heart failure (HF) is increasing worldwide and myocardial infarction (MI), which follows ischemia and reperfusion (I/R), is often at the basis of HF development. Nanocarriers are interesting particles for their potential application in cardiovascular disease. Impaired drug delivery in ischemic disease is challenging. Cyclodextrin nanosponges (NS) can be considered innovative tools for improving oxygen delivery in a controlled manner. This study has developed new α-cyclodextrin-based formulations as oxygen nanocarriers such as native α-cyclodextrin (α-CD), branched α-cyclodextrin polymer (α-CD POLY), and α-cyclodextrin nanosponges (α-CD NS). The three different α-CD-based formulations were tested at 0.2, 2, and 20 µg/mL to ascertain their capability to reduce cell mortality during hypoxia and reoxygenation (H/R) in vitro protocols. H9c2, a cardiomyoblast cell line, was exposed to normoxia (20% oxygen) or hypoxia (5% CO2 and 95% N2). The different formulations, applied before hypoxia, induced a significant reduction in cell mortality (in a range of 15% to 30%) when compared to samples devoid of oxygen. Moreover, their application at the beginning of reoxygenation induced a considerable reduction in cell death (12% to 20%). α-CD NS showed a marked efficacy in controlled oxygenation, which suggests an interesting potential for future medical application of polymer systems for MI treatment. Full article
(This article belongs to the Collection Polysaccharides)
Show Figures

Graphical abstract

Graphical abstract
Full article ">Figure 1
<p>Experimental protocols and 3-(4,5-dimethylthiazol-2-yl)-2,5-diphenyltetrazolium bromide (MTT) test. IB: ischemic buffer. (<b>A</b>–<b>D</b>) are different experimental conditions.</p>
Full article ">Figure 2
<p>Scanning electron microscopy (SEM) images of (<b>a</b>) α-cyclodextrin (<b>b</b>) α-cyclodextrin polymer, and (<b>c</b>) α-cyclodextrin nanosponges (Magnification 1000×).</p>
Full article ">Figure 3
<p>α-CD-based formulations presented negligible hemolytic activity. Results were expressed as percentage of total hemolysis (positive control), which was obtained when red blood cells were incubated with ammonium sulphate (20% <span class="html-italic">w</span>/<span class="html-italic">v</span>). Each bar represents the mean ± Standard Deviation (SD) of the three experiments.</p>
Full article ">Figure 4
<p>In vitro oxygen release from α-CD-based formulations over time measured by an oximeter. Each point represents the mean ± SD of the three experiments.</p>
Full article ">Figure 5
<p>Zeta potential values of α-CD-based formulations in NaCl 0.9% (negative control) cell culture medium in an ischemic buffer over time. Each point represents the mean ± SD of three experiments.</p>
Full article ">Figure 6
<p>Dose–response in normoxic conditions. (<b>A</b>) Treatment with O-α-CD POLY (0.2, 2, 20 µg/mL) and N-α-CD POLY (0.2, 2, 20 µg/mL); (<b>B</b>) Treatment with O-α-CD NS (0.2, 2, 20 µg/mL) and N-α-CD NS (0.2, 2, 20 µg/mL); (<b>C</b>) Treatment with O-α-CD (0.2, 2, 20 µg/mL) and N-α-CD (0.2, 2, 20 µg/mL), compared to the untreated control group (CTRL). Data were normalized to the mean value in control conditions and expressed as a percentage.</p>
Full article ">Figure 7
<p>Cell vitality of α-CD POLY treated H9c2 cells and H/R conditions. (<b>A</b>) Pre-treatment with O-α-CD POLY (0.2, 2, and 20 µg/mL); (<b>B</b>) Post-treatment with O-α-CD POLY (0.2, 2, and 20 µg/mL); (<b>C</b>) Pre-treatment with N-α-CD POLY (0.2, 2, and 20 µg/mL); (<b>D</b>) Post-treatment with O-α-CD POLY (0.2, 2, and 20 µg/mL) compared to the untreated control group (CTRL) and the hypoxia–reoxygenation group (CTRL H/R). Data were normalized to mean value in control conditions and expressed as a percentage.</p>
Full article ">Figure 8
<p>Cell vitality of α-CD NS treated H9c2 cells and H/R conditions. (<b>A</b>) Pre-treatment with O-α-CD NS (0.2, 2, and 20 µg/mL); (<b>B</b>) Post-treatment with O-α-CD NS (0.2, 2, and 20 µg/mL); (<b>C</b>) Pre-treatment with N-α-CD NS (0.2, 2, and 20 µg/mL); (<b>D</b>) Post-treatment with O-α-CD NS (0.2, 2, and 20 µg/mL) compared to the untreated control group (CTRL) and the hypoxia–reoxygenation group (CTRL H/R). Data are normalized to the mean value in control conditions and expressed as a percentage.</p>
Full article ">Figure 9
<p>Cell vitality of α-CD treated H9c2 cells and H/R conditions. (<b>A</b>) Pre-treatment with O-α-CD (0.2, 2, and 20 µg/mL); (<b>B</b>) Post-treatment with O-α-CD (0.2, 2, and 20 µg/mL); (<b>C</b>) Pre-treatment with N-α-CD (0.2, 2, and 20 µg/mL); (<b>D</b>) Post-treatment with O-α-CD (0.2, 2, and 20 µg/mL), compared to the untreated control group (CTRL) and the hypoxia–reoxygenation group (CTRL H/R). Data were normalized to the mean value in control conditions and expressed as a percentage.</p>
Full article ">
17 pages, 4604 KiB  
Article
Application of Superabsorbent Spacer Fabrics as Exuding Wound Dressing
by Yadie Yang and Hong Hu
Polymers 2018, 10(2), 210; https://doi.org/10.3390/polym10020210 - 22 Feb 2018
Cited by 29 | Viewed by 7821
Abstract
Exuding wound care requires a dressing to quickly absorb exudates and properly manage moisture during the healing process. In this study, the superabsorbent spacer fabrics were designed and fabricated for application in exuding wound dressings. The fabric structure consists of three layers, including [...] Read more.
Exuding wound care requires a dressing to quickly absorb exudates and properly manage moisture during the healing process. In this study, the superabsorbent spacer fabrics were designed and fabricated for application in exuding wound dressings. The fabric structure consists of three layers, including two outer hydrophobic layers made of polyester/spandex yarns and one superabsorbent middle layer made of superabsorbent yarns. In order to confirm the performance of these superabsorbent spacer fabrics, their dressing properties were tested and compared with two commercial foam dressings. The results showed that all the superabsorbent spacer fabrics had much faster wetting speeds (less than 2 s) than the foam dressings (6.04 s for Foam A and 63.69 s for Foam B). The absorbency of the superabsorbent spacer fabrics was at least twice higher than that of the foam dressings. The air permeability of the superabsorbent spacer fabrics (higher than 15 mL/s/cm2 at 100 Pa) was much higher than that of the foam dressings which had a too low permeability to be measured by the testing device. In addition, the water vapor permeability, thermal insulation, and conformability of superabsorbent spacer fabrics were comparable to foam dressings. The study indicates that the superabsorbent spacer fabrics are suitable for exuding wound dressing applications. Full article
(This article belongs to the Special Issue Textile and Textile-Based Materials)
Show Figures

Graphical abstract

Graphical abstract
Full article ">Figure 1
<p>Spacer fabric structure with four-needle connecting distance.</p>
Full article ">Figure 2
<p>FT-IR spectra of SAF yarn and SAFT yarn.</p>
Full article ">Figure 3
<p>Photograph of a typical fabricated spacer fabric.</p>
Full article ">Figure 4
<p>Photographs of the foam dressings from market.</p>
Full article ">Figure 5
<p>Wetting time of the spacer fabrics and foam dressings from the market. The photos of the surfaces of superabsorbent spacer fabrics are shown to visualize their difference. * <span class="html-italic">p</span> &lt; 0.05.</p>
Full article ">Figure 6
<p>Absorbency of the spacer fabrics and foam dressings from the market. * <span class="html-italic">p</span> &lt; 0.05.</p>
Full article ">Figure 7
<p>Shape changes of the foam dressings and spacer fabric after absorbing water: (<b>a</b>) the outer surface of Foam A; (<b>b</b>) the wound contact layer of Foam A; (<b>c</b>) the outer surface of Foam B; (<b>d</b>) the wound contact layer of Foam B, and (<b>e</b>) the superabsorbent spacer fabric.</p>
Full article ">Figure 8
<p>Air permeability of the spacer fabrics and foam dressings from the market. * <span class="html-italic">p</span> &lt; 0.05.</p>
Full article ">Figure 9
<p>Light microscope pictures of cross-section of (<b>a</b>) superabsorbent spacer fabric, and (<b>b</b>) foam dressing.</p>
Full article ">Figure 10
<p>WVTRs of the spacer fabrics and foam dressings from the market. * <span class="html-italic">p</span> &lt; 0.05.</p>
Full article ">Figure 11
<p>Rate of heat keeping of spacer fabrics and foam dressings from the market. * <span class="html-italic">p</span> &lt; 0.05 .</p>
Full article ">Figure 12
<p>Extensibility of the spacer fabrics and foam dressings from the market. * <span class="html-italic">p</span> &lt; 0.05. .</p>
Full article ">Figure 13
<p>Permanent set of spacer fabrics and foam dressings from the market. * <span class="html-italic">p</span> &lt; 0.05. .</p>
Full article ">
14 pages, 3598 KiB  
Article
A 3D Stable Metal–Organic Framework for Highly Efficient Adsorption and Removal of Drug Contaminants from Water
by Zhidong Luo, Shuran Fan, Jianqiang Liu, Weicong Liu, Xin Shen, Chuangpeng Wu, Yijia Huang, Gaoxiang Huang, Hui Huang and Mingbin Zheng
Polymers 2018, 10(2), 209; https://doi.org/10.3390/polym10020209 - 22 Feb 2018
Cited by 55 | Viewed by 5588
Abstract
We herein selected a 3D metal–organic framework decorated with carboxylate groups as an adsorbent to remove the pharmaceutical molecules of diclofenac sodium and chlorpromazine hydrochloride from water. The experiment aimed at exploring the effect factors of initial concentration, equilibrium time, temperature, pH and [...] Read more.
We herein selected a 3D metal–organic framework decorated with carboxylate groups as an adsorbent to remove the pharmaceutical molecules of diclofenac sodium and chlorpromazine hydrochloride from water. The experiment aimed at exploring the effect factors of initial concentration, equilibrium time, temperature, pH and adsorbent dosage on the adsorption process. The adsorption uptake rate of the diclofenac sodium is much higher than that of the chlorpromazine hydrochloride. This paper presents the high adsorption capacity of diclofenac sodium, in which porous MOFs are used for the removal of drug contaminants from water. According to linear fitting with adsorption isotherm equation and kinetic equations, diclofenac sodium conforms to the Langmuir model and pseudo-first-order kinetic equation, while chlorpromazine hydrochloride accords with the Temkin model and pseudo-second-order kinetic equation. The results of the study indicate that the title compound could be a promising hybrid material for removing diclofenac sodium and chlorpromazine hydrochloride from wastewater. Full article
(This article belongs to the Special Issue Coordination Polymer)
Show Figures

Graphical abstract

Graphical abstract
Full article ">Figure 1
<p>(<b>a</b>) View of the paddlewheel SBU (the uncoordinated –COO<sup>−</sup> groups are marked as pink); and (<b>b</b>) view of the two cages which are tuned by the ligands (yellow ball represents large cage: 22 Å and green ball represents small cage: 10 Å).</p>
Full article ">Figure 2
<p>View of the adsorption capacity rate of chlorpromazine hydrochloride and diclofenac sodium.</p>
Full article ">Figure 3
<p>The effect of contact time on the adsorption of the chlorpromazine hydrochloride and diclofenac sodium.</p>
Full article ">Figure 4
<p>The effect of temperature on the adsorption of chlorpromazine hydrochloride and diclofenac sodium.</p>
Full article ">Figure 5
<p>The effect of pH on the adsorption of: diclofenac sodium (<b>a</b>); and chlorpromazine hydrochloride (<b>b</b>).</p>
Full article ">Figure 6
<p>The effect of adsorbent dosage on the adsorption of the two drugs.</p>
Full article ">Figure 7
<p>The desorption processes of incorporation of adsorbent and diclofenac sodium or chlorpromazine hydrochloride.</p>
Full article ">Figure 8
<p>Langmuir (<b>A</b>); Freundlich (<b>B</b>); Temkin (<b>C</b>) and Dubinin-Radushkevich (<b>D</b>) isotherm linear plots for the adsorption of diclofenac sodium and chlorpromazine hydrochloride.</p>
Full article ">Figure 9
<p>(<b>A</b>) The pseudo-first-order kinetic plot of chlorpromazine hydrochloride and diclofenac sodium; and (<b>B</b>) the pseudo-second-order kinetic plot of chlorpromazine hydrochloride and diclofenac sodium.</p>
Full article ">
20 pages, 5954 KiB  
Article
Electrospun Gelatin–Chondroitin Sulfate Scaffolds Loaded with Platelet Lysate Promote Immature Cardiomyocyte Proliferation
by Francesca Saporito, Giuseppina Sandri, Maria Cristina Bonferoni, Silvia Rossi, Lorenzo Malavasi, Claudia Del Fante, Barbara Vigani, Lauren Black and Franca Ferrari
Polymers 2018, 10(2), 208; https://doi.org/10.3390/polym10020208 - 21 Feb 2018
Cited by 25 | Viewed by 5198
Abstract
The aim of the present work was the development of heart patches based on gelatin (G) and chondroitin sulfate (CS) to be used as implants to improve heart recovery after corrective surgery for critical congenital heart defects (CHD). Patches were prepared by means [...] Read more.
The aim of the present work was the development of heart patches based on gelatin (G) and chondroitin sulfate (CS) to be used as implants to improve heart recovery after corrective surgery for critical congenital heart defects (CHD). Patches were prepared by means of electrospinning to obtain nanofibrous scaffolds and they were loaded with platelet lysate (PL) as a source of growth factors to further enhance the repair process. Scaffolds were characterized for morphology and mechanical properties and for the capability to support in vitro adhesion and proliferation of dermal fibroblasts in order to assess the system’s general biocompatibility. Adhesion and proliferation of endothelial cells and cardiac cells (cardiomyocytes and cardiac fibroblasts from rat fetuses) onto PL-loaded patches was evaluated. Patches presented good elasticity and high stiffness suitable for in vivo adaptation to heart contraction. CS improved adhesion and proliferation of dermal fibroblasts, as proof of their biocompatibility. Moreover, they enhanced the adhesion and proliferation of endothelial cells, a crucial mediator of cardiac repair. Cell adhesion and proliferation could be related to elastic properties, which could favor cell motility. The presence of platelet lysate and CS was crucial for the adhesion and proliferation of cardiac cells and, in particular, of cardiomyocytes: G/CS scaffold embedded with PL appeared to selectively promote proliferation in cardiomyocytes but not cardiac fibroblasts. In conclusion, G/CS scaffold seems to be a promising system to assist myocardial-repair processes in young patient, preserving cardiomyocyte viability and preventing cardiac fibroblast proliferation, likely reducing subsequent uncontrolled collagen deposition by fibroblasts following repair. Full article
Show Figures

Figure 1

Figure 1
<p>Scanning electron microscopy (SEM) microphotographs of nanofibrous scaffolds immediately after preparation (not crosslinked, NC), after cross-linking, and after 6 days hydration in water.</p>
Full article ">Figure 2
<p>Fourier–transform infrared (FT–IR) spectra for G (A) and G/CS (B) scaffolds before (black line) and after crosslinking (red line).</p>
Full article ">Figure 3
<p>Scaffold mechanical properties as tensile strength (TS) (N/cm<sup>2</sup>) and elongation % measured for dry and hydrated scaffolds (mean values ± SD; n = 20). (red lines: Max: maximum tensile strength during systole; Min: minimum tensile strength during diastole) (t-test: tensile strength: dry: G vs G/CS: p = 0.218; hydrated: G vs G/CS: p = 0.693; G: dry vs hydrated: p = 0.003; G/CS: dry vs hydrated: p = 0.105; elongation: dry: G vs G/CS: p = 0.0.36; hydrated: G vs G/CS: p = 0.179; G: dry vs hydrated: p &lt; 0.001; G/CS: dry vs hydrated: p &lt; 0.001).</p>
Full article ">Figure 4
<p>Normal human dermal fibroblasts (NHDFs) and human umbilical vein endothelial cells (HUVEC) viability (optical density, OD) evaluated for cells grown onto G and G/CS scaffolds and in standard conditions (GM—growth medium), for 7 days; cells grown directly on plastic well bottom was considered as standard growth (GM) (mean values ± SD; n = 8) (t-test: NHDF: GM vs G: p = 0.107; GM vs G/CS: p = 0.002; G vs G/CS: p = 0.035; HUVEC: GM vs G: p = 0.388; GM vs G/CS: p &lt; 0.001; G vs G/CS: p = 0.014; GM: NHDF vs HUVEC: p = 0.579; G: NHDF vs HUVEC: p = 0.200; G/CS: NHDF vs HUVEC: p = 0.028).</p>
Full article ">Figure 5
<p>Microphotographs of NHDFs and HUVEC grown on G and G/CS scaffolds for 7 days: confocal-laser scanning microscopy (CLSM) (nuclei in blue—Hoechst 33258; cytoskeleton in red, TRICT-phalloidin) and SEM analysis.</p>
Full article ">Figure 6
<p>viability (optical density, OD) of cardiac cells (cardiomyocytes and cardiac fibroblasts) evaluated for cells grown onto G and G/CS scaffolds and in standard conditions (GM), for 3 days without or in presence of platelet lysate (PL-G and PL-G/CS); cardiac cells grown directly onto tissue culture plastic in standard growth condition (GM–growth medium) or in the presence of PL (PL–growth medium supplemented with PL in the same amount as in presence of scaffolds) were considered as control conditions (GM and PL, respectively) (mean values ± SD; n = 8) (t-test: w/o PL: GM vs G: p &lt; 0.001; GM vs G/CS: p = 0.654; G vs G/CS: p = 0.027; with PL: GM vs PL: p = 0.002; GM vs G: p = 0.025; GM vs G/CS: p = 0.012; PL vs G: p = 0.152; PL vs G/CS: p = 0.561; G vs G/CS: p = 0.153; G: with PL vs w/o PL: p &lt; 0.001; G/CS with PL vs w/o PL: p = 0.009).</p>
Full article ">Figure 7
<p>CLSM microphotographs of cardiomyocytes grown onto G or G/CS scaffolds in the presence of platelet lysate (nuclei in blue-Hoechst 33258; muscle fiber in red − α actinin antibody; proliferation marker in green–KI67).</p>
Full article ">Figure 7 Cont.
<p>CLSM microphotographs of cardiomyocytes grown onto G or G/CS scaffolds in the presence of platelet lysate (nuclei in blue-Hoechst 33258; muscle fiber in red − α actinin antibody; proliferation marker in green–KI67).</p>
Full article ">Figure 8
<p>SEM microphotographs of G and G/CS scaffolds embedded with platelet lysate after 3 days of culture of cardiac cells.</p>
Full article ">
14 pages, 4634 KiB  
Article
Controlled Surface Modification of Polyamide 6.6 Fibres Using CaCl2/H2O/EtOH Solutions
by Barbara Rietzler, Thomas Bechtold and Tung Pham
Polymers 2018, 10(2), 207; https://doi.org/10.3390/polym10020207 - 21 Feb 2018
Cited by 24 | Viewed by 7051
Abstract
Polyamide 6.6 is one of the most widely used polymers in the textile industry due to its durability; however, it has rather limited modification potential. In this work, the controlled surface modification of polyamide 6.6 fibres using the solvent system CaCl2/H2O/EtOH was studied. [...] Read more.
Polyamide 6.6 is one of the most widely used polymers in the textile industry due to its durability; however, it has rather limited modification potential. In this work, the controlled surface modification of polyamide 6.6 fibres using the solvent system CaCl2/H2O/EtOH was studied. The effects of solvent composition (relative proportions of the three components) and treatment time on fibre properties were studied both in situ (with fibres in solvent) and ex situ (after the solvent was washed off). The fibres swell and/or dissolve in the solvent depending on its composition and the treatment time. We believe that the fibre–solvent interaction is through complex formation between the fibre carbonyl groups and the CaCl2. On washing, there is decomplexation and precipitation of the polymer. The treated fibres exhibit greater diameters and surface roughness, structural difference between an outer shell and an inner core is observable, and water retention is higher. The solvent system is more benign than current alternatives, and through suitable tailoring of the treatment conditions, e.g., composition and time, it may be used in the design of advanced materials for storage and release of active substances. Full article
(This article belongs to the Special Issue Textile and Textile-Based Materials)
Show Figures

Graphical abstract

Graphical abstract
Full article ">Figure 1
<p>Proposed complexation mechanism of polyamide 6.6 (PA 6.6) in CaCl<sub>2</sub>/EtOH/H<sub>2</sub>O solvent: (<b>a</b>) Complex formation; (<b>b</b>) Disruption of hydrogen bonds in PA 6.6 in the presence of CaCl<sub>2</sub> according to [<a href="#B24-polymers-10-00207" class="html-bibr">24</a>].</p>
Full article ">Figure 2
<p>Pictures of the PA 6.6 fibres treated with solvents of the corresponding area: (<b>a</b>) No effect of the solvent on the fibres; (<b>b</b>) Dissolution of the fibre surface leading to fibre thinning (DISS); (<b>c</b>) Formation of a swollen shell (SW).</p>
Full article ">Figure 3
<p>Ternary phase diagram of the CaCl<sub>2</sub>/H<sub>2</sub>O/EtOH system for PA 6.6 fibre treatment.</p>
Full article ">Figure 4
<p>Swelling of PA 6.6 fibre in swelling solvent (SW).</p>
Full article ">Figure 5
<p>Dissolution of PA 6.6 fibre in dissolving solvent (DISS).</p>
Full article ">Figure 6
<p>Fibre diameter changes (ΔD in %) depending on time in SW and DISS in in situ experiments.</p>
Full article ">Figure 7
<p>Fibre diameter as a function of H<sub>2</sub>O/EtOH ratios in CaCl<sub>2</sub>/H<sub>2</sub>O/EtOH mixtures after 10 min treatment.</p>
Full article ">Figure 8
<p>FTIR spectra of virgin PA 6.6 fibre and modified fibres using SW and DISS respectively after washing.</p>
Full article ">Figure 9
<p>Changes in fibre diameter over time after washing.</p>
Full article ">Figure 10
<p>Water retention value vs time of treatment using DISS and SW.</p>
Full article ">Figure 11
<p>Water retention value vs diameter change in percentage after 10 min treatment with SW.</p>
Full article ">Figure 12
<p>3D confocal laser-scanning microscope picture of untreated PA 6.6 fibre and roughness profile.</p>
Full article ">Figure 13
<p>3D confocal laser-scanning microscope picture of PA 6.6 fibre modified using SW and roughness profile.</p>
Full article ">
9 pages, 7320 KiB  
Article
Self-Sensitization and Photo-Polymerization of Diacetylene Molecules Self-Assembled on a Hexagonal-Boron Nitride Nanosheet
by Elisseos Verveniotis, Yuji Okawa, Kenji Watanabe, Takashi Taniguchi, Takaaki Taniguchi, Minoru Osada, Christian Joachim and Masakazu Aono
Polymers 2018, 10(2), 206; https://doi.org/10.3390/polym10020206 - 19 Feb 2018
Cited by 6 | Viewed by 6166
Abstract
Long poly-diacetylene chains are excellent candidates for planar, on-surface synthesized molecular electronic wires. Since hexagonal-Boron Nitride (h-BN) was identified as the best available atomically flat insulator for the deposition of poly-diacetylene precursors, we demonstrate the polymerization patterns and rate on it under UV-light [...] Read more.
Long poly-diacetylene chains are excellent candidates for planar, on-surface synthesized molecular electronic wires. Since hexagonal-Boron Nitride (h-BN) was identified as the best available atomically flat insulator for the deposition of poly-diacetylene precursors, we demonstrate the polymerization patterns and rate on it under UV-light irradiation, with subsequent polymer identification by atomic force microscopy. The results on h-BN indicate self-sensitization which yields blocks comprised of several polymers, unlike on the well-studied graphite/diacetylene system, where the polymers are always isolated. In addition, the photo-polymerization proceeds at least 170 times faster on h-BN, where it also results in longer polymers. Both effects are explained by the h-BN bandgap, which is larger than the diacetylene electronic excitation energy, thus allowing the transfer of excess energy absorbed by polymerized wires to adjacent monomers, triggering their polymerization. This work sets the stage for conductance measurements of single molecular poly-diacetylene wires on h-BN. Full article
(This article belongs to the Special Issue Polymerizations from Surfaces)
Show Figures

Graphical abstract

Graphical abstract
Full article ">Figure 1
<p>Atomic force microscopy (AFM) images showing diacetylene on highly oriented pyrolytic graphite (HOPG) after 20 min of ultraviolet (UV) irradiation: (<b>a</b>) topography; (<b>b</b>) phase shift.</p>
Full article ">Figure 2
<p>AFM topography (<b>a</b>); and phase shift (<b>b</b>) of diacetylene on hexagonal-Boron Nitride (h-BN) after 5 s of UV irradiation; and the same sample after additional 5 s of irradiation (10 s in total) (<b>c</b>) topography; (<b>d</b>) phase shift.</p>
Full article ">Figure 3
<p>Raman spectra measured on: (<b>a</b>) pristine HOPG and HOPG after diacetylene deposition and UV irradiation for 20 min; (<b>b</b>) pristine h-BN and h-BN after diacetylene deposition and UV irradiation for 10 s; and (<b>c</b>) the diacetylene powder after UV irradiation for 10 s.</p>
Full article ">Figure 4
<p>Schematic illustration of the self-sensitization of diacetylene on h-BN: (<b>a</b>) the diacetylene layer is exposed to UV-light and one of the molecules is excited; (<b>b</b>) a PDA chain is formed; (<b>c</b>) the PDA absorbs energy due to further irradiation; (<b>d</b>) energy is transferred to the neighboring monomer; and (<b>e</b>) this causes it to polymerize. R and R’ are (CH<sub>2</sub>)<sub>15</sub>CH<sub>3</sub> and (CH<sub>2</sub>)<sub>8</sub>COOH, respectively. (<b>f</b>) Detailed model of the area denoted by the rectangle in <b>(b)</b>. Orange dotted lines show the monomer arrangement defect near the polymer edge. <span class="html-italic">W</span><sub>p</sub> and <span class="html-italic">W</span><sub>m</sub> indicate the width of polymer and monomer, respectively.</p>
Full article ">Figure 5
<p>Number of polymers in a 500 × 500 nm<sup>2</sup> area as a function of irradiation time for the photo-polymerization of 10,12-nonacosadiynoic acid on HOPG and h-BN. The lines are guides for the eye.</p>
Full article ">
14 pages, 2675 KiB  
Article
Preparation of Water-soluble Polyion Complex (PIC) Micelles Covered with Amphoteric Random Copolymer Shells with Pendant Sulfonate and Quaternary Amino Groups
by Rina Nakahata and Shin-ichi Yusa
Polymers 2018, 10(2), 205; https://doi.org/10.3390/polym10020205 - 19 Feb 2018
Cited by 14 | Viewed by 6508
Abstract
An amphoteric random copolymer (P(SA)91) composed of anionic sodium 2-acrylamido-2-methylpropanesulfonate (AMPS, S) and cationic 3-acrylamidopropyl trimethylammonium chloride (APTAC, A) was prepared via reversible addition-fragmentation chain transfer (RAFT) radical polymerization. The subscripts in the abbreviations indicate the degree of polymerization (DP). Furthermore, [...] Read more.
An amphoteric random copolymer (P(SA)91) composed of anionic sodium 2-acrylamido-2-methylpropanesulfonate (AMPS, S) and cationic 3-acrylamidopropyl trimethylammonium chloride (APTAC, A) was prepared via reversible addition-fragmentation chain transfer (RAFT) radical polymerization. The subscripts in the abbreviations indicate the degree of polymerization (DP). Furthermore, AMPS and APTAC were polymerized using a P(SA)91 macro-chain transfer agent to prepare an anionic diblock copolymer (P(SA)91S67) and a cationic diblock copolymer (P(SA)91A88), respectively. The DP was estimated from quantitative 13C NMR measurements. A stoichiometrically charge neutralized mixture of the aqueous P(SA)91S67 and P(SA)91A88 formed water-soluble polyion complex (PIC) micelles comprising PIC cores and amphoteric random copolymer shells. The PIC micelles were in a dynamic equilibrium state between PIC micelles and charge neutralized small aggregates composed of a P(SA)91S67/P(SA)91A88 pair. Interactions between PIC micelles and fetal bovine serum (FBS) in phosphate buffered saline (PBS) were evaluated by changing the hydrodynamic radius (Rh) and light scattering intensity (LSI). Increases in Rh and LSI were not observed for the mixture of PIC micelles and FBS in PBS for one day. This observation suggests that there is no interaction between PIC micelles and proteins, because the PIC micelle surfaces were covered with amphoteric random copolymer shells. However, with increasing time, the diblock copolymer chains that were dissociated from PIC micelles interacted with proteins. Full article
(This article belongs to the Special Issue Polymer Micelles)
Show Figures

Graphical abstract

Graphical abstract
Full article ">Figure 1
<p>(<b>a</b>) Chemical structures of P(SA)<sub>91</sub>S<sub>67</sub> and P(SA)<sub>91</sub>A<sub>88</sub>. (<b>b</b>) Schematic representation of water-soluble polyion complex (PIC) micelle formed from a mixture of P(SA)<sub>91</sub>S<sub>67</sub> and P(SA)<sub>91</sub>A<sub>88</sub>; the PIC micelle shows protein antifouling properties because of its amphoteric random copolymer shell.</p>
Full article ">Figure 2
<p>Inverse gated decoupling <sup>13</sup>C NMR spectra of (<b>a</b>) P(SA)<sub>91</sub>, (<b>b</b>) P(SA)<sub>91</sub>S<sub>67</sub>, and (<b>c</b>) P(SA)<sub>91</sub>A<sub>88</sub> in D<sub>2</sub>O.</p>
Full article ">Figure 3
<p>Hydrodynamic radius (<span class="html-italic">R</span><sub>h</sub>) distributions with polydispersity indices (PDI) for (<b>a</b>) P(SA)<sub>91</sub>S<sub>67</sub>; (<b>b</b>) P(SA)<sub>91</sub>A<sub>88</sub>; and (<b>c</b>) PIC micelles in 0.1 M aqueous NaCl.</p>
Full article ">Figure 4
<p>(<b>a</b>) Hydrodynamic radius (<span class="html-italic">R</span><sub>h</sub>, ○) and light scattering intensity (LSI, △) of PIC micelles as a function of <span class="html-italic">f</span><sup>+</sup> (= [APTAC]/([APTAC] + [AMPS])) in 0.1 M aqueous NaCl; (<b>b</b>) Zeta potential of PIC micelles as a function of <span class="html-italic">f</span><sup>+</sup> in 0.1 M aqueous NaCl.</p>
Full article ">Figure 5
<p>TEM image of PIC micelles with <span class="html-italic">f</span><sup>+</sup> = 0.5 at <span class="html-italic">C</span><sub>p</sub> = 1.0 g/L in 0.1 M aqueous NaCl.</p>
Full article ">Figure 6
<p>Light scattering intensity ratio (<span class="html-italic">I</span>/<span class="html-italic">I</span><sub>0</sub>) for the aqueous PIC micelles containing 0.1 M NaCl as a function of polymer concentration (<span class="html-italic">C</span><sub>p</sub>). <span class="html-italic">I</span> and <span class="html-italic">I</span><sub>0</sub> are the light scattering intensities of the solution and solvent, respectively.</p>
Full article ">Figure 7
<p>Hydrodynamic radius (<span class="html-italic">R</span><sub>h</sub>, ○) and light scattering intensity (LSI, △) of PIC micelles with <span class="html-italic">f</span><sup>+</sup> = 0.5 at <span class="html-italic">C</span><sub>p</sub> = 1.0 g/L as a function of NaCl concentration ([NaCl]).</p>
Full article ">Figure 8
<p><span class="html-italic">R</span><sub>h</sub> distributions of (<b>a</b>) PIC micelles; (<b>b</b>) BSA; and (<b>c</b>) a mixture of PIC micelles with BSA in PBS at 25 °C.</p>
Full article ">Figure 9
<p>(a) <span class="html-italic">R</span><sub>h</sub> distributions for (<b>a</b>) PIC micelles, (<b>b</b>) FBS, and (<b>c</b>) a mixture of PIC micelles with FBS in PBS buffer at 25 °C.</p>
Full article ">
21 pages, 3040 KiB  
Article
Neodymium Recovery by Chitosan/Iron(III) Hydroxide [ChiFer(III)] Sorbent Material: Batch and Column Systems
by Hary Demey, Byron Lapo, Montserrat Ruiz, Agustin Fortuny, Muriel Marchand and Ana M. Sastre
Polymers 2018, 10(2), 204; https://doi.org/10.3390/polym10020204 - 19 Feb 2018
Cited by 33 | Viewed by 6160
Abstract
A low cost composite material was synthesized for neodymium recovery from dilute aqueous solutions. The in-situ production of the composite containing chitosan and iron(III) hydroxide (ChiFer(III)) was improved and the results were compared with raw chitosan particles. The sorbent was characterized using Fourier [...] Read more.
A low cost composite material was synthesized for neodymium recovery from dilute aqueous solutions. The in-situ production of the composite containing chitosan and iron(III) hydroxide (ChiFer(III)) was improved and the results were compared with raw chitosan particles. The sorbent was characterized using Fourier transform infrared spectroscopy (FTIR) and scanning electron microscopy-energy dispersive X-ray analyses (SEM-EDX). The equilibrium studies were performed using firstly a batch system, and secondly a continuous system. The sorption isotherms were fitted with the Langmuir, Freundlich, and Sips models; experimental data was better described with the Langmuir equation and the maximum sorption capacity was 13.8 mg g-1 at pH 4. The introduction of iron into the biopolymer matrix increases by four times the sorption uptake of the chitosan; the individual sorption capacity of iron (into the composite) was calculated as 30.9 mg Nd/g Fe. The experimental results of the columns were fitted adequately using the Thomas model. As an approach to Nd-Fe-B permanent magnets effluents, a synthetic dilute effluent was simulated at pH 4, in order to evaluate the selectivity of the sorbent material; the overshooting of boron in the column system confirmed the higher selectivity toward neodymium ions. The elution step was carried out using MilliQ-water with the pH set to 3.5 (dilute HCl solution). Full article
(This article belongs to the Special Issue Advances in Chitin/Chitosan Characterization and Applications)
Show Figures

Graphical abstract

Graphical abstract
Full article ">Figure 1
<p>Scanning electron microscopy (SEM) images of the freeze dried (FD) sorbent. (<b>a</b>) External surface. (<b>b</b>) Cross-section area. (<b>c</b>,<b>d</b>) Energy dispersive X-ray (EDX) analysis of the cross-section area of the beads.</p>
Full article ">Figure 2
<p>Scanning electron microscopy (SEM) images of the air dried (AD) sorbent. (<b>a</b>) External surface. (<b>b</b>) Cross-section area. (<b>c</b>,<b>d</b>) Energy dispersive X-ray (EDX) analysis of the cross-section area of the beads.</p>
Full article ">Figure 3
<p>Distribution of the main components on the cross-section area of the ChiFer(III) material after sorption. (Right side: Original structure; left side: Distribution of O: Oxygen; C: Carbon; Fe: Iron; Nd: Neodymium).</p>
Full article ">Figure 4
<p>Influence of pH on neodymium removal. (<b>a</b>) Sorption efficiency. (<b>b</b>) Variation in pH using ChiFer(III) as sorbent. (<b>c</b>) Variation in pH using chitosan as sorbent. (T: 20 °C; sorbent dosage, SD: 1 g·L<sup>−1</sup>; agitation speed: 150 rpm; contact time: 72 h; C<sub>0</sub>: 9.4 mg·L<sup>−1</sup>).</p>
Full article ">Figure 5
<p>Isotherm plots for neodymium removal. (Solid line: Langmuir model; T: 20 °C; sorbent dosage, SD: 1 g·L<sup>−1</sup>; agitation speed: 150 rpm; contact time: 72 h; pH: 4; C<sub>0</sub>: 5–400 mg·L<sup>−1</sup>).</p>
Full article ">Figure 6
<p>Effect of contact time on ChiFer(III) material performance. (<b>a</b>) Effect of drying method. (<b>b</b>) Effect of initial metal concentration. (Dashed line: Pseudo-second order rate equation (PSORE); T: 20 °C; sorbent dosage, SD: 0.5 g·L<sup>−1</sup>; agitation speed: 150 rpm; contact time: 72 h; pH: 4; C<sub>0</sub>: 10–20 mg·L<sup>−1</sup>).</p>
Full article ">Figure 7
<p>Continuous sorption of neodymium using ChiFer(III) material as fixed-packed sorbent. (<b>Left side</b>: Breakthrough curves as a function of time; <b>right side</b>: Breakthrough curves as a function of bed-volume; solid line: Thomas model; T: 20 °C; internal diameter of the column, Ø: 1.8 cm; bed depth: 23 cm; flow rate: 0.01–0.02 L·h<sup>−1</sup>; pH: 4; C<sub>0</sub>: 10.2 mg·Nd(III)·L<sup>−1</sup>).</p>
Full article ">Figure 8
<p>Simultaneous sorption of neodymium and boron using ChiFer(III) material as fixed-packed sorbent. (<b>Left side</b>: Breakthrough curves as a function of Bed-volume (BV), dashed line: overshooting guide line; <b>right side</b>: Separation coefficient R<sub>Nd/B</sub> as a function of BV; dashed line: experimental trend; T: 20 °C; internal diameter of the column, Ø: 1.8 cm; bed depth: 23 cm; flow rate: 0.01 L·h<sup>−1</sup>; pH: 4; C<sub>0</sub>: 0.1 mmol·L<sup>−1</sup>).</p>
Full article ">Figure 9
<p>Simultaneous desorption of neodymium and boron from loaded ChiFer(III) material as fixed-packed sorbent. (<b>Left side</b>: Recovery metal concentration as a function of the volume (L), dashed line: desorption trend; <b>right side</b>: Elution efficiency as a function of the volume (L); dashed line: efficiency trend; T: 20 °C; internal diameter of the column, Ø: 1.8 cm; bed depth: 23 cm; flow rate: 0.01 L·h<sup>−1</sup>; Eluent: demineralized water at pH: 3.5).</p>
Full article ">
12 pages, 8565 KiB  
Article
Effect of Polyhedral Oligomeric Silsesquioxane on the Melting, Structure, and Mechanical Behavior of Polyoxymethylene
by Dorota Czarnecka-Komorowska and Tomasz Sterzynski
Polymers 2018, 10(2), 203; https://doi.org/10.3390/polym10020203 - 17 Feb 2018
Cited by 21 | Viewed by 4833
Abstract
The effects of octakis[(3-glycidoxypropyl)dimethylsiloxy]octasilsesquioxane (GPOSS) on the crystallinity, crystal structure, morphology, and mechanical properties of polyoxymethylene (POM) and POM/GPOSS composites were investigated. The POM/GPOSS composites with varying concentrations of GPOSS nanoparticles (0.05–0.25 wt %) were prepared via melt blending. The structure of POM/GPOSS [...] Read more.
The effects of octakis[(3-glycidoxypropyl)dimethylsiloxy]octasilsesquioxane (GPOSS) on the crystallinity, crystal structure, morphology, and mechanical properties of polyoxymethylene (POM) and POM/GPOSS composites were investigated. The POM/GPOSS composites with varying concentrations of GPOSS nanoparticles (0.05–0.25 wt %) were prepared via melt blending. The structure of POM/GPOSS composites was characterized by differential scanning calorimetry (DSC), wide angle X-ray diffraction (WAXD), and polarized light microscopy (PLM). The mechanical properties were determined by standardized tensile tests. The morphology and dispersion of GPOSS nanoparticles in the POM matrix were investigated with scanning electron microscopy (SEM) and energy dispersive X-ray (EDX) analysis. It was observed that the dispersion of the GPOSS nanoparticles was uniform. Based on DSC studies, it was found that the melting temperature, lamellar thickness, and the degree of crystallinity of the POM/GPOSS composites increased. The POM/GPOSS composites showed an increased Young’s modulus and tensile strength. Finally, compared with the pure POM, the addition of GPOSS reduced the spherulites’ size and improved the crystallinity of the POM, which demonstrates that the nucleation effect of GPOSS is favorable for the mechanical properties of POM. Full article
(This article belongs to the Special Issue Processing-Structure-Properties Relationships in Polymers)
Show Figures

Graphical abstract

Graphical abstract
Full article ">Figure 1
<p>Chemical structure of the octakis[(3-glycidoxypropyl)dimethylsiloxy]octasilsesquioxane (GPOSS).</p>
Full article ">Figure 2
<p>Differential scanning calorimetry (DSC) melting curves of pure POM (<b>a</b>) and its composites with different GPOSS concentrations at the first heating rate of 20 °C/min: (<b>b</b>) 0.05 wt %; (<b>c</b>) 0.1 wt %; (<b>d</b>) 0.25 wt %.</p>
Full article ">Figure 3
<p>The variation in the lamellar thickness of pure POM and its composites, calculated from DSC (first run) experiments as a function of GPOSS content.</p>
Full article ">Figure 4
<p>PLM micrographs of the crystallized pure POM (<b>a</b>) and its composites with different GPOSS concentrations: (<b>b</b>) 0.05 wt %; (<b>c</b>) 0.1 wt %; (<b>d</b>) 0.25 wt %. <span class="html-italic">T</span> = 148 °C. The cooling rate was set to 20 °C/min. (magnification 200×).</p>
Full article ">Figure 5
<p>The dependence of the size of spherulites in pure POM and its composites with different GPOSS concentrations. The cooling rate was set to 20 °C/min.</p>
Full article ">Figure 6
<p>WAXD curves of pure POM and its composites with different GPOSS concentrations at room temperature: (<b>a</b>) 0.05 wt %; (<b>b</b>) 0.1 wt %; (<b>c</b>) 0.25 wt %.</p>
Full article ">Figure 7
<p>Tensile stress-strain curves of pure POM (<b>a</b>) and its composite with different GPOSS concentrations: (<b>b</b>) 0.05 wt %; (<b>c</b>) 0.1 wt %; (<b>d</b>) 0.25 wt %.</p>
Full article ">Figure 8
<p>SEM images of the fractured surface (<b>a</b>–<b>c</b>) and Si mapping (<b>d</b>–<b>e</b>) of pure POM (<b>a</b>) and its composites with different GPOSS concentrations: (<b>b</b>) 0.05 wt %; (<b>c</b>) 0.25 wt %.</p>
Full article ">
21 pages, 7211 KiB  
Article
Impact of Nanoclays on the Biodegradation of Poly(Lactic Acid) Nanocomposites
by Edgar Castro-Aguirre, Rafael Auras, Susan Selke, Maria Rubino and Terence Marsh
Polymers 2018, 10(2), 202; https://doi.org/10.3390/polym10020202 - 17 Feb 2018
Cited by 75 | Viewed by 8171
Abstract
Poly(lactic acid) (PLA), a well-known biodegradable and compostable polymer, was used in this study as a model system to determine if the addition of nanoclays affects its biodegradation in simulated composting conditions and whether the nanoclays impact the microbial population in a compost [...] Read more.
Poly(lactic acid) (PLA), a well-known biodegradable and compostable polymer, was used in this study as a model system to determine if the addition of nanoclays affects its biodegradation in simulated composting conditions and whether the nanoclays impact the microbial population in a compost environment. Three different nanoclays were studied due to their different surface characteristics but similar chemistry: organo-modified montmorillonite (OMMT), Halloysite nanotubes (HNT), and Laponite® RD (LRD). Additionally, the organo-modifier of MMT, methyl, tallow, bis-2-hydroxyethyl, quaternary ammonium (QAC), was studied. PLA and PLA bio-nanocomposite (BNC) films were produced, characterized, and used for biodegradation evaluation with an in-house built direct measurement respirometer (DMR) following the analysis of evolved CO2 approach. A biofilm formation essay and scanning electron microscopy were used to evaluate microbial attachment on the surface of PLA and BNCs. The results obtained from four different biodegradation tests with PLA and its BNCs showed a significantly higher mineralization of the films containing nanoclay in comparison to the pristine PLA during the first three to four weeks of testing, mainly attributed to the reduction in the PLA lag time. The effect of the nanoclays on the initial molecular weight during processing played a crucial role in the evolution of CO2. PLA-LRD5 had the greatest microbial attachment on the surface as confirmed by the biofilm test and the SEM micrographs, while PLA-QAC0.4 had the lowest biofilm formation that may be attributed to the inhibitory effect also found during the biodegradation test when the QAC was tested by itself. Full article
(This article belongs to the Special Issue Polymers from Renewable Resources)
Show Figures

Graphical abstract

Graphical abstract
Full article ">Figure 1
<p>XRD spectra of the different nanoclays, PLA1, and (<b>a</b>) OMMT, (<b>b</b>) HNT, and (<b>c</b>) LRD bio-nanocomposite films.</p>
Full article ">Figure 2
<p>TEM micrographs of (<b>a</b>) PLA-OMMT5, (<b>b</b>) PLA-HNT5, and (<b>c</b>) PLA-LRD5 bio-nanocomposites at 10k×. The bar in the left bottom represents 1 μm.</p>
Full article ">Figure 3
<p>CO<sub>2</sub> evolution of the three different nanoclays (Test I in compost).</p>
Full article ">Figure 4
<p>(<b>a</b>) CO<sub>2</sub> evolution and (<b>b</b>) % Mineralization of PLA and PLA-OMMT5 films (Test I in compost).</p>
Full article ">Figure 5
<p>(<b>a</b>) CO<sub>2</sub> evolution and (<b>b</b>) % Mineralization of PLA and PLA-OMMT films with three different levels of loading (1, 5, and 7.5%) (Test II in compost).</p>
Full article ">Figure 6
<p>CO<sub>2</sub> evolution of OMMT nanoclay and QAC surfactant (Test II in compost).</p>
Full article ">Figure 7
<p>CO<sub>2</sub> evolution and % Mineralization of PLA-OMMT films (<b>a</b>,<b>b</b>) and PLA-QAC films (<b>c</b>,<b>d</b>) (Test III in compost).</p>
Full article ">Figure 8
<p>(<b>a</b>) CO<sub>2</sub> evolution and (<b>b</b>) % Mineralization of PLA-HNT films (Test III in compost).</p>
Full article ">Figure 9
<p>(<b>a</b>) CO<sub>2</sub> evolution and (<b>b</b>) % Mineralization of PLA-LRD films (Test III in compost).</p>
Full article ">Figure 10
<p>(<b>a</b>) CO<sub>2</sub> evolution and (<b>b</b>) % Mineralization of PLA and PLA-OMMT5 films (Test IV in compost).</p>
Full article ">Figure 11
<p>(<b>a</b>) CO<sub>2</sub> evolution and (<b>b</b>) % Mineralization of PLA, PLA-OMMT5, and PLA-QAC0.4 (Test IV in inoculated vermiculite (dashed lines) and uninoculated vermiculite (dotted lines)).</p>
Full article ">Figure 12
<p>Initial molecular weight of PLA and BNCs.</p>
Full article ">Figure 13
<p>Change in molecular weight of PLA2 film (Test III in compost).</p>
Full article ">Figure 14
<p>Change in molecular weight of (<b>a</b>) PLA2, (<b>b</b>) PLA-OMMT1, (<b>c</b>) PLA-OMMT5, (<b>d</b>) PLA-QAC0.4, (<b>e</b>) PLA-QAC1.5, (<b>f</b>) PLA-HNT1, (<b>g</b>) PLA-HNT5, (<b>h</b>) PLA-LRD1, and (<b>i</b>) PLA-LRD5 films (Test III in compost).</p>
Full article ">Figure 15
<p>Absorbance (600 nm) of (<b>a</b>) PA at 23 °C, and (<b>b</b>) CE at 58 °C for second biofilm test. Columns with the same letter within a group (i.e., wells, films, or total) are not significantly different at <span class="html-italic">p</span> ≤ 0.05 (Tukey test).</p>
Full article ">Figure 16
<p>SEM micrographs of (<b>a</b>) PLA and (<b>b</b>) PLA-LRD at 1000× before incubation, (<b>c</b>) PLA and (<b>d</b>) PLA-LRD5 after incubation for 48 h at 58 °C with compost extract in R2B.</p>
Full article ">
11 pages, 3119 KiB  
Article
Renewable, Eugenol—Modified Polystyrene Layer for Liquid Crystal Orientation
by Changha Ju, Taehyung Kim and Hyo Kang
Polymers 2018, 10(2), 201; https://doi.org/10.3390/polym10020201 - 17 Feb 2018
Cited by 11 | Viewed by 6870
Abstract
We synthesized a series of plant-based and renewable, eugenol-modified polystyrene (PEUG#) (# = 20, 40, 60, 80, and 100, in which # is the molar content of the eugenol moiety in the side group). Eugenol is extracted from clove oil. We used polymer [...] Read more.
We synthesized a series of plant-based and renewable, eugenol-modified polystyrene (PEUG#) (# = 20, 40, 60, 80, and 100, in which # is the molar content of the eugenol moiety in the side group). Eugenol is extracted from clove oil. We used polymer modification reactions to determine the liquid crystal (LC) orientation properties of the polymer films. In general, the LC cells fabricated using the polymer films with a higher molar content of eugenol side groups exhibited vertical LC orientation behavior. The vertical orientation behavior was well correlated with the surface energy value of the polymer films. The vertical LC orientation could be formed due to the low polar surface energy value on the polymer film generated by the nonpolar carbon group. Electro-optical performances (e.g., voltage holding ratio (VHR), residual DC voltage (R-DC), and thermal orientation stabilities) were good enough to be observed for LC cells using PEUG100 polymer as an eco-friendly LC orientation material. Full article
(This article belongs to the Special Issue Polymers from Renewable Resources)
Show Figures

Graphical abstract

Graphical abstract
Full article ">Figure 1
<p>Synthetic route to eugenol modified polystyrene (PEUG#), where # indicates the mole percent of eugenol containing monomeric units in the polymer.</p>
Full article ">Figure 2
<p>DSC (differential scanning calorimetry) thermogram of eugenol modified polystyrene (PEUG#).</p>
Full article ">Figure 3
<p>Optical transmittance spectra of eugenol modified polystyrene (PEUG#) and polyimide orientation layers onto quartz substrates.</p>
Full article ">Figure 4
<p>Photograph images of the LC cells made from PEUG# films according to the molar content of eugenol moiety.</p>
Full article ">Figure 5
<p>Polarized optical microscopy (POM) images of the LC cells made from PEUG#.</p>
Full article ">Figure 6
<p>(<b>a</b>) Water, (<b>b</b>) diiodomethane contact angle, and (<b>c</b>) surface energy values of PEUG# films according to the molar content of the eugenol moiety in the side groups.</p>
Full article ">Figure 7
<p>Conoscopic POM images of PEUG100 LC cells, after heat treatment at 100, 150, and 200 °C for 10 min, respectively.</p>
Full article ">
11 pages, 2172 KiB  
Article
Kinetics of Low Temperature Polyester Dyeing with High Molecular Weight Disperse Dyes by Solvent Microemulsion and AgroSourced Auxiliaries
by Shahram Radei, F. Javier Carrión-Fité, Mònica Ardanuy and José María Canal
Polymers 2018, 10(2), 200; https://doi.org/10.3390/polym10020200 - 16 Feb 2018
Cited by 27 | Viewed by 7195
Abstract
This work focused on the evaluation of the kinetics of dyeing polyester fabrics with high molecular weight disperse dyes, at low temperature by solvent microemulsion. This study also compared the effect of two non-toxic agro-sourced auxiliaries (o-vanillin and coumarin) using a [...] Read more.
This work focused on the evaluation of the kinetics of dyeing polyester fabrics with high molecular weight disperse dyes, at low temperature by solvent microemulsion. This study also compared the effect of two non-toxic agro-sourced auxiliaries (o-vanillin and coumarin) using a non-toxic organic solvent. A dyeing bath consisting of a micro-emulsion system involving a small proportion of n-butyl acetate was used, and the kinetics of dyeing were analysed at four temperatures (83, 90, 95 and 100 °C). Moreover, the dyeing rate constants, correlation coefficient and activation energies were proposed for this system. It was found that o-vanillin yielded higher dye absorption levels than coumarin, leading to exhaustions of 88% and 87% for Disperse Red 167 and Disperse Blue 79, respectively. K/S values of dyed polyester were also found to be higher for dye baths containing o-vanillin with respect to the ones with coumarin. In terms of hot pressing fastness and wash fastness, generally no adverse influence on fastness properties was reported, while o-vanillin showed slightly better results compared to coumarin. Full article
(This article belongs to the Special Issue Textile and Textile-Based Materials)
Show Figures

Graphical abstract

Graphical abstract
Full article ">Figure 1
<p>Experimental dyeing process used for this study.</p>
Full article ">Figure 2
<p>Dyeing kinetics for polyester (polyethylene terephthalate) (PES) fabric dyed with Disperse Red 167 and Coumarin.</p>
Full article ">Figure 3
<p>Dyeing kinetics for PES fabric dyed with Disperse Red 167 and <span class="html-italic">o</span>-vanillin.</p>
Full article ">Figure 4
<p>Dyeing kinetics for PES fabric dyed with Disperse Blue 79 and Coumarin.</p>
Full article ">Figure 5
<p>Dyeing kinetics for PES fabric dyed with Disperse Blue 79 and <span class="html-italic">o</span>-vanillin.</p>
Full article ">
14 pages, 1511 KiB  
Article
Mucoadhesive Cyclodextrin-Modified Thiolated Poly(aspartic acid) as a Potential Ophthalmic Drug Delivery System
by Mária Budai-Szűcs, Eszter L. Kiss, Barnabás Áron Szilágyi, András Szilágyi, Benjámin Gyarmati, Szilvia Berkó, Anita Kovács, Gabriella Horvát, Zoltán Aigner, Judit Soós and Erzsébet Csányi
Polymers 2018, 10(2), 199; https://doi.org/10.3390/polym10020199 - 16 Feb 2018
Cited by 27 | Viewed by 5469
Abstract
Thiolated poly(aspartic acid) is known as a good mucoadhesive polymer in aqueous ophthalmic formulations. In this paper, cyclodextrin-modified thiolated poly(aspartic acid) was synthesized for the incorporation of prednisolone, a lipophilic ophthalmic drug, in an aqueous in situ gellable mucoadhesive solution. This polymer combines [...] Read more.
Thiolated poly(aspartic acid) is known as a good mucoadhesive polymer in aqueous ophthalmic formulations. In this paper, cyclodextrin-modified thiolated poly(aspartic acid) was synthesized for the incorporation of prednisolone, a lipophilic ophthalmic drug, in an aqueous in situ gellable mucoadhesive solution. This polymer combines the advantages of cyclodextrins and thiolated polymers. The formation of the cyclodextrin-drug complex in the gels was analyzed by X-ray powder diffraction. The ocular applicability of the polymer was characterized by means of physicochemical, rheological and drug diffusion tests. It was established that the chemical bonding of the cyclodextrin molecule did not affect the complexation of prednisolone, while the polymer solution preserved its in situ gellable and good mucoadhesive characteristics. The chemical immobilization of cyclodextrin modified the diffusion profile of prednisolone and prolonged drug release was observed. The combination of free and immobilized cyclodextrins provided the best release profile because the free complex can diffuse rapidly, while the bonded complex ensures a prolonged action. Full article
(This article belongs to the Collection Polysaccharides)
Show Figures

Graphical abstract

Graphical abstract
Full article ">Figure 1
<p>Synthesis of thiol and cyclodextrin functionalized poly(aspartic acid).</p>
Full article ">Figure 2
<p>Phase-solubility diagram of PR with MABCD and PASP-CEA-CD.</p>
Full article ">Figure 3
<p>X-ray powder diffractogram of PR, MABCD, PASP-CEA-CD, and complexes of PR with MABCD and PASP-CEA-CD.</p>
Full article ">Figure 4
<p>Gelation of the different polymer solutions.</p>
Full article ">Figure 5
<p>Frequency sweep test of the gel formulations.</p>
Full article ">Figure 6
<p>Drug release from the formulations containing PR. Cumulative mean values and standard deviations (S.D.), <span class="html-italic">n</span> = 3.</p>
Full article ">
24 pages, 7183 KiB  
Article
Thermally Induced Structural Transitions of Nylon 4 9 as a New Example of Even–Odd Polyamides
by Cristian Olmo, Maria Teresa Casas, Juan Carlos Martínez, Lourdes Franco and Jordi Puiggalí
Polymers 2018, 10(2), 198; https://doi.org/10.3390/polym10020198 - 16 Feb 2018
Cited by 9 | Viewed by 6436
Abstract
Crystalline morphology and structure of nylon 4 9 have been studied by means of optical and transmission electron microscopies, and X-ray diffraction. Rhombic crystals were characteristic of crystallization from glycerin dilute solutions, although the final morphology was dependent on the crystallization temperature. In [...] Read more.
Crystalline morphology and structure of nylon 4 9 have been studied by means of optical and transmission electron microscopies, and X-ray diffraction. Rhombic crystals were characteristic of crystallization from glycerin dilute solutions, although the final morphology was dependent on the crystallization temperature. In any case, a single electron diffraction pattern was always obtained, being characteristic a 2 mm symmetry and reflections at spacings that were indicative of a projected rectangular unit cell with hydrogen bonds established along two planar directions (i.e., the diagonals of the unit cell), as it was determined from related polyamides. Crystallization from the melt gave rise to negative birefringent spherulites with a morphology (axialitic, speckled or ringed) that was dependent on the crystallization temperature. Kinetic analysis indicated that melt crystallization took place according to two growth mechanisms (Regimes II and III), which reflect distinct secondary nucleation rates. A complex polymorphic behavior on heating and cooling processes was evidenced by real time synchrotron experiments, being determined an intermediate crystalline structure as well as the typical pseudohexagonal arrangement associated to the Brill transition. Polymorphic transitions were highly dependent on the initial crystalline structure, being enhanced the structural transition from the low temperature structure to the intermediate one when traces of the latter were initially present. Calorimetric and infrared studies supported also the detected thermal transitions of nylon 4 9. Full article
Show Figures

Graphical abstract

Graphical abstract
Full article ">Figure 1
<p>GPC chromatograph (<b>a</b>); FTIR spectrum (<b>b</b>); <sup>1</sup>H NMR spectrum (<b>c</b>); and TGA/DTGA thermogravimetric curves (<b>d</b>) of synthesized nylon 4 9.</p>
Full article ">Figure 2
<p>Transmission electron micrographs of nylon 4 9 crystals obtained from dilute glycerin solutions, illustrating the influence of crystallization conditions on morphology: (<b>a</b>) Arm of an spherulitic aggregate obtained at 90 °C. (<b>b</b>) Aggregates constituted by planar crystals obtained at 110 °C. Blue ellipsoid shows the presence of rhombic crystals whereas the orange ellipsoid and the inset point out the presence of lath shaped crystals. Serrated faces and globules are marked with garnet and violet ellipsoids, respectively. (<b>c</b>) Rhombic lamellar crystals obtained from crystallizations performed at 120 °C. Red dashed lines define the theoretical angles between growth faces. (<b>d</b>) Elongated lamellar morphologies obtained at 130 °C. Dashed lines indicate the theoretical growth faces according to the expected rhombic morphology. Obtuse angles could be recognized although curved morphologies could also be detected (blue ellipsoid).</p>
Full article ">Figure 3
<p>(<b>a</b>) Selected-area electron diffraction pattern of nylon 4 9 single crystals prepared from glycerin at 120 °C. Only the most intense <span class="html-italic">hk</span>0 reflections are labeled. The pattern shows a clear 2 mm symmetry and reciprocal axes are labeled. (<b>b</b>) X-ray diffraction profile of a nylon 4 9 sample isothermally crystallized from diluted glycerin solution.</p>
Full article ">Figure 4
<p>Scheme of the unfavorable hydrogen bonding geometry between odd carboxamide (i.e., pimelamide) units having an all-trans conformation (<b>a</b>); and the favorable interaction established according to the proposed structure where hydrogen bonds are established along two directions (<b>b</b>). For shake of clarity different representations are employed for the external and inner chains of the unit cell and a shorter dicarboxylic unit (i.e., pimelamide) has been considered. Arrows indicate the shift of neighboring chains with respect the central one. Color code: nitrogen, blue; oxygen, red; carbon, gray; hydrogen, brown. Reproduced with permission from [<a href="#B36-polymers-10-00198" class="html-bibr">36</a>], copyright 2015 Elsevier.</p>
Full article ">Figure 5
<p>X-ray diffraction profile of as synthesized nylon 4 9 sample.</p>
Full article ">Figure 6
<p>(<b>a</b>) Three-dimensional representation of WAXD profiles of a solution crystallized nylon 4 9 sample during heating (10 °C/min) from room temperature to fusion; and (<b>b</b>) evolution of the spacings of the two main reflections during the first heating. Full and empty symbols indicate well-defined and intuited reflections, respectively. The temperatures at which structural transitions occur are indicated with vertical lines. Reflections corresponding to Forms I and III are indicated in red and blue, respectively.</p>
Full article ">Figure 7
<p>Temperature evolution of the intensity of the main peaks (for the clarity of representation the Form I peak at 0.375–0.410 nm is not plotted) during: the first heating (<b>a</b>); cooling (<b>b</b>); and second heating (<b>c</b>) processes. Full and empty symbols indicate well-defined and intuited reflections, respectively. The temperatures at which structural transitions occur are indicated with vertical lines. Reflections corresponding to Forms I, II and III are indicated in red, green and blue, respectively.</p>
Full article ">Figure 8
<p>(<b>a</b>) Three-dimensional representation of WAXD profiles of nylon 4 9 during cooling (10 °C/min) from the melt to room temperature; and (<b>b</b>) evolution of the spacings of the two main reflections during the cooling run. Full and empty symbols indicate well-defined and intuited reflections, respectively. The temperatures at which structural transitions occur are indicated with vertical lines. Reflections corresponding to Forms I, II and III are indicated in red, green and blue, respectively.</p>
Full article ">Figure 9
<p>Diffraction profiles taken at room temperature for the solution (black) and melt (red) crystallized samples. Purple arrows compare the peaks associated with Form I. For the sake of completeness, a profile taken during cooling at 65 °C (blue) is also given. Evolution during cooling of some Form I and Form II representative peaks is indicated by the orange arrows and the shoulder associated with Form II with the asterisk and the ellipsoid. Dashed rectangles indicate the regions where tails of the amorphous halo could be detected.</p>
Full article ">Figure 10
<p>(<b>a</b>) Three-dimensional representation of WAXD profiles of a melt crystallized nylon 4 9 sample during the second heating (10 °C/min) from room temperature to fusion. Insets show a different orientation to clarify the temperature evolution of the main reflections. (<b>b</b>) Evolution of the spacings of the main reflections during the cooling run. Full and empty symbols indicate well-defined and intuited reflections, respectively. The temperatures at which structural transitions occur are indicated with vertical lines. Reflections corresponding to Forms I, II and III are indicated in red, green and blue, respectively.</p>
Full article ">Figure 11
<p>Temperature evolution of the 1570–1485 cm<sup>−1</sup> region of the FTIR spectra of: solution crystallized (<b>a</b>); and melt crystallized (<b>b</b>) nylon 4 9 samples.</p>
Full article ">Figure 12
<p>Diffraction profiles of nylon 4 9 samples taken at room temperature from down to up: as synthesized sample, solvent casting film from HFIP at a polymer concentration of 2 mg/mL, solvent casting film from formic acid at a polymer concentration of 2 mg/mL, solvent casting film from formic acid at a polymer concentration of 10 mg/mL and a melt quenched sample.</p>
Full article ">Figure 13
<p>Three dimensional representation of WAXD profiles of nylon 4 9 during heating (10 °C/min) from room temperature to fusion for: (<b>a</b>) solvent casting film from HFIP at a polymer concentration of 2 mg/mL; (<b>b</b>) solvent casting film from formic acid at a polymer concentration of 2 mg/mL; (<b>c</b>) solvent casting film from formic acid at a polymer concentration of 10 mg/mL; and (<b>d</b>) melt quenched sample.</p>
Full article ">Figure 14
<p>(<b>a</b>) Heating run of the as-synthesized nylon 4 9; (<b>b</b>) cooling run of nylon 4 9 from the melt state; (<b>c</b>) subsequent heating run of the melt crystallized sample; and (<b>d</b>) heating run from a nylon 4 9 melt quenched sample. Arrows indicate small endothermic and exothermic peaks.</p>
Full article ">Figure 15
<p>DSC traces corresponding to the heating run of samples isothermally crystallized at the indicated temperatures.</p>
Full article ">Figure 16
<p>Hoffman–Weeks plot of temperatures corresponding to the observed endothermic Peaks II and III associated with the high temperature Form III versus hot crystallization temperature. An equilibrium melting temperature of 243 °C could be deduced.</p>
Full article ">Figure 17
<p>Typical spherulitic morphologies of nylon 4 9 isothermally crystallized at the indicated temperatures. Black and white inset of the micrograph taken at 238 °C reveals the complex internal structure of the obtained spherulites. Color micrographs taken with a red tin plate to determine the sign of birefringence are shown as insets for all crystallizations.</p>
Full article ">Figure 18
<p>Selected-area electron diffraction pattern of nylon 4 9 spherulites crystallized at: 229 °C (<b>a</b>,<b>b</b>); and 238 °C (<b>c</b>). Patterns corresponded to the low temperature structure observed from solution crystallized samples. Symmetry is usually lost in the patterns coming from spherulites crystallized at 229 °C (<b>a</b>) as consequence of lamellar twisting, although a 2 <span class="html-italic">mm</span> symmetry can also hardly detected (<b>b</b>). This symmetry is more easily observed from spherulites attained at the higher temperature as a consequence of a flat-on lamellar disposition (<b>c</b>).</p>
Full article ">Figure 19
<p>Temperature dependence of crystal growth rate (solid green line for Regime III and dashed red line for Regime II) determined by Lauritzen–Hoffman equation and using the best fit parameters deduced for the two crystallization regimes. Experimental crystal growth rates and indicated by the square symbols. The inset shows the plot of ln <span class="html-italic">G</span> + <span class="html-italic">U</span>*/<span class="html-italic">R</span>(<span class="html-italic">T<sub>c</sub></span> − <span class="html-italic">T<sub>∞</sub></span>) versus 1/<span class="html-italic">Tc</span> (Δ<span class="html-italic">T</span>) <span class="html-italic">f</span> to determine the <span class="html-italic">Kg</span> secondary nucleation parameters.</p>
Full article ">
18 pages, 4423 KiB  
Article
Poly(mono/diethylene glycol n-tetradecyl ether vinyl ether)s with Various Molecular Weights as Phase Change Materials
by Dongfang Pei, Sai Chen, Wei Li and Xingxiang Zhang
Polymers 2018, 10(2), 197; https://doi.org/10.3390/polym10020197 - 15 Feb 2018
Cited by 3 | Viewed by 5290
Abstract
At present, research on the relationship of comb-like polymer phase change material structures and their heat storage performance is scarce. Therefore, this relationship from both micro and macro perspectives will be studied in this paper. In order to achieve a high phase change [...] Read more.
At present, research on the relationship of comb-like polymer phase change material structures and their heat storage performance is scarce. Therefore, this relationship from both micro and macro perspectives will be studied in this paper. In order to achieve a high phase change enthalpy, ethylene glycol segments were introduced between the vinyl and the alkyl side chains. A series of poly(mono/diethylene glycol n-tetradecyl ether vinyl ethers) (PC14EnVEs) (n = 1, 2) with various molecular weights were polymerized by living cationic polymerization. The results of PC14E1VE and PC14E2VE showed that the minimum number of carbon atoms required for side-chain crystallization were 7.7 and 7.2, which were lower than that reported in the literature. The phase change enthalpy 89 J/g (for poly(mono ethylene glycol n-tetradecyl ether vinyl ethers)) and 86 J/g (for poly(hexadecyl acrylate)) were approximately equal. With the increase of molecular weight, the melting temperature, the melting enthalpy, and the initial thermal decomposition temperature of PC14E1VE changed from 27.0 to 28.0 °C, from 95 to 89 J/g, and from 264 to 287 °C, respectively. When the number average molar mass of PC14EnVEs exceeded 20,000, the enthalpy values remained basically unchanged. The introduction of the ethylene glycol chain was conducive to the crystallization of alkyl side chains. Full article
Show Figures

Graphical abstract

Graphical abstract
Full article ">Figure 1
<p>FTIR spectra of C<sub>14</sub>E<sub>1</sub>VE (<b>A</b>) and C<sub>14</sub>E<sub>2</sub>VE (<b>B</b>): C<sub>14</sub>E<sub>29</sub>Br (<b>a</b>) and corresponding C<sub>14</sub>E<span class="html-italic"><sub>n</sub></span>VEs (<b>b</b>) (<span class="html-italic">n</span> = 1, 2).</p>
Full article ">Figure 2
<p><sup>1</sup>H NMR spectra of C<sub>14</sub>E<span class="html-italic"><sub>n</sub></span>VEs (<b>a</b>,<b>c</b>) and <sup>13</sup>C NMR spectra of C<sub>14</sub>E<span class="html-italic"><sub>n</sub></span>VEs (<b>b</b>,<b>d</b>) (<span class="html-italic">n</span> = 1, 2).</p>
Full article ">Figure 3
<p>DSC curves of C<sub>14</sub>E<span class="html-italic"><sub>n</sub></span>VEs, C<sub>14</sub>H<sub>30</sub>, and C<sub>14</sub>H<sub>29</sub>Br.</p>
Full article ">Figure 4
<p>TGA curves of C<sub>14</sub>E<sub>n</sub>VEs, C<sub>14</sub>H<sub>30</sub>, and C<sub>14</sub>H<sub>29</sub>Br.</p>
Full article ">Figure 5
<p>FTIR spectra of PC<sub>14</sub>E<sub>1</sub>VE (<b>a</b>) and PC<sub>14</sub>E<sub>2</sub>VE (<b>b</b>).</p>
Full article ">Figure 6
<p><sup>13</sup>C NMR spectra in CDCl<sub>3</sub> of PC<sub>14</sub>E<sub>1</sub>VE (<b>A</b>) and PC<sub>14</sub>E<sub>2</sub>VE (<b>B</b>).</p>
Full article ">Figure 7
<p><span class="html-italic">M</span><sub>n</sub> and MWD of PC<sub>14</sub>E<sub>1</sub>VE obtained using IBEA/Et<sub>1.5</sub>AlCl<sub>1.5</sub> in <span class="html-italic">n</span>-hexane, with ethyl acetate added as a base at 30 °C: [monomer]<sub>0</sub> = (0.1, 0.15, 0.19, 0.24, 0.27, 0.33, 0.35, 0.37); [IBEA]<sub>0</sub> = 4.0 mM; [Et<sub>1.5</sub>AlCl<sub>1.5</sub>]<sub>0</sub> = 20 mM; [added base]<sub>0</sub> = 1.0 M, in n-hexane, with various reaction times.</p>
Full article ">Figure 8
<p><span class="html-italic">M</span><sub>n</sub> and MWD of PC<sub>14</sub>E<sub>2</sub>VE obtained using IBEA/Et<sub>1.5</sub>AlCl<sub>1.5</sub> in <span class="html-italic">n</span>-hexane, with ethyl acetate added as a base at 30 °C: [monomer]<sub>0</sub> = (0.07, 0.11, 0.13, 0.15, 0.17, 0.21, 0.26, 0.3); [IBEA]<sub>0</sub> = 4.0 mM; [Et<sub>1.5</sub>AlCl<sub>1.5</sub>]<sub>0</sub> = 20 mM; [added base]<sub>0</sub> = 1.0 M, in <span class="html-italic">n</span>-hexane, with various reaction times.</p>
Full article ">Figure 9
<p>DSC thermograms of PC<sub>14</sub>E<sub>1</sub>VEs: (<b>A</b>) heating curves and (<b>B</b>) cooling curves.</p>
Full article ">Figure 10
<p>DSC thermograms of PC<sub>14</sub>E<sub>2</sub>VEs: (<b>A</b>) heating curves and (<b>B</b>) cooling curves.</p>
Full article ">Figure 11
<p>Melt enthalpy (a) and phase change temperatures (b, c) vs. molecular weights of PC<sub>14</sub>E<sub>1</sub>VEs (<b>A</b>) and PC<sub>14</sub>E<sub>2</sub>VEs (<b>B</b>).</p>
Full article ">Figure 12
<p>TGA curves of C<sub>14</sub>E<sub>1</sub>VE (<b>A</b>) and PC<sub>14</sub>E<sub>2</sub>VE (<b>B</b>) with various molecular weights.</p>
Full article ">Figure 13
<p><span class="html-italic">T</span><sub>5wt %</sub> vs. the number average molar mass of PC<sub>14</sub>E<sub>1</sub>VE and PC<sub>14</sub>E<sub>2</sub>VE.</p>
Full article ">Scheme 1
<p>The chemical formula of C<sub>14</sub>E<span class="html-italic"><sub>n</sub></span>VEs and PC<sub>14</sub>E<span class="html-italic"><sub>n</sub></span>VEs (<span class="html-italic">n</span> = 1, 2).</p>
Full article ">Scheme 2
<p>The preparation process illustration of PC<sub>14</sub>E<sub>1</sub>VE and PC<sub>14</sub>E<sub>2</sub>VE with various molecular weights.</p>
Full article ">
Previous Issue
Next Issue
Back to TopTop