[go: up one dir, main page]

Next Issue
Volume 10, November
Previous Issue
Volume 10, September


Cancers, Volume 10, Issue 10 (October 2018) – 52 articles

Cover Story (view full-size image): 
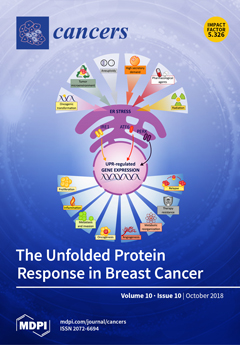
Tumor cells take advantage of cell stress response pathways to enable their survival under adverse conditions. In breast cancer cells, constitutive activation of unfolded protein response (UPR) promotes an adaptive, therapy-resistant phenotype. This UPR-dependence exposes a weakness in breast cancer cells that can be exploited for therapeutic purposes. The UPR is mediated by signalling through three transmembrane ER stress sensors, IRE1, PERK and ATF6. Several novel drugs that target these pathways, particularly the IRE1 pathway, show promise in preclinical studies, supporting the case for their clinical development. View this paper
  • Issues are regarded as officially published after their release is announced to the table of contents alert mailing list.
  • You may sign up for e-mail alerts to receive table of contents of newly released issues.
  • PDF is the official format for papers published in both, html and pdf forms. To view the papers in pdf format, click on the "PDF Full-text" link, and use the free Adobe Reader to open them.
Order results
Result details
Section
Select all
Export citation of selected articles as:
19 pages, 1219 KiB  
Article
Prognostic Values of EPDR1 Hypermethylation and Its Inhibitory Function on Tumor Invasion in Colorectal Cancer
by Chun-Ho Chu, Shih-Ching Chang, Hsiu-Hua Wang, Shung-Haur Yang, Kuo-Chu Lai and Te-Chang Lee
Cancers 2018, 10(10), 393; https://doi.org/10.3390/cancers10100393 - 22 Oct 2018
Cited by 22 | Viewed by 4109
Abstract
Aberrant DNA methylation is a potential mechanism underlying the development of colorectal cancer (CRC). Thus, identification of prognostic DNA methylation markers and understanding the related molecular functions may offer a new perspective on CRC pathogenesis. To that end, we explored DNA methylation profile [...] Read more.
Aberrant DNA methylation is a potential mechanism underlying the development of colorectal cancer (CRC). Thus, identification of prognostic DNA methylation markers and understanding the related molecular functions may offer a new perspective on CRC pathogenesis. To that end, we explored DNA methylation profile changes in CRC subtypes based on the microsatellite instability (MSI) status through genome-wide DNA methylation profiling analysis. Of 34 altered genes, three hypermethylated (epidermal growth factor, EGF; carbohydrate sulfotransferase 10, CHST10; ependymin related 1, EPDR1) and two hypomethylated (bone marrow stromal antigen 2, BST2; Rac family small GTPase 3, RAC3) candidates were further validated in CRC patients. Based on quantitative methylation-specific polymerase chain reaction (Q-MSP), EGF, CHST10 and EPDR1 showed higher hypermethylated levels in CRC tissues than those in adjacent normal tissues, whereas BST2 showed hypomethylation in CRC tissues relative to adjacent normal tissues. Additionally, among 75 CRC patients, hypermethylation of CHST10 and EPDR1 was significantly correlated with the MSI status and a better prognosis. Moreover, EPDR1 hypermethylation was significantly correlated with node negativity and a lower tumor stage as well as with mutations in B-Raf proto-oncogene serine/threonine kinase (BRAF) and human transforming growth factor beta receptor 2 (TGFβR2). Conversely, a negative correlation between the mRNA expression and methylation levels of EPDR1 in CRC tissues and cell lines was observed, revealing that DNA methylation has a crucial function in modulating EPDR1 expression in CRC cells. EPDR1 knockdown by a transient small interfering RNA significantly suppressed invasion by CRC cells, suggesting that decreased EPDR1 levels may attenuate CRC cell invasion. These results suggest that DNA methylation-mediated EPDR1 epigenetic silencing may play an important role in preventing CRC progression. Full article
Show Figures

Figure 1

Figure 1
<p>Methylation levels of (<b>A</b>) <span class="html-italic">EGF</span>, (<b>B</b>) <span class="html-italic">CHST10</span>, (<b>C</b>) <span class="html-italic">EPDR1</span>, (<b>D</b>) <span class="html-italic">BST2</span> and (<b>E</b>) <span class="html-italic">RAC3</span> in 75 colorectal cancer (CRC) tissues and adjacent non-cancerous tissues, as determined by quantitative methylation-specific polymerase chain reaction (Q-MSP). Normalization to β-actin (<span class="html-italic">ACTB</span>) was performed for all genes. <span class="html-italic">p</span> values were derived from the Mann-Whitney U test. <span class="html-italic">EGF</span>: epidermal growth factor; <span class="html-italic">CHST10</span>: carbohydrate sulfotransferase 10; <span class="html-italic">EPDR1</span>: ependymin related 1; <span class="html-italic">BST2</span>: bone marrow stromal antigen 2; <span class="html-italic">RAC3</span>: Rac family small GTPase 3.</p>
Full article ">Figure 2
<p>Kaplan-Meier analysis of overall survival in 75 CRC patients according to the methylation status of (<b>A</b>) <span class="html-italic">EGF</span>, (<b>B</b>) <span class="html-italic">CHST10</span>, (<b>C</b>) <span class="html-italic">EPDR1</span>, (<b>D</b>) <span class="html-italic">BST2</span> and (<b>E</b>) <span class="html-italic">RAC3</span>. CRC patients were divided into two groups based on the methylation cut-off points of five genes, as described in the Materials and Methods section. <span class="html-italic">p</span> values were derived from the log-rank test.</p>
Full article ">Figure 3
<p>Methylation status of <span class="html-italic">EPDR1</span> and corresponding <span class="html-italic">EPDR1</span> mRNA levels in 23 paired CRC tissue specimens. (<b>A</b>) The mRNA level of <span class="html-italic">EPDR1</span> was analyzed by qRT-PCR. (<b>B</b>) The DNA methylation level of <span class="html-italic">EPDR1</span> was analyzed by Q-MSP. The mRNA and methylation levels of the <span class="html-italic">EPDR1</span> gene are expressed on the log<sub>10</sub> scale. Box-and-whisker plots represent data with boxes ranging from the 25th to 75th percentile of the observed values, with the horizontal bar at the median value. The correlation between the qRT-PCR and Q-MSP results was assessed using linear regression.</p>
Full article ">Figure 4
<p><span class="html-italic">EPDR1</span> expression and DNA methylation status in CRC cell lines. (<b>A</b>) The protein level of EPDR1 in CRC cell lines was examined by western blotting using β-actin as a loading control. (<b>B</b>) The mRNA level of <span class="html-italic">EPDR1</span> in CRC cell lines was examined by qRT-PCR using GAPDH as a loading control. The data are the means and SD of three independent experiments. The relative expression of <span class="html-italic">EPDR1</span> mRNA is expressed compared with that in DLD-1 cells. (<b>C</b>) The methylation levels of <span class="html-italic">EPDR1</span> in CRC cell lines were determined by bisulfite sequencing PCR (BSP) and were quantified as histograms. (<b>D</b>) The upper graph presents the detailed 5-aza-dC treatment schedule; (Bottom) Four CRC cell lines were treated with 5-aza-dC (5 μM) or dimethyl sulfoxide (DMSO; Ctrl) for 96 h and then were analyzed by qRT-PCR. The data are presented as the means and SD of three independent experiments. * <span class="html-italic">p</span> &lt; 0.05 compared with Ctrl cells.</p>
Full article ">Figure 5
<p><span class="html-italic">EPDR1</span> knockdown suppresses invasion in CRC cells. Two CRC cell lines, DLD-1 and SW620, were transfected with either <span class="html-italic">EPDR1</span> small interfering RNA (siRNA, siEPDR1) or control siRNA (siCtrl). (<b>A</b>) The efficacy of <span class="html-italic">EPDR1</span> knockdown was examined by western blotting using β-actin as a loading control. (<b>B</b>) Cell proliferation was determined using the PrestoBlue cell viability reagent. The data are presented as the means and SD of three independent experiments. (<b>C</b>) The invasiveness of siEPDR1- and siCtrl-transfected cells was analyzed using Boyden chambers coated with a layer of Geltrex. The data are presented as the means and SD of three independent experiments. * <span class="html-italic">p</span> &lt; 0.05 compared with siCtrl cells.</p>
Full article ">
15 pages, 652 KiB  
Article
Predicting 90-Day Mortality in Locoregionally Advanced Head and Neck Squamous Cell Carcinoma after Curative Surgery
by Lei Qin, Tsung-Ming Chen, Yi-Wei Kao, Kuan-Chou Lin, Kevin Sheng-Po Yuan, Alexander T. H. Wu, Ben-Chang Shia and Szu-Yuan Wu
Cancers 2018, 10(10), 392; https://doi.org/10.3390/cancers10100392 - 22 Oct 2018
Cited by 19 | Viewed by 3724
Abstract
Purpose: To propose a risk classification scheme for locoregionally advanced (Stages III and IV) head and neck squamous cell carcinoma (LA-HNSCC) by using the Wu comorbidity score (WCS) to quantify the risk of curative surgeries, including tumor resection and radical neck dissection. Methods: [...] Read more.
Purpose: To propose a risk classification scheme for locoregionally advanced (Stages III and IV) head and neck squamous cell carcinoma (LA-HNSCC) by using the Wu comorbidity score (WCS) to quantify the risk of curative surgeries, including tumor resection and radical neck dissection. Methods: This study included 55,080 patients with LA-HNSCC receiving curative surgery between 2006 and 2015 who were identified from the Taiwan Cancer Registry database; the patients were classified into two groups, mortality (n = 1287, mortality rate = 2.34%) and survival (n = 53,793, survival rate = 97.66%), according to the event of mortality within 90 days of surgery. Significant risk factors for mortality were identified using a stepwise multivariate Cox proportional hazards model. The WCS was calculated using the relative risk of each risk factor. The accuracy of the WCS was assessed using mortality rates in different risk strata. Results: Fifteen comorbidities significantly increased mortality risk after curative surgery. The patients were divided into low-risk (WCS, 0–6; 90-day mortality rate, 0–1.57%), intermediate-risk (7–11; 2.71–9.99%), high-risk (12–16; 17.30–20.00%), and very-high-risk (17–18 and >18; 46.15–50.00%) strata. The 90-day survival rates were 98.97, 95.85, 81.20, and 53.13% in the low-, intermediate-, high-, and very-high-risk patients, respectively (log-rank p < 0.0001). The five-year overall survival rates after surgery were 70.86, 48.62, 22.99, and 18.75% in the low-, intermediate-, high-, and very-high-risk patients, respectively (log-rank p < 0.0001). Conclusion: The WCS is an accurate tool for assessing curative-surgery-related 90-day mortality risk and overall survival in patients with LA-HNSCC. Full article
(This article belongs to the Special Issue Application of Bioinformatics in Cancers)
Show Figures

Figure 1

Figure 1
<p>Kaplan–Meier curves for 90-day survival in patients with locoregionally advanced head and neck squamous cell carcinoma receiving curative surgery associated with the four risk groups. Note: <span class="html-italic">p</span>-value of Log Rank Test is &lt;0.0001.</p>
Full article ">Figure 2
<p>Kaplan–Meier curves for five years overall survival in patients with locoregionally advanced head and neck squamous cell carcinoma receiving curative surgery associated with the four risk groups. Note: <span class="html-italic">p</span>-value of Log Rank Test is &lt;0.0001.</p>
Full article ">
19 pages, 4401 KiB  
Article
Choline Kinase Alpha Inhibition by EB-3D Triggers Cellular Senescence, Reduces Tumor Growth and Metastatic Dissemination in Breast Cancer
by Elena Mariotto, Giampietro Viola, Roberto Ronca, Luca Persano, Sanja Aveic, Zaver M. Bhujwalla, Noriko Mori, Benedetta Accordi, Valentina Serafin, Luisa Carlota López-Cara and Roberta Bortolozzi
Cancers 2018, 10(10), 391; https://doi.org/10.3390/cancers10100391 - 22 Oct 2018
Cited by 23 | Viewed by 5488
Abstract
Choline kinase (ChoK) is the first enzyme of the Kennedy pathway leading to the biosynthesis of phosphatidylcholine (PtdCho), the most abundant phospholipid in eukaryotic cell membranes. EB-3D is a novel choline kinase α1 (ChoKα1) inhibitor with potent antiproliferative activity against a panel of [...] Read more.
Choline kinase (ChoK) is the first enzyme of the Kennedy pathway leading to the biosynthesis of phosphatidylcholine (PtdCho), the most abundant phospholipid in eukaryotic cell membranes. EB-3D is a novel choline kinase α1 (ChoKα1) inhibitor with potent antiproliferative activity against a panel of several cancer cell lines. ChoKα1 is particularly overexpressed and hyperactivated in aggressive breast cancer. By NMR analysis, we demonstrated that EB-3D is able to reduce the synthesis of phosphocholine, and using flow cytometry, immunoblotting, and q-RT-PCR as well as proliferation and invasion assays, we proved that EB-3D strongly impairs breast cancer cell proliferation, migration, and invasion. EB-3D induces senescence in breast cancer cell lines through the activation of the metabolic sensor AMPK and the subsequent dephosphorylation of mTORC1 downstream targets, such as p70S6K, S6 ribosomal protein, and 4E-BP1. Moreover, EB-3D strongly synergizes with drugs commonly used for breast cancer treatment. The antitumorigenic potential of EB-3D was evaluated in vivo in the syngeneic orthotopic E0771 mouse model of breast cancer, where it induces a significant reduction of the tumor mass at low doses. In addition, EB-3D showed an antimetastatic effect in experimental and spontaneous metastasis models. Altogether, our results indicate that EB-3D could be a promising new anticancer agent to improve aggressive breast cancer treatment protocols. Full article
Show Figures

Graphical abstract

Graphical abstract
Full article ">Figure 1
<p>Effect of EB-3D choline kinase α (ChoKα) inhibition in breast cancer cells. (<b>A</b>) Levels of choline (Cho), phosphocholine (PCho), glycerophosphocholine (GPCho), and total choline-containing compounds (tCho) quantified from 1H-NMR spectra of water-soluble extracts from MDA-MB-231 cells treated with DMSO or 1 μM of EB-3D (chemical structure shown in the inset) for the indicated time points. Metabolite levels are expressed as a percentage with respect to the control. (<b>B</b>) MTT cell viability assay in MDA-MB-231, MDA-MB-468 and MCF-7 cell lines treated with EB-3D for 72 h. The percentages of cell viability were normalized to untreated cells. Symbols and bars represent the mean ± standard error of the mean (SEM) of at least three independent experiments. (<b>C</b>) Percentage of cells in each phase of the cell cycle in breast cancer cell lines treated with vehicle or 1.25 μM of EB-3D for the indicated time points. Data are presented as mean ± SEM of three independent experiments. (<b>D</b>) Western blots depicting changes in protein expression in breast cancer cells following treatment with vehicle or 1 μM of EB-3D for the indicated time points. Lysates were made and probed with the indicated antibodies. Quantification and statistical analysis are depicted in <a href="#app1-cancers-10-00391" class="html-app">Figure S2A–C</a>. (<b>E</b>) Evaluation of cell death by trypan blue exclusion assay and (<b>F</b>) Annexin V-Propidium Iodide (AV-PI) flow cytometry analysis. Breast cancer cells were treated with 1 μM of EB-3D for 72 h and then medium was replaced with fresh medium with (EB-3D continuous) or without (EB-3D washout) the ChoKα inhibitor for further 72 h. Data are represented as mean ± SEM of four independent experiments. Statistical significance was determined using ANOVA with Newman–Keuls or Bonferroni correction. Asterisks indicate a significant difference between the treated and the control group. * <span class="html-italic">p</span> &lt; 0.05, ** <span class="html-italic">p</span> &lt; 0.01, *** <span class="html-italic">p</span> &lt; 0.001, **** <span class="html-italic">p</span> &lt; 0.0001.</p>
Full article ">Figure 2
<p>EB-3D affects AMPK-mTOR signaling pathway triggering cellular senescence. (<b>A</b>) Breast cancer cell lines were treated with 1 μM of EB-3D or vehicle for the indicated time points. Cells were then lysed and probed with the indicated antibodies. Quantification and statistical analysis are depicted in <a href="#app1-cancers-10-00391" class="html-app">Figure S4A–C</a>. (<b>B</b>–<b>E</b>) Flow cytometry analysis of cellular senescence using C<sub>12</sub>-FDG probe. MDA-MB-231 (<b>B</b>) and MDA-MB-468 (<b>C</b>) were treated with 1 μM of EB-3D for 72 h and then cells were supplied with fresh medium with (EB-3D continuous) or without (EB-3D WASHOUT) the ChoKα inhibitor for a further 72 h. MDA-MB-231 (<b>D</b>) and MDA-MB-468 (<b>E</b>) were treated with 1 μM of EB-3D for 72 h or pretreated for 2 h with 2.5 μM of Compound <b>C</b>. Data are represented as the C<sub>12</sub>-FDG mean fluorescence intensity (MFI) ± SEM of three independent experiments. Statistical significance was determined using ANOVA with Newman–Keuls correction. Asterisks indicate a significant difference between the treated and the control group, unless otherwise specified. * <span class="html-italic">p</span> &lt; 0.05, ** <span class="html-italic">p</span> &lt; 0.01, *** <span class="html-italic">p</span> &lt; 0.001, **** <span class="html-italic">p</span> &lt; 0.0001.</p>
Full article ">Figure 3
<p>EB-3D sensitizes breast cancer cells to common treatment. (<b>A</b>–<b>C</b>) MTT cell viability assay in breast cancer cell lines treated with EB-3D in combination with doxorubicin (Doxo) (<b>A</b>), 5-fluorouracil (5-FU) (<b>B</b>), and cisplatin (Cis-Pt) (<b>C</b>) for 72 h. The percentages of cell viability were normalized to untreated cells. Symbols and bars represent the mean ± SEM of at least four independent experiments. (<b>D</b>–<b>F</b>) Combination index (CI) calculated at the ED<sub>50</sub> and ED<sub>75</sub> for Doxo (<b>D</b>), 5-FU (<b>E</b>), and Cis-Pt (<b>F</b>) combination, where synergism is defined by CI &lt; 1. (<b>G</b>) Flow cytometry analysis of cell death. Breast cancer cells were treated with 1 μM of EB-3D or Cis-Pt (20 μM for MDA-MB-231 and MCF-7 or 2.5 μM for MDA-MB-468) or with the simultaneous addition of EB-3D and Cis-Pt for 72 h. Alternatively cells were pretreated with EB-3D for 72 h and then, after EB-3D removal, treated with Cis-Pt for a further 72 h. Bars represent the mean ± SEM of at least four independent experiments. Statistical significance was determined using ANOVA with Newman–Keuls correction. Asterisks indicate a significant difference between indicated groups. * <span class="html-italic">p</span> &lt; 0.05, ** <span class="html-italic">p</span> &lt; 0.01, *** <span class="html-italic">p</span> &lt; 0.001, **** <span class="html-italic">p</span> &lt; 0.0001.</p>
Full article ">Figure 4
<p>EB-3D impairs MDA-MB-231 motility and invasiveness. (<b>A</b>) Representative images of wound closure at the beginning and end of the scratch experiment, 10× magnification. (<b>B</b>) Bar graphs showing the relative quantification of the distance between scratch edges. Confluent MDA-MB-231 monolayer was scratched and treated with EB-3D at the indicated concentrations and monitored at 6, 24, and 48 h. (<b>C</b>) Relative quantification of BME-based invasion assays performed with MDA-MB-231 pretreated with EB-3D for 24 h at the indicated doses. Data are represented as mean ± SEM of four independent experiments. (<b>D</b>) Relative mRNA expression levels of EMT-related genes assessed in MDA-MB-231 cells treated with 1 μM of EB-3D by qRT-PCR. Data were normalized by the expression levels of the housekeeping gene <span class="html-italic">GUS</span> and expressed as a fold change relative to untreated cells (DMSO) using the 2-ΔΔCt method. Data are represented as mean ± SEM of three independent experiments. Statistical significance was determined using Student’s <span class="html-italic">t</span>-test or ANOVA depending on the type of data. For multiple test comparison, Newman–Keuls corrections was applied. Asterisks indicate a significant difference between the treated and the control group. * <span class="html-italic">p</span> &lt; 0.05, ** <span class="html-italic">p</span> &lt; 0.01, *** <span class="html-italic">p</span> &lt; 0.001, **** <span class="html-italic">p</span> &lt; 0.0001.</p>
Full article ">Figure 5
<p>ChoKα inhibition impairs mammary tumor growth in syngeneic orthotopic E0771-C57BL/6 mouse model. (<b>A</b>) Average mammary E0771 tumor volume of mice injected with either vehicle (DMSO) or 1 mg/kg of EB-3D (<span class="html-italic">n</span> = 8/treatment). (<b>B</b>) Average weight and macroscopic images (<b>C</b>) of resected tumors at the conclusion of the experiment. Values are depicted as mean ± SEM. Tumors were measured in two dimensions and tumor volume V (mm<sup>3</sup>) was calculated according to the formula V = (D × d<sup>2</sup>)/2, where D and d are the major and minor perpendicular tumor diameters, respectively. Differences between control and treated mice were analyzed using Student’s <span class="html-italic">t</span>-test using Bonferroni correction. (<b>D</b>) Quantitative analysis of Ki67 positive cells from E0771-C57BL/6 treated or not with 1 mg/kg of EB-3D. (<b>E</b>) Representative immunohistochemical micrographs of Ki67 positive cells (brown nuclei) and (<b>F</b>) β-galactosidase (X-gal)-staining. Nuclei have been counterstained by Meyer’s Hematoxylin (Magnification 10×). Statistical significance was determined using Student’s <span class="html-italic">t</span>-test or ANOVA, using Bonferroni correction. Asterisks indicate a significant difference between the treated and the control group. * <span class="html-italic">p</span> &lt; 0.05, *** <span class="html-italic">p</span> &lt; 0.001, **** <span class="html-italic">p</span> &lt; 0.0001.</p>
Full article ">Figure 6
<p>ChoKα inhibition reduces in vivo lung metastasis formation. (<b>A</b>) Number of experimentally induced lung macrometastasis and (<b>B</b>) micrometastasis after iv injection of E0771 cells and 3 weeks treatment with either vehicle (DMSO, n = 5) or 2.5 mg/kg of EB-3D (n = 6); (<b>C</b>) Number of experimentally induced lung macrometastasis after iv injection of human MDA-MB-231 cells in NOD/SCID mice and 7 weeks treatment with either vehicle (DMSO, n = 3) or 2.5 mg/kg of EB-3D (n = 3), (<b>D</b>) average lung weight, and (<b>E</b>) macroscopic images of resected lungs at the conclusion of the experiment. (<b>F</b>) Representative H&amp;E staining performed on lung tissue sections from control and treated xenograft MDA-MB-231-NOD/SCID mice (Magnification 10×). (<b>G</b>) Number of spontaneous lung macrometastasis and (<b>H</b>) micrometastasis after E0771 primary tumor removal. E0771-C57BL/6 mice were treated intraperitoneally (ip) for 4 weeks every other day with either vehicle (DMSO, n = 5) or 2.5 mg/kg of EB-3D (n = 7). Values are depicted as mean ± SEM. Differences between control and treated mice were analyzed using Student’s <span class="html-italic">t</span>-test with Bonferroni correction. * <span class="html-italic">p</span> &lt; 0.05, ** <span class="html-italic">p</span> &lt; 0.01.</p>
Full article ">
11 pages, 702 KiB  
Article
Druggable Nucleolin Identifies Breast Tumours Associated with Poor Prognosis That Exhibit Different Biological Processes
by Flora Nguyen Van Long, Audrey Lardy-Cleaud, Susan Bray, Sylvie Chabaud, Thierry Dubois, Alexandra Diot, Lee B. Jordan, Alastair M. Thompson, Jean-Christophe Bourdon, David Perol, Philippe Bouvet, Jean-Jacques Diaz and Virginie Marcel
Cancers 2018, 10(10), 390; https://doi.org/10.3390/cancers10100390 - 22 Oct 2018
Cited by 13 | Viewed by 3367
Abstract
Background: Nucleolin (NCL) is a multifunctional protein with oncogenic properties. Anti-NCL drugs show strong cytotoxic effects, including in triple-negative breast cancer (TNBC) models, and are currently being evaluated in phase II clinical trials. However, few studies have investigated the clinical value of NCL [...] Read more.
Background: Nucleolin (NCL) is a multifunctional protein with oncogenic properties. Anti-NCL drugs show strong cytotoxic effects, including in triple-negative breast cancer (TNBC) models, and are currently being evaluated in phase II clinical trials. However, few studies have investigated the clinical value of NCL and whether NCL stratified cancer patients. Here, we have investigated for the first time the association of NCL with clinical characteristics in breast cancers independently of the different subtypes. Methods: Using two independent series (n = 216; n = 661), we evaluated the prognostic value of NCL in non-metastatic breast cancers using univariate and/or multivariate Cox-regression analyses. Results: We reported that NCL mRNA expression levels are markers of poor survivals independently of tumour size and lymph node invasion status (n = 216). In addition, an association of NCL expression levels with poor survival was observed in TNBC (n = 40, overall survival (OS) p = 0.0287, disease-free survival (DFS) p = 0.0194). Transcriptomic analyses issued from The Cancer Genome Atlas (TCGA) database (n = 661) revealed that breast tumours expressing either low or high NCL mRNA expression levels exhibit different gene expression profiles. These data suggest that tumours expressing high NCL mRNA levels are different from those expressing low NCL mRNA levels. Conclusions: NCL is an independent marker of prognosis in breast cancers. We anticipated that anti-NCL is a promising therapeutic strategy that could rapidly be evaluated in high NCL-expressing tumours to improve breast cancer management. Full article
Show Figures

Figure 1

Figure 1
<p>Association of <span class="html-italic">NCL</span> expression levels with poor prognosis in breast cancer using Dundee series. A significant association was observed between <span class="html-italic">NCL</span> expression levels and overall (<b>A</b>) as well as disease-free survivals (<b>B</b>). Association between <span class="html-italic">NCL</span> expression levels and survival was analysed using Kaplan–Meier representation. Number of subjects at risk is indicated on the graph for the three <span class="html-italic">NCL</span> groups (low; intermediate; high). Log-rank <span class="html-italic">p</span>-value ≤ 0.05 was used to determine significant association.</p>
Full article ">Figure 2
<p>Association of <span class="html-italic">NCL</span> expression levels with poor prognosis in breast cancer subtypes using Dundee series. Overall (<b>A</b>,<b>C</b>,<b>E</b>) and disease-free survivals (<b>B</b>,<b>D</b>,<b>F</b>) in relation to <span class="html-italic">NCL</span> expression levels were analysed in tumours exhibiting different hormonal status: ER+ PR+/− HER2− (equivalent to the luminal subtype, <b>A</b>,<b>B</b>); ER+/− PR+/− HER2+ (equivalent to the HER2 subtype, <b>C</b>,<b>D</b>); and ER− PR− HER2− (equivalent to the triple-negative subtype, <b>E</b>,<b>F</b>). While <span class="html-italic">NCL</span> expression levels were not associated with survivals in patients carrying ER+ PR+/− HER2− and ER+/− PR+/− HER2+ tumours, associations were observed between <span class="html-italic">NCL</span> expression levels and both overall and disease-free survivals in patients bearing ER− PR− HER2− tumours. The association between <span class="html-italic">NCL</span> expression levels and survival was analysed using Kaplan–Meier representation. Number of subjects at risk is indicated on the graph for the three <span class="html-italic">NCL</span> groups (low; intermediate; high). Log-rank <span class="html-italic">p</span>-value ≤ 0.05 was used to determine significant association.</p>
Full article ">
13 pages, 2147 KiB  
Article
Perivascular Tumor-Infiltrating Leukocyte Scoring for Prognosis of Resected Hepatocellular Carcinoma Patients
by Markus Bo Schoenberg, Jingcheng Hao, Julian Nikolaus Bucher, Rainer Christoph Miksch, Hubertus Johann Wolfgang Anger, Barbara Mayer, Julia Mayerle, Jens Neumann, Markus Otto Guba, Jens Werner and Alexandr V. Bazhin
Cancers 2018, 10(10), 389; https://doi.org/10.3390/cancers10100389 - 18 Oct 2018
Cited by 26 | Viewed by 4801
Abstract
Liver resection is a curative treatment for hepatocellular carcinoma (HCC). Tumor-infiltrating leukocytes (TILs) are important players in predicting HCC recurrence. However, the invasive margin could not be confirmed as relevant for HCC. The migration of immune cells into HCC may originate from intratumoral [...] Read more.
Liver resection is a curative treatment for hepatocellular carcinoma (HCC). Tumor-infiltrating leukocytes (TILs) are important players in predicting HCC recurrence. However, the invasive margin could not be confirmed as relevant for HCC. The migration of immune cells into HCC may originate from intratumoral vessels. No previous study has examined perivascular (PV) infiltration. Tumors from 60 patients were examined. Immunohistochemistry was performed against CD3, CD8, CD20, and CD66b. TILs were counted in the PV regions using an algorithm for quantification of the tumor immune stroma (QTiS). The results were correlated with overall (OS) and disease-free survival (DFS), clinical parameters, and laboratory values. PV infiltration of TILs was predominant in resected HCC. Higher PV infiltration of CD3+ (p = 0.016) and CD8+ (p = 0.028) independently predicted better OS and DFS, respectively. CD20+ showed a trend towards better DFS (p = 0.076). Scoring of CD3+, CD8+, and CD20+ independently predicted OS and DFS (p < 0.01). The amount of perivascular-infiltrating CD3+ cells is an independent predictor of better OS, and CD8+ cells independently predict prolonged DFS. Our novel perivascular infiltration scoring (PVIS) can independently predict both DFS and OS in resected HCC patients. Full article
(This article belongs to the Special Issue Cancer Biomarkers)
Show Figures

Figure 1

Figure 1
<p>Overall (<b>A</b>) and Disease-free Survival (<b>B</b>) of All Patients.</p>
Full article ">Figure 2
<p>Representative Perivascular Patterns of CD3<sup>+</sup>, CD8<sup>+</sup>, CD20<sup>+</sup>, and CD66b<sup>+</sup> Cells under 50×, 100×, and 200× Magnifications. (<b>A</b>) CD3 at 50× magnification; (<b>B</b>) CD3 at 100× magnification; (<b>C</b>) CD3 at 200× magnification; (<b>D</b>) CD8 at 50× magnification; (<b>E</b>) CD8 at 100× magnification; (<b>F</b>) CD8 at 200× magnification; (<b>G</b>) CD20 at 50× magnification; (<b>H</b>) CD20 at 100× magnification; (<b>I</b>) CD20 at 200× magnification; (<b>J</b>) CD66b at 50× magnification (<b>K</b>) CD66b at 100× magnification; (<b>L</b>) CD66b at 200× magnification.</p>
Full article ">Figure 3
<p>Kaplan-Meier Curves of CD3<sup>+</sup> (<b>A</b>), CD8<sup>+</sup> (<b>B</b>), CD20<sup>+</sup> (<b>C</b>), and CD66<sup>+</sup> (<b>D</b>) cells for DFS. (<b>E</b>) Cox Regression Curves of CD3<sup>+</sup> cells on OS (Overall Survival) with Collett’s Model for Selection of Covariates. (<b>F</b>) Cox Regression Curves of CD8<sup>+</sup> cells on DFS (Disease Free Survival) with Collett’s Model for Selection of Covariates.</p>
Full article ">Figure 4
<p>Kaplan-Meier Curves of Scoring on (<b>A</b>) overall survival (OS) and (<b>B</b>) disease-free survival (DFS). (<b>C</b>) Cox Regression Curves of Scoring on DFS with Collett’s Model for Selection of Covariates. (<b>D</b>) Cox Regression Curves of Scoring on OS with Collett’s Model for Selection of Covariates.</p>
Full article ">
12 pages, 594 KiB  
Article
Accelerated Hypofractionated Active Raster-Scanned Carbon Ion Radiotherapy (CIRT) for Laryngeal Malignancies: Feasibility and Safety
by Sati Akbaba, Kristin Lang, Thomas Held, Olcay Cem Bulut, Matthias Mattke, Matthias Uhl, Alexandra Jensen, Peter Plinkert, Stefan Rieken, Klaus Herfarth, Juergen Debus and Sebastian Adeberg
Cancers 2018, 10(10), 388; https://doi.org/10.3390/cancers10100388 - 18 Oct 2018
Cited by 9 | Viewed by 3290
Abstract
(1) Background: The authors present the first results of active raster-scanned carbon ion radiotherapy (CIRT) for radioresistant laryngeal malignancies regarding efficacy and toxicity. (2) Methods: 15 patients with laryngeal adenoid cystic carcinoma (ACC; n = 8; 53.3%) or chondrosarcoma (CS; n = 7; [...] Read more.
(1) Background: The authors present the first results of active raster-scanned carbon ion radiotherapy (CIRT) for radioresistant laryngeal malignancies regarding efficacy and toxicity. (2) Methods: 15 patients with laryngeal adenoid cystic carcinoma (ACC; n = 8; 53.3%) or chondrosarcoma (CS; n = 7; 46.7%) who underwent radiotherapy with carbon ions (C12) at the Heidelberg Ion Beam Therapy Center (HIT) between 2013 and 2018 were identified retrospectively and analyzed for local control (LC), overall survival (OS), and distant progression-free survival using the Kaplan–Meier method. CIRT was applied either alone (n = 7, 46.7%) or in combination with intensity modulated radiotherapy (IMRT) (n = 8, 53.3%). The toxicity was assessed according to the Common Toxicity Terminology Criteria for Adverse Events (CTCAE) v4.03. (3). Results: the median follow-up was 24 months (range 5–61 months). Overall, the therapy was tolerated very well. No grade >3 acute and chronic toxicity could be identified. The most reported acute grade 3 side effects were acute dysphagia (n = 2; 13%) and acute odynophagia (n = 3; 20%), making supportive nutrition via gastric tube (n = 2; 13.3%) and via high caloric drinks (n = 1; 6.7%) necessary due to swallowing problems (n = 4; 27%). Overall, chronic grade 3 toxicity in the form of chronic hoarseness occurred in 7% of the patients (n = 1; 7%). At the last follow-up, all the patients were alive. No local or locoregional recurrence could be identified. Only one patient with laryngeal ACC developed lung metastases three years after the first diagnosis. (4) Conclusions: the accelerated hypofractionated active raster-scanned carbon ion radiotherapy for radioresistant laryngeal malignancies is feasible in practice with excellent local control rates and moderate acute and late toxicity. Further follow-ups are necessary to evaluate the long-term clinical outcome. Full article
(This article belongs to the Special Issue New Developments in Radiotherapy)
Show Figures

Figure 1

Figure 1
<p>The distribution of CTCAE (Common Toxicity Criteria for Adverse Events) acute and chronic toxicity regarding C12 (carbon ions) alone vs. bimodal RT (radiotherapy) vs. overall. No grade &gt;3 acute and late adverse side effects occurred. Overall, the chronic grade 3 toxicity was low (7%).</p>
Full article ">Figure 2
<p>The active raster-scanned carbon ion radiotherapy (CIRT) alone in a patient with chondrosarcoma of the left vocal cord. CIRT was applied with two beams at 60 Gy (relative biological effectiveness, RBE) in 3 Gy (RBE) per fraction. (<b>A</b>) Axial dose distribution; (<b>B</b>) coronal dose distribution; (<b>C</b>) sagittal dose distribution; (<b>D</b>) dose-volume histogram: gross tumor volume (GTV) is demonstrated in green color, clinical target volume (CTV) in orange, CTV including a 5 mm safety margin in blue, the tracheoesophageal junction in pink, and the submandibular salivary gland in brown color.</p>
Full article ">
16 pages, 1979 KiB  
Article
Impact of HACA on Immunomodulation and Treatment Toxicity Following ch14.18/CHO Long-Term Infusion with Interleukin-2: Results from a SIOPEN Phase 2 Trial
by Nikolai Siebert, Sascha Troschke-Meurer, Madlen Marx, Maxi Zumpe, Karoline Ehlert, Juliet Gray, Alberto Garaventa, Carla Manzitti, Shifra Ash, Thomas Klingebiel, James Beck, Victoria Castel, Dominique Valteau-Couanet, Hans Loibner, Ruth Ladenstein and Holger N. Lode
Cancers 2018, 10(10), 387; https://doi.org/10.3390/cancers10100387 - 17 Oct 2018
Cited by 13 | Viewed by 4565
Abstract
GD2-directed immunotherapies improve survival of high-risk neuroblastoma (NB) patients (pts). Treatment with chimeric anti-GD2 antibodies (Ab), such as ch14.18, can induce development of human anti-chimeric Ab (HACA). Here, we report HACA effects on ch14.18/CHO pharmacokinetics, pharmacodynamics and pain intensity in [...] Read more.
GD2-directed immunotherapies improve survival of high-risk neuroblastoma (NB) patients (pts). Treatment with chimeric anti-GD2 antibodies (Ab), such as ch14.18, can induce development of human anti-chimeric Ab (HACA). Here, we report HACA effects on ch14.18/CHO pharmacokinetics, pharmacodynamics and pain intensity in pts treated by long-term infusion (LTI) of ch14.18/CHO combined with IL-2. 124 pts received up to 5 cycles of ch14.18/CHO 10 days (d) infusion (10 mg/m2/d; d8–18) combined with s.c. IL-2 (6 × 10⁶ IU/m2/d; d1–5, d8–12). HACA, treatment toxicity, ch14.18/CHO levels, Ab-dependent cellular- (ADCC) and complement-dependent cytotoxicity (CDC) were assessed using respective validated assays. HACA-negative pts showed a steadily decreased pain in cycle 1 (74% pts without morphine by d5 of LTI) with further decrease in subsequent cycles. Ch14.18/CHO peak concentrations of 11.26 ± 0.50 µg/mL found in cycle 1 were further elevated in subsequent cycles and resulted in robust GD2-specific CDC and ADCC. Development of HACA (21% of pts) resulted in strong reduction of ch14.18/CHO levels, abrogated CDC and ADCC. Surprisingly, no difference in pain toxicity between HACA-positive and -negative pts was found. In conclusion, ch14.18/CHO LTI combined with IL-2 results in strong activation of Ab effector functions. Importantly, HACA response abrogated CDC but did not affect pain intensity indicating CDC-independent pain induction. Full article
Show Figures

Figure 1

Figure 1
<p>Schematic overview of the treatment schedule and the time line of the LTI study. (<b>A</b>) The LTI study (EudraCT-Number: 2009-018077-31) was planned as a single-arm study and amended in 2014 to address a randomized question. From 2011 to 2014, 124 pts were recruited in the single-arm phase, and 2 × 80 pts were recruited from 2014 to 2017 in the randomized phase. The single-arm phase consisted of a dose-finding (protocol version 1; 24 + 20 pts) and a dose confirmation cohort (protocol version 2; 80 pts), leading to a total of 124 pts in that part or the trial; (<b>B</b>) 122 of 124 enrolled NB pts received up to five treatment cycles (35 d/cycle) according to the following treatment protocol (2 pts progressed prior to first antibody application): IL-2 (aldesleukin; black horizontal bar) was given once a day for five days (s.c., d1–5, 6 × 10<sup>6</sup> IU/m<sup>2</sup>/d), followed by a combined application of IL-2 once a day (s.c., d8–12, 6 × 10<sup>6</sup> IU/m<sup>2</sup>/d) with a 10 days continuous infusion of ch14.18/CHO (i.v., d8–18, 10 mg/m<sup>2</sup>/d; grey horizontal bar). Starting on d19, treatment was continued with 13-cis-retinoic acid (isotretinoin; white horizontal bar) given twice a day (b.i.d) for the next 14 days (p.o., d19–32). Cumulative doses of IL-2, ch14.18/CHO and 13-cis-RA per cycle were 60 × 10<sup>6</sup> IU/m<sup>2</sup>, 100 mg/m<sup>2</sup> and 2240 mg/m<sup>2</sup>, respectively.</p>
Full article ">Figure 2
<p>Time-line of HACA development during treatment with ch14.18/CHO. Serum samples collected from 122 pts treated with up to five cycles of ch14.18/CHO immunotherapy were analyzed in every cycle with a validated ELISA allowing for the detection of anti-ch14.18/CHO Abs (HACA). The cumulative incidence of HACA in treated pts during the treatment period is shown over time (black solid line). For a better overview, the end of the respective cycle is indicated by dashed vertical lines.</p>
Full article ">Figure 3
<p>Serum levels of ch14.18/CHO and HACA in treated pts. (<b>A</b>) Samples collected from HACA-negative (99/122 pts, closed circles) and HACA-positive pts who developed non-neutralizing (5/23 pts, open circles) and neutralizing anti-ch14.18/CHO Ab (18/23 pts, closed triangles) were evaluated with the ch14.18/CHO-triple-ELISA strategy described in “Materials and Methods”. Ch14.18/CHO levels were analyzed prior to start, during and after the end of Ab infusion. The LTI of ch14.18/CHO is indicated by the gray field and IL-2 treatments by the black bars; (<b>B</b>) Baseline ch14.18/CHO concentrations in samples of HACA negative pts collected at d1 of every cycle. Data are shown as mean values ± SEM of experiments performed at least in triplicate. When error bars are not visible they are covered by the symbol. Solid line indicates the trend increase of maximum concentrations of ch14.18/CHO over time; (<b>C</b>) HACA serum levels of each HACA-positive pt of the non-neutralizing (5/23 pts, open circles) and neutralizing (18/23 pts, closed circles) cohort. White (non-neutralizing) and black solid horizontal bars (neutralizing) indicate mean values of the respective group. Grey and black solid lines indicate a trend of HACA levels during the entire treatment period in non-neutralizing and neutralizing pts, respectively. <span class="html-italic">t</span>-test or Mann-Whitney Rank Sum test. (<b>A</b>) ** <span class="html-italic">p</span> &lt; 0.01 vs. d18, cycle 1; *** <span class="html-italic">p</span> &lt; 0.001 vs. d18, cycle 1; <sup>§</sup> <span class="html-italic">p</span> &lt; 0.05 vs. d18, cycle 2; <sup>§§§</sup> <span class="html-italic">p</span> &lt; 0.001 vs. d18, cycle 2; <sup>##</sup> <span class="html-italic">p</span> &lt; 0.01 vs. d18, cycle 2 of non-neutralizing pts; <sup>###</sup> <span class="html-italic">p</span> &lt; 0.001 vs. d18 of the respective cycle of non-neutralizing pts; (<b>B</b>) *** <span class="html-italic">p</span> &lt; 0.001 vs. d1, cycle 1; <sup>§§</sup> <span class="html-italic">p</span> &lt; 0.01 vs. d1, cycle 2; <sup>§§§</sup> <span class="html-italic">p</span> &lt; 0.001 vs. d1, cycle 2; <sup>###</sup> <span class="html-italic">p</span> &lt; 0.001 vs. d1, cycle 3.</p>
Full article ">Figure 4
<p>Ch14.18/CHO-mediated ADCC and impact of HACA response. Induction of GD<sub>2</sub>-specific ch14.18/CHO-mediated ADCC in HACA-negative (<b>A</b>) and HACA-positive pts (non-neutralizing (<b>B</b>) and neutralizing pts (<b>C</b>)) treated with the LTI regimen was analyzed in cycles 1, 3 and 5 on d15 (closed circles) and compared to the baseline cytotoxicity of the respective cycle (d1; open circles). ADCC was evaluated against the GD<sub>2</sub>-positive NB cells LAN-1 as described in “Materials and Methods”. The circles represent pts evaluable for the analysis (number of pts are shown above the respective groups). Experiments were performed in six replicates. White (non-neutralizing) and black solid horizontal bars (neutralizing) indicate mean values of the respective group. <span class="html-italic">t</span>-test or Mann-Whitney Rank Sum test. ** <span class="html-italic">p</span> &lt; 0.01 vs. d1 of the respective cycle.</p>
Full article ">Figure 5
<p>Ch14.18/CHO-mediated CDC and impact of HACA response. Induction of GD<sub>2</sub>-specific ch14.18/CHO-mediated CDC in HACA-negative (<b>A</b>) and HACA-positive pts who developed non-neutralizing (<b>B</b>) and neutralizing anti-ch14.18/CHO Ab (<b>C</b>) was analyzed. CDC was tested in cycles 1, 3 and 5 on d8 after the start of Ab infusion (i.e., d15; closed circles) and compared to the baseline CDC of the respective cycle (d1; open circles) using the cytotoxicity assay as described in “Materials and Methods”. The circles represent pts evaluable for the analysis. Experiments were performed in six replicates. White (non-neutralizing) and black solid horizontal bars (neutralizing) indicate mean values of the respective group. <span class="html-italic">t</span>-test or Mann-Whitney Rank Sum test. *** <span class="html-italic">p</span> &lt; 0.001 vs. d1 of the respective cycle; <sup>§§§</sup> <span class="html-italic">p</span> &lt; 0.001 vs. d1, cycle 1; <sup>##</sup> <span class="html-italic">p</span> &lt; 0.001 vs. d1, cycle 3.</p>
Full article ">Figure 6
<p>Intravenous morphine usage and pain assessment. Ch14.18/CHO-dependent pain toxicity was evaluated by systematic assessments of i.v. morphine usage (<b>A</b>,<b>C</b>,<b>D</b>) and pain scores (<b>B</b>) in every treatment cycle during antibody administration (LTI, 10 days) as described in “Materials and Methods”. (<b>A</b>) Usage of i.v. morphine in μg/kg/d was determined daily per pt and cycle and presented as mean ± SEM. When error bars are not visible, they are covered by the symbol; (<b>B</b>) Pain assessment scores were determined daily per pts and cycle using two validated age-adapted pain score systems. Values represent mean maximum pain scores ± SEM; (<b>C</b>) Comparison of i.v. morphine usage in every cycle on d8 (i.e., d1 of ch14.18/CHO infusion) in HACA-negative pts (closed circles) and pts with neutralizing (closed triangles) and non-neutralizing HACA (open circles); (<b>D</b>) Daily i.v. morphine usage in cycle 3 in HACA-negative pts (closed circles) and pts with neutralizing (closed triangles) and non-neutralizing HACA (open circles). Data represent mean ± SEM. When error bars are not visible they are covered by the symbol. <span class="html-italic">t</span>-test or Mann-Whitney Rank Sum test. (<b>A</b>) *** <span class="html-italic">p</span> &lt; 0.001 vs. d1, cycle 1; <sup>§§§</sup> <span class="html-italic">p</span> &lt; 0.001 vs. d1, cycle 2, 3, 4 and 5; (<b>B</b>) ** <span class="html-italic">p</span> &lt; 0.01 vs. d1, cycle 1; <sup>§§§</sup> <span class="html-italic">p</span> &lt; 0.001 vs. d1, cycle 2, 3, 4 and 5.</p>
Full article ">
16 pages, 2754 KiB  
Article
Nafamostat Mesilate Enhances the Radiosensitivity and Reduces the Radiation-Induced Invasive Ability of Colorectal Cancer Cells
by Hiroshi Sugano, Yoshihiro Shirai, Takashi Horiuchi, Nobuhiro Saito, Yohta Shimada, Ken Eto, Tadashi Uwagawa, Toya Ohashi and Katsuhiko Yanaga
Cancers 2018, 10(10), 386; https://doi.org/10.3390/cancers10100386 - 17 Oct 2018
Cited by 11 | Viewed by 4897 | Correction
Abstract
Neoadjuvant chemoradiotherapy followed by radical surgery is the standard treatment for patients with locally advanced low rectal cancer. However, several studies have reported that ionizing radiation (IR) activates nuclear factor kappa B (NF-κB) that causes radioresistance and induces matrix metalloproteinase (MMP)-2/-9, which promote [...] Read more.
Neoadjuvant chemoradiotherapy followed by radical surgery is the standard treatment for patients with locally advanced low rectal cancer. However, several studies have reported that ionizing radiation (IR) activates nuclear factor kappa B (NF-κB) that causes radioresistance and induces matrix metalloproteinase (MMP)-2/-9, which promote tumor migration and invasion. Nafamostat mesilate (FUT175), a synthetic serine protease inhibitor, enhances the chemosensitivity to cytotoxic agents in digestive system cancer cells by inhibiting NF-κB activation. Therefore, we evaluated the combined effect of IR and FUT175 on cell proliferation, migration and invasion of colorectal cancer (CRC) cells. IR-induced upregulation of intranuclear NF-κB, FUT175 counteracted this effect. Moreover, the combination treatment suppressed cell viability and induced apoptosis. Similar effects were also observed in xenograft tumors. In addition, FUT175 prevented the migration and invasion of cancer cells caused by IR by downregulating the enzymatic activity of MMP-2/-9. In conclusion, FUT175 enhances the anti-tumor effect of radiotherapy through downregulation of NF-κB and reduces IR-induced tumor invasiveness by directly inhibiting MMP-2/-9 in CRC cells. Therefore, the use of FUT175 during radiotherapy might improve the efficacy of radiotherapy in patients with CRC. Full article
(This article belongs to the Collection Drug Resistance and Novel Therapies in Cancers)
Show Figures

Figure 1

Figure 1
<p>Inhibition of ionizing radiation (IR)-induced activation of nuclear factor kappa B (NF-κB) by nafamostat mesilate (FUT175). Assessment of NF-κB activation (p65 levels) in SW620 and DLD-1 cells by enzyme-linked immunosorbent assay (ELISA). The cells were treated with FUT175 (80 μg/mL) for 3 h prior to irradiation (5 Gy). At 3 h of incubation after the treatment, the levels of NF-κB p65 in the nuclear extracts were measured. p65 concentration was higher in the IR groups than in the control groups (SW620: 1169.4% ± 158.2 vs. 903.3% ± 93.1, DLD-1: 1948.5% ± 169.8 vs. 1589.2% ± 115.7; <span class="html-italic">p</span> &lt; 0.01) and decreased in the combination groups (SW620: 447.5% ± 72.2, DLD-1: 899.6% ± 53.7; <span class="html-italic">p</span> &lt; 0.01). *, <span class="html-italic">p</span> &lt; 0.05; **, <span class="html-italic">p</span> &lt; 0.01. All experiments were performed in triplicate.</p>
Full article ">Figure 2
<p>Nafamostat mesilate (FUT175) enhances radiosensitivity and ionizing radiation (IR)-induced cell apoptosis in colorectal cancer (CRC) cells. (<b>a</b>) The cells were treated with FUT175 (80 μg/mL) for 3 h prior to irradiation (2 Gy, 5 Gy). At 96 h of incubation after the treatment, the cell viability was measured. The viability of SW620 and DLD-1 cells in the FUT175 groups was significantly lower than that of cells in the control groups (SW620: 41.6% ± 3.8, <span class="html-italic">p</span> &lt; 0.01; DLD-1: 76.1% ± 12.5, <span class="html-italic">p</span> &lt; 0.01). In the IR groups, cell viability was reduced in a dose-dependent manner. Cell viability in the combination groups was significantly lower than that in the IR groups at each IR dose (SW620, 2 Gy: 20.0% ± 5.5 vs. 41.7% ± 4.5 and 5 Gy: 5.6% ± 1.5 vs. 13.8% ± 1.9, <span class="html-italic">p</span> &lt; 0.01; DLD-1, 2 Gy: 54.0% ± 10.8 vs. 83.2% ± 7.8 and 5 Gy: 40.8% ± 5.6 vs. 66.1% ± 8.9, <span class="html-italic">p</span> &lt; 0.01). (<b>b</b>) The cells were treated with FUT175 (80 μg/mL) for 3 h prior to irradiation (5 Gy). At 72 h of incubation after the treatment, the apoptotic cells were measured by flow cytometry analysis after Annexin/FITC staining. The percentage of early and late apoptotic cells in the combination groups was significantly greater than that in the IR groups (early apoptosis: SW620, 7.5% ± 0.4 vs. 4.5% ± 0.0 and DLD-1, 14.7% ± 0.7 vs. 9.5% ± 1.2, <span class="html-italic">p</span> &lt; 0.01; late apoptosis: SW620, 47.2% ± 2.2 vs. 17.5% ± 0.9 and DLD-1, 10.1% ± 0.4 vs. 4.9% ± 0.5, <span class="html-italic">p</span> &lt; 0.01). (<b>c</b>) The cells were treated with FUT175 (80 μg/mL) for 3 h prior to irradiation (5 Gy). At 24 h of incubation after the treatment, the apoptosis-related proteins were measured by western blot analysis. The levels of cleaved caspase-9/-8/-3, and cleaved PARP in the combination groups were greater than those in the other groups. *, <span class="html-italic">p</span> &lt; 0.05; **, <span class="html-italic">p</span> &lt; 0.01. All experiments were performed in triplicate.</p>
Full article ">Figure 3
<p>Nafamostat mesilate (FUT175) inhibits tumor growth in SW620 xenograft mice. (<b>a</b>) We established a colorectal cancer model by subcutaneously injecting 5 × 10<sup>6</sup> SW620 cells into the right flank of the animals. Three weeks after injection, the animals were randomized into the following groups: FUT175, intraperitoneally injected with FUT175 (30 mg/kg) five times a week; ionizing radiation (IR), intraperitoneally injected with an equal volume of distilled water five times a week and irradiated once (5 Gy); IR + FUT175, intraperitoneally injected with FUT175 (30 mg/kg) five times a week and irradiated once (5 Gy); CTR, intraperitoneally injected with an equal volume of distilled water five times a week. Mean tumor volume was measured at the indicated times after treatment. The largest tumor volume (mm<sup>3</sup>) measured in the control, FUT175, IR, and combination groups (mean ± standard deviation [SD]) was 2445 ± 1166, 1812 ± 707, 1499 ± 724, and 773 ± 471, respectively. The tumor volume in the combination group was significantly smaller than that in the IR group (<span class="html-italic">p</span> &lt; 0.05). (<b>b</b>) There were no significant differences in the body weights of the animals among the experimental groups. *, <span class="html-italic">p</span> &lt; 0.05.</p>
Full article ">Figure 4
<p>Nuclear factor kappa B (NF-κB) activity and immunohistochemical analysis of cell proliferation and apoptosis in vivo. (<b>a</b>) ELISA revealed that the concentration of NF-κB p65 in the nuclear extract of excised tumor tissues in the ionizing radiation (IR) group was significantly higher than that in the control group, and the IR-induced NF-κB activation was inhibited in the combination group (<span class="html-italic">p</span> &lt; 0.01). (<b>b</b>) The percent of Ki-67-positive cells in the combination group was lower than that in the IR group (43.3% ± 3.9 vs. 56.5% ± 2.6, <span class="html-italic">p</span> &lt; 0.01). (<b>c</b>) The number of TdT-mediated dUTP nick-end labeling (TUNEL)-positive cells in the combination group was higher than that in the IR group (65.7% ± 18.3% vs. 25.2 ± 3.6, <span class="html-italic">p</span> &lt; 0.01). **, <span class="html-italic">p</span> &lt; 0.01.</p>
Full article ">Figure 5
<p>Nafamostat mesilate (FUT175) suppresses ionizing radiation (IR)-induced cell migration and invasion in vitro. (<b>a</b>) The cells were treated with FUT175 (80 μg/mL) for 3 h prior to irradiation (5 Gy). Wound healing was measured at 0 and 24 h after the treatment. The wound area of the combination groups was significantly wider than that of the IR groups (SW620: 90.6% ± 3.8 vs. 80.4% ± 5.0, <span class="html-italic">p</span> &lt; 0.01; DLD-1: 54.2% ± 5.6 vs. 41.4% ± 9.9, <span class="html-italic">p</span> &lt; 0.05). (<b>b</b>) Immediately after irradiation (5 Gy), the cells were harvested and reseeded into a 96-well plate at a density of 2 × 10<sup>5</sup> cells/well and incubated with FUT175 (80 μg/mL) for 24 h. Invading cells were quantified by reading the fluorescence at 480 nm/520 nm. The invasion index of the combination groups was significantly lower than that of the IR groups (SW620: 407.5 ± 25.8 vs. 594.0 ± 43.9, <span class="html-italic">p</span> &lt; 0.01; DLD-1: 146.3 ± 6.4 vs. 169.5 ± 5.8, <span class="html-italic">p</span> &lt; 0.01). *, <span class="html-italic">p</span> &lt; 0.05; **, <span class="html-italic">p</span> &lt; 0.01. RFU: Relative fluorescence units. All experiments were performed in triplicate.</p>
Full article ">Figure 6
<p>Nafamostat mesilate (FUT175) inhibits the enzymatic activity of matrix metalloproteinase (MMP)-2 and MMP-9 in colorectal cancer (CRC) cells. (<b>a</b>) The cells were treated with FUT175 (80 μg/mL) for 3 h prior to irradiation (5 Gy). At 24 h of incubation after the treatment, the conditioned media were measured. Gelatin zymography of CRC cells after 5 Gy ionizing radiation (IR) (or 0 Gy, control) showed that treatment with FUT175 for 24 h decreased the activity of MMP-2 and MMP-9. (<b>b</b>) The cells were treated with FUT175 (80 μg/mL) for 3 h prior to irradiation (5 Gy). At 24 h of incubation after the treatment, the conditioned media were measured. Quantitative MMP activity assays showed that the enzymatic activity of MMP-2 and MMP-9 was significantly lower in the combination groups than in the IR groups (MMP-2: SW620, 65.1% ± 3.0 vs. 119.5% ± 6.6 and DLD-1, 61.6% ± 1.6 vs. 173.2% ± 6.0, <span class="html-italic">p</span> &lt; 0.01; MMP-9: SW620, 83.1% ± 1.9 vs. 124.8% ± 6.9 and DLD-1, 70.7% ± 2.8 vs. 174.6% ± 4.4, <span class="html-italic">p</span> &lt; 0.01). **, <span class="html-italic">p</span> &lt; 0.01. All experiments were performed in triplicate.</p>
Full article ">Figure 7
<p>Nafamostat mesilate (FUT175) directly inhibits the activity of matrix metalloproteinase (MMP)-2 and MMP-9. (<b>a</b>) The cells were treated with FUT175 (80 μg/mL) for 3 h prior to irradiation (5 Gy). At 24 h of incubation after the treatment, the proteins of MMP-2 and MMP-9 were measured by western blot analysis. FUT175 did not significantly alter the protein expression of MMP-2 and MMP-9. (<b>b</b>) The enzymatic activity of MMP-2 and MMP-9 was measured immediately after FUT175 treatment (control, or 8, 80, 800 μg/mL) by quantitative MMP activity assay. The activity of MMP-2 and MMP-9 was significantly and dose-dependently inhibited by FUT175. *, <span class="html-italic">p</span> &lt; 0.05; **, <span class="html-italic">p</span> &lt; 0.01. All experiments were performed in triplicate.</p>
Full article ">
20 pages, 8837 KiB  
Article
SPARC Inhibits Metabolic Plasticity in Ovarian Cancer
by Christine Naczki, Bincy John, Chirayu Patel, Ashlyn Lafferty, Alia Ghoneum, Hesham Afify, Michael White, Amanda Davis, Guangxu Jin, Steven Kridel and Neveen Said
Cancers 2018, 10(10), 385; https://doi.org/10.3390/cancers10100385 - 16 Oct 2018
Cited by 22 | Viewed by 4854
Abstract
The tropism of ovarian cancer (OvCa) to the peritoneal cavity is implicated in widespread dissemination, suboptimal surgery, and poor prognosis. This tropism is influenced by stromal factors that are not only critical for the oncogenic and metastatic cascades, but also in the modulation [...] Read more.
The tropism of ovarian cancer (OvCa) to the peritoneal cavity is implicated in widespread dissemination, suboptimal surgery, and poor prognosis. This tropism is influenced by stromal factors that are not only critical for the oncogenic and metastatic cascades, but also in the modulation of cancer cell metabolic plasticity to fulfill their high energy demands. In this respect, we investigated the role of Secreted Protein Acidic and Rich in Cysteine (SPARC) in metabolic plasticity of OvCa. We used a syngeneic model of OvCa in Sparc-deficient and proficient mice to gain comprehensive insight into the paracrine effect of stromal-SPARC in metabolic programming of OvCa in the peritoneal milieu. Metabolomic and transcriptomic profiling of micro-dissected syngeneic peritoneal tumors revealed that the absence of stromal-Sparc led to significant upregulation of the enzymes involved in glycolysis, TCA cycle, and mitochondrial electron transport chain (ETC), and their metabolic intermediates. Absence of stromal-Sparc increased reactive oxygen species and perturbed redox homeostasis. Recombinant SPARC exerted a dose-dependent inhibitory effect on glycolysis, mitochondrial respiration, ATP production and ROS generation. Comparative analysis with human tumors revealed that SPARC-regulated ETC-signature inversely correlated with SPARC transcripts. Targeting mitochondrial ETC by phenformin treatment of tumor-bearing Sparc-deficient and proficient mice mitigated the effect of SPARC-deficiency and significantly reduced tumor burden, ROS, and oxidative tissue damage in syngeneic tumors. In summary, our findings provide novel insights into the role of SPARC in regulating metabolic plasticity and bioenergetics in OvCa, and shines light on its potential therapeutic efficacy. Full article
Show Figures

Figure 1

Figure 1
<p>Enhanced growth of ID8 syngeneic tumors in <span class="html-italic">SP<sup>−/−</sup></span> mice. (<b>A</b>) photomicrographs of <span class="html-italic">SP<sup>+/+</sup></span> and <span class="html-italic">SP<sup>−/−</sup></span> mice 8 weeks after ip injection of ID8 cells. (<b>B</b>) Scatter plots showing the arbitrary scores of tumor burden in <span class="html-italic">SP<sup>+/+</sup></span> and <span class="html-italic">SP<sup>−/−</sup></span> mice. (<b>C</b>) H&amp;E staining of ip tumors (100×, upper), Ki67 immunostaining of syngeneic tumor sections (lower, 200×). (<b>D</b>) Box plots of the proliferation index determined by counting Ki67 positive nuclei in five random fields/tumor section (n = 3 sections/genotype). <span class="html-italic">p</span> values are determined by Mann-Whitney and Student’s <span class="html-italic">t</span>-test.</p>
Full article ">Figure 2
<p>Effect of host-SPARC on glycolysis: (<b>A</b>) Bars depicting mean ± SEM of the changes in the transcripts (n = 3/genotype), (<b>B</b>) HK2 and TPI1 activity in ID8 tumors grown in <span class="html-italic">SP<sup>−/−</sup></span> and <span class="html-italic">SP<sup>+/+</sup></span> mice. Bars represent the mean ± SEM of the measured (n = 6/genotype; unpaired Student’s <span class="html-italic">t</span>-test). (<b>C</b>) The levels of glycolysis metabolites (n = 6/genotype) between ID8 tumors grown in <span class="html-italic">SP<sup>−/−</sup></span> and <span class="html-italic">SP<sup>+/+</sup></span> mice. <span class="html-italic">p</span> &lt; 0.05, Student’s <span class="html-italic">t</span>-test. (<b>D</b>) Confocal immunofluorescence showing the expression of glucose transporters Glut1 and Glut4 in OVCAR3 and SKOV3 treated with 10 µg/mL SPARC for 24 h (magnification 100×). (<b>E</b>) Bars represent mean ± SEM of the mean fluorescence intensity of expression of Glut1 and Glut4. * <span class="html-italic">p</span> &lt; 0.05, Mann-Whitney test.</p>
Full article ">Figure 3
<p>Effect of SPARC on glycolysis: (<b>A</b>,<b>B</b>) ECAR Seahorse tracing of a representative of three experiments of OVCAR3 and SKOV3 treated with the indicated concentrations of SPARC for 24 h and were subjected to glycolysis stress assay as described in Materials and Methods. (<b>C</b>,<b>D</b>) Bars represent mean ± SEM of glycolysis, glycolytic capacity and glycolytic reserve of experiments described in (<b>A</b>,<b>B</b>) (n = 5/experimental condition in each experiment) corrected to the number of viable cells counted by trypan blue exclusion. * <span class="html-italic">p</span> &lt; 0.05, ** <span class="html-italic">p</span> &lt; 0.01, *** <span class="html-italic">p</span> &lt; 0.001, and **** <span class="html-italic">p</span> &lt; 0.0001, respectively, one-way ANOVA with multiple comparisons and Tuckey’s post-hoc test.</p>
Full article ">Figure 4
<p>Effect of stromal-SPARC on TCA cycle and pentose phosphate pathway (PPP). (<b>A</b>) Schema of glysolysis, TCA and PPP pathways showing the upregulated (Red) and the downregulated (blue) enzymes and metabolites. (<b>B</b>) Bar graph representing mean ± SEM of the changes in the transcripts (n = 3/genotype), and (<b>C</b>) metabolites (n = 6/genotype) between ID8 tumors grown in <span class="html-italic">SP<sup>−/−</sup></span> and <span class="html-italic">SP<sup>+/+</sup></span> mice. (<b>D</b>) Bar graph representing mean ± SEM of metabolites of PPP (n = 6/genotype) in syngeneic tumors. * <span class="html-italic">p</span> &lt; 0.05, Student’s <span class="html-italic">t</span>-test.</p>
Full article ">Figure 5
<p>Effect of SPARC on mitochondrial electron transport chain (ETC). (<b>A</b>) Gene Set Enrichment Analysis (GSEA) of the top upregulated genes in whole transcriptome of ID8 tumors grown in <span class="html-italic">SP<sup>−/−</sup></span> compared to <span class="html-italic">SP<sup>+/+</sup></span> mice showing the enrichment of oxidative phosphorylation and reactive oxygen species in tumors from <span class="html-italic">SP<sup>−/−</sup></span> mice. (<b>B</b>) Bars represent mean ± SEM of the transcript levels of the indicated mitochondrial ETC enzymes determined by qRT-PCR, n = 3/genotype each in triplicates. * <span class="html-italic">p</span> &lt; 0.05, Student’s <span class="html-italic">t</span>-test. (<b>C</b>) Human HGSC data sets from TCGA were stratified based on SPARC transcript level as SPARC-low and SPARC-High. The levels of the indicated enzymes were compared between SPARC-low and SPARC-High groups as described in the material and methods. ** <span class="html-italic">p</span> &lt; 0.01 and *** <span class="html-italic">p</span> &lt; 0.001.</p>
Full article ">Figure 6
<p>Effect of SPARC on mitochondrial functions and bioenergetics. (<b>A</b>,<b>B</b>) Seahorse tracing of the oxygen consumption rate in OVCAR3 and SKOV3 treated with the indicated concentrations of SPARC for 24 h, followed by mitochondrial stress test as described in material and methods. (<b>C</b>,<b>D</b>) Bar graphs of means ± SEM of the basal and maximal respiration, ATP production and spare respiratory in OVCAR3 and SKOV3 cells treated with SPARC recorded in a representative of three experiments (Five replica/experimental condition/experiment). <span class="html-italic">* p</span> &lt; 0.05, <span class="html-italic">** p</span> &lt; 0.01, one-way ANOVA with Tuckey’s post-hoc test.</p>
Full article ">Figure 7
<p>Effect of SPARC on mitochondrial mass: (<b>A</b>) Electron microscopic images of the mitochondria in ID8 syngeneic tumors in <span class="html-italic">SP<sup>−/−</sup></span> and <span class="html-italic">SP<sup>+/+</sup></span> mice (top). Bars depict the mean ± SEM of the number of mitochondria in five independent fields/section, n = 4/genotype. <span class="html-italic">p</span> &lt; 0.05, Student’s <span class="html-italic">t</span>-test. (<b>B</b>) MitoTracker red fluorescent staining of respiring mitochondria in OVCAR3 and SKOV3 treated with LPA in the presence and absence of SPARC. (<b>C</b>) Bars depict the relative fluorescent intensity of Mitotracker stain. <span class="html-italic">p</span> &lt; 0.05, Mann-Whitney Test.</p>
Full article ">Figure 8
<p>Effect of SPARC on mitochondrial ROS in OvCa cells. (<b>A</b>) GSEA graph depicting enrichment of ROS in syngeneic tumors from <span class="html-italic">SP<sup>−/−</sup></span> mice. (<b>B</b>) Bars depict the relative expression of the indicated metabolites in syngeneic ID8 tumors in <span class="html-italic">SP<sup>+/+</sup></span> and <span class="html-italic">SP<sup>−/−</sup></span> mice. * <span class="html-italic">p</span> &lt; 0.05 unpaired Student’s <span class="html-italic">t</span>-test. (<b>C</b>) Schema of the pathway of the metabolites involved in redox signaling. Red: upregulated; Blue: downregulated. (<b>D</b>) MitoSox fluorescence microscopy of SKOV3 and OVCAR3 treated with LPA with and without SPARC. (<b>E</b>) Bars depict mean ± SEM of the fluorescent intensity of images in (<b>D</b>) <span class="html-italic">p</span> &lt; 0.05, Mann-Whitney’s test.</p>
Full article ">Figure 9
<p>Effect of phenformin on syngeneic ID8 tumors in <span class="html-italic">SP<sup>−/−</sup></span> and <span class="html-italic">SP<sup>+/+</sup></span> mice. (<b>A</b>) Schema of the mouse therapeutic trial with phenformin. (<b>B</b>) Scatter plots showing the effect of phenformin on syngeneic tumor burden in <span class="html-italic">SP<sup>−/−</sup></span> and <span class="html-italic">SP<sup>+/+</sup></span> mice. <span class="html-italic">p</span> &lt; 0.05. (<b>C</b>) Bars depict mean ± SEM of the levels of H<sub>2</sub>O<sub>2</sub> in syngeneic tumors determined by DCF fluorescence. <span class="html-italic">p</span> &lt; 0.05, Student’s <span class="html-italic">t</span>-test. (<b>D</b>) Immunostaining of syngeneic tumors with the indicated antibodies (200×).</p>
Full article ">
10 pages, 505 KiB  
Article
Risk Factors for Severe Diarrhea with an Afatinib Treatment of Non-Small Cell Lung Cancer: A Pooled Analysis of Clinical Trials
by Ashley M. Hopkins, Anh-Minh Nguyen, Christos S. Karapetis, Andrew Rowland and Michael J. Sorich
Cancers 2018, 10(10), 384; https://doi.org/10.3390/cancers10100384 - 15 Oct 2018
Cited by 12 | Viewed by 3948
Abstract
Afatinib is an effective therapy for metastatic non-small cell lung cancer (NSCLC) but it is associated with a relatively high incidence of severe diarrhea. The association between pre-treatment candidate predictors (age, sex, race, performance status, renal function, hemoglobin, and measures of body mass) [...] Read more.
Afatinib is an effective therapy for metastatic non-small cell lung cancer (NSCLC) but it is associated with a relatively high incidence of severe diarrhea. The association between pre-treatment candidate predictors (age, sex, race, performance status, renal function, hemoglobin, and measures of body mass) and severe (grade ≥ 3) diarrhea was evaluated using logistic regression with pooled individual participant data from seven clinical studies. A risk score was developed based on the count of major risk factors. Overall, 184 of 1151 participants (16%) experienced severe diarrhea with use of afatinib. Body weight, body mass index, and body surface area all exhibited a prominent non-linear association where risk increased markedly at the lower range (p < 0.005). Low weight (<45 kg), female sex, and older age (≥60 years) were identified as major independent risk factors (p < 0.01). Each risk factor was associated with a two-fold increase in the odds of severe diarrhea, and this was consistent between individuals commenced on 40 mg or 50 mg afatinib. A simple risk score based on the count of these risk factors identifies individuals at lowest and highest risk (C-statistic of 0.65). Risk of severe diarrhea for individuals commenced on 40 mg afatinib ranged from 6% for individuals with no risk factors to 33% for individuals with all three risk factors. Full article
(This article belongs to the Special Issue Epidermal Growth Factor Receptor Signaling in Cancer)
Show Figures

Figure 1

Figure 1
<p>Loess locally weighted smoothed relationship between risk of grade ≥3 diarrhea and (<b>a</b>) body weight, (<b>b</b>) body surface area, and (<b>c</b>) body mass index.</p>
Full article ">Figure 1 Cont.
<p>Loess locally weighted smoothed relationship between risk of grade ≥3 diarrhea and (<b>a</b>) body weight, (<b>b</b>) body surface area, and (<b>c</b>) body mass index.</p>
Full article ">
3 pages, 153 KiB  
Editorial
Hippo Pathway in Cancer, towards the Realization of Hippo-Targeted Therapy
by Yutaka Hata
Cancers 2018, 10(10), 383; https://doi.org/10.3390/cancers10100383 - 12 Oct 2018
Cited by 1 | Viewed by 2574
15 pages, 2364 KiB  
Article
Targeting MicroRNA-143 Leads to Inhibition of Glioblastoma Tumor Progression
by Eunice L. Lozada-Delgado, Nilmary Grafals-Ruiz, Miguel A. Miranda-Román, Yasmarie Santana-Rivera, Fatma Valiyeva, Mónica Rivera-Díaz, María J. Marcos-Martínez and Pablo E. Vivas-Mejía
Cancers 2018, 10(10), 382; https://doi.org/10.3390/cancers10100382 - 12 Oct 2018
Cited by 24 | Viewed by 4910
Abstract
Glioblastoma (GBM) is the most common and aggressive of all brain tumors, with a median survival of only 14 months after initial diagnosis. Novel therapeutic approaches are an unmet need for GBM treatment. MicroRNAs (miRNAs) are a class of small non-coding RNAs that [...] Read more.
Glioblastoma (GBM) is the most common and aggressive of all brain tumors, with a median survival of only 14 months after initial diagnosis. Novel therapeutic approaches are an unmet need for GBM treatment. MicroRNAs (miRNAs) are a class of small non-coding RNAs that regulate gene expression at the post-transcriptional level. Several dysregulated miRNAs have been identified in all cancer types including GBM. In this study, we aimed to uncover the role of miR-143 in GBM cell lines, patient samples, and mouse models. Quantitative real-time RT-PCR of RNA extracted from formalin-fixed paraffin-embedded (FFPE) samples showed that the relative expression of miR-143 was higher in GBM patients compared to control individuals. Transient transfection of GBM cells with a miR-143 oligonucleotide inhibitor (miR-143-inh) resulted in reduced cell proliferation, increased apoptosis, and cell cycle arrest. SLC30A8, a glucose metabolism-related protein, was identified as a direct target of miR-143 in GBM cells. Moreover, multiple injections of GBM tumor-bearing mice with a miR-143-inh-liposomal formulation significantly reduced tumor growth compared to control mice. The reduced in vitro cell growth and in vivo tumor growth following miRNA-143 inhibition suggests that miR-143 is a potential therapeutic target for GBM therapy. Full article
(This article belongs to the Special Issue Glioblastoma: State of the Art and Future Perspectives)
Show Figures

Figure 1

Figure 1
<p>MiR-143 expression levels in GBM. Formalin-fixed paraffin-embedded (FFPE) tissue blocks from 19 newly diagnosed Glioblastoma (GBM) patients (13 females, 6 males) and 5 control patients (2 females, 3 males) were used in this study. GBM patients showed higher miR-143 expression compared to control patient samples (* <span class="html-italic">p</span> &lt; 0.05); dots represent the means of triplicates ± SD.</p>
Full article ">Figure 2
<p>Effect of miR-143 inhibition or overexpression on cell proliferation. Total RNA was isolated, and qPCR was performed. (<b>A</b>) Relative miR-143 expression in a panel of Glioblastoma (GBM) cell lines, calculated relative to T98G cells; (<b>B</b>) Relative miR-143 expression after transient transfection of U87 with miR-inhibitors, calculated relative to the Negative control (NC) inhibitor. Colony formation assay after transfection of (<b>C</b>) U87 and (<b>D</b>) A-172 GBM cells with miR-143 inhibitor (miR-143-inh) or negative control inhibitor (NC-inh). (<b>E</b>) qPCR for relative miR-143 expression in empty vector (EV) and miR-143 T98G clones, calculated relative to the T98G non-treated (T98G NT) cells. (<b>F</b>) Colony formation assay of the T98G (143-1) miR-143 overexpressing clone and T98G Empty Vector (EV) clone. Columns represent the means of at least triplicates ± SEM (* <span class="html-italic">p</span> &lt; 0.05, ** <span class="html-italic">p</span> &lt; 0.01, *** <span class="html-italic">p</span> &lt; 0.001).</p>
Full article ">Figure 3
<p>Inhibition of miR-143 induces apoptosis and cell cycle arrest. Apoptosis and cell cycle progression were measured by flow cytometry as described in the “Materials and Methods” section. U87 cells were transfected with 100 nM of negative control (NC-inh) or miR-143 inhibitor (miR-143-inh). (<b>A</b>) Seventy-two hours later, cells were fixed and cell cycle progression was assessed using the Muse Cell Analyzer. (<b>B</b>) Western blot analysis was performed 72 h after miR-inh transfection to detect changes in cell cycle-related proteins. (<b>C</b>) Densitometric analysis of the band intensities from (<b>B</b>) was performed and intensity values were expressed relative to NC-inh treated cells. U87 cells were treated as in (<b>A</b>), and 72 h later the Muse Cell Analyzer was used to measure apoptosis with (<b>D</b>) Annexin V and (<b>E</b>) Caspase 3/7 activity assays. (<b>F</b>) U87 cells were treated as in (<b>A</b>) and western blot analysis was performed to detect PARP-1 expression. (<b>G</b>) Densitometric analysis of the band intensities from (<b>F</b>) was performed and values were expressed relative to NC-inh treated cells. Columns represent the means of at least triplicates ± SEM (* <span class="html-italic">p</span> &lt; 0.05, ** <span class="html-italic">p</span> &lt; 0.01).</p>
Full article ">Figure 4
<p>Identification of miR-143 target genes in GBM cells. (<b>A</b>) SYBR Green-based qPCR was performed with total RNA isolated from T98G cells transiently transfected with miR-143-inh or NC-inh. (<b>B</b>) Western blot analysis was performed with protein extracts from miR-143 overexpressed (143-1, 143-2) and EV clones. (<b>C</b>) Western blot analysis of protein extracts from U87 cells treated with 200 nM miR-143-inh or NC-inh, Non-treated cells (NT), and U87 cells with transfection reagent alone (lipo) as loading controls. (<b>D</b>) Dual-luciferase reporter assays were performed where luciferase activity was calculated relative to the NC-inh. (<b>E</b>) IPA analysis showing the interaction of miR-143 with its target genes and SLC30A8 association with glucose metabolism.</p>
Full article ">Figure 5
<p>In vivo targeting of miR-143 reduces tumor growth. (<b>A</b>) Experimental design. (<b>B</b>) MiR-143 inhibition effect on tumor growth was calculated as described in the “Materials and Methods” section. (<b>C</b>) MiR-143 expression levels were measured by qPCR from total RNA extracted from mouse tumor tissues. Columns represent the means of N = 7 for NC-inh and N = 9 for miR-143-inh treatments ± SEM. (<b>D</b>) SLC30A8 expression levels were measured by western blot analysis in protein samples extracted from the mouse tumor tissues. * <span class="html-italic">p</span> &lt; 0.05, ** <span class="html-italic">p</span> &lt; 0.01.</p>
Full article ">Figure 5 Cont.
<p>In vivo targeting of miR-143 reduces tumor growth. (<b>A</b>) Experimental design. (<b>B</b>) MiR-143 inhibition effect on tumor growth was calculated as described in the “Materials and Methods” section. (<b>C</b>) MiR-143 expression levels were measured by qPCR from total RNA extracted from mouse tumor tissues. Columns represent the means of N = 7 for NC-inh and N = 9 for miR-143-inh treatments ± SEM. (<b>D</b>) SLC30A8 expression levels were measured by western blot analysis in protein samples extracted from the mouse tumor tissues. * <span class="html-italic">p</span> &lt; 0.05, ** <span class="html-italic">p</span> &lt; 0.01.</p>
Full article ">
13 pages, 631 KiB  
Review
Involving the microRNA Targetome in Esophageal-Cancer Development and Behavior
by Francisca Dias, Mariana Morais, Ana Luísa Teixeira and Rui Medeiros
Cancers 2018, 10(10), 381; https://doi.org/10.3390/cancers10100381 - 12 Oct 2018
Cited by 9 | Viewed by 3395
Abstract
Esophageal cancer (EC) is the eighth most common and sixth leading cause of cancer-related mortality in the world. Despite breakthroughs in EC diagnosis and treatment, patients with complete pathologic response after being submitted to chemoradiotherapy are still submitted to surgery, despite its high [...] Read more.
Esophageal cancer (EC) is the eighth most common and sixth leading cause of cancer-related mortality in the world. Despite breakthroughs in EC diagnosis and treatment, patients with complete pathologic response after being submitted to chemoradiotherapy are still submitted to surgery, despite its high morbidity. Single-nucleotide polymorphisms (SNPs) in miRNA, miRNA-binding sites, and in its biogenesis pathway genes can alter miRNA expression patterns, thereby influencing cancer risk and prognosis. In this review, we systematized the information available regarding the impact of these miR-SNPs in EC development and prognosis. We found 34 miR-SNPs that were associated with EC risk. Despite the promising applicability of these miR-SNPs as disease biomarkers, they still lack validation in non-Asian populations. Moreover, there should be more pathway-based approaches to evaluate the cumulative effect of multiple unfavorable genotypes and, consequently, identify miR-SNPs signatures capable of predicting EC therapy response and prognosis. Full article
(This article belongs to the Special Issue MicroRNA-Associated Cancer Metastasis)
Show Figures

Figure 1

Figure 1
<p>Overview of miRNA-related single-nucleotide polymorphisms (miR-SNPs) found and their impact on esophageal cancer (EC).</p>
Full article ">
21 pages, 996 KiB  
Review
Cancer-Associated Thrombosis: An Overview of Mechanisms, Risk Factors, and Treatment
by Norbaini Binti Abdol Razak, Gabrielle Jones, Mayank Bhandari, Michael C. Berndt and Pat Metharom
Cancers 2018, 10(10), 380; https://doi.org/10.3390/cancers10100380 - 11 Oct 2018
Cited by 393 | Viewed by 24592
Abstract
Cancer-associated thrombosis is a major cause of mortality in cancer patients, the most common type being venous thromboembolism (VTE). Several risk factors for developing VTE also coexist with cancer patients, such as chemotherapy and immobilisation, contributing to the increased risk cancer patients have [...] Read more.
Cancer-associated thrombosis is a major cause of mortality in cancer patients, the most common type being venous thromboembolism (VTE). Several risk factors for developing VTE also coexist with cancer patients, such as chemotherapy and immobilisation, contributing to the increased risk cancer patients have of developing VTE compared with non-cancer patients. Cancer cells are capable of activating the coagulation cascade and other prothrombotic properties of host cells, and many anticancer treatments themselves are being described as additional mechanisms for promoting VTE. This review will give an overview of the main thrombotic complications in cancer patients and outline the risk factors for cancer patients developing cancer-associated thrombosis, focusing on VTE as it is the most common complication observed in cancer patients. The multiple mechanisms involved in cancer-associated thrombosis, including the role of anticancer drugs, and a brief outline of the current treatment for cancer-associated thrombosis will also be discussed. Full article
(This article belongs to the Special Issue The Role of Thrombosis and Haemostasis in Cancer)
Show Figures

Figure 1

Figure 1
<p>Direct mechanisms involved in cancer-associated thrombosis. Direct activation of coagulation and platelets can occur through several factors expressed on or released from cancer cells. These include the expression of tissue factor (TF), the key initiator of the coagulation cascade, which can also be released by TF-positive microparticles. Podoplanin (PDPN) expression can directly cause platelet activation and aggregation via the C-type lectin-like receptor 2 (CLEC-2) receptor on platelets. Plasminogen activation inhibitor-1 (PAI-1), a key inhibitor of fibrinolysis, is highly expressed in cancer cells. Cancer cells also secrete platelet agonists such as ADP and thrombin, thus further promoting platelet activation through P2Y12 and protease-activated receptors 1 and 4 (PAR1/4), respectively. Phosphatidyl serine (PS) expressed on tumour microparticles may also promote coagulation as PS serves as a surface for formation of coagulation complexes. Cancer procoagulant (CP) has been shown to directly activate coagulation by activating Factor X.</p>
Full article ">Figure 2
<p>Indirect mechanisms promoting thrombosis in cancer. Tumours can be highly metastatic, resulting in cancer cell dissemination and intravasation into nearby blood vessels. Inflammatory cytokine secretion from tumour cells can cause activation of platelets and promote a procoagulant phenotype in endothelial cells. Cancer-derived factors also stimulate neutrophils to release neutrophil extracellular traps (NETs). NETs serve as a scaffold that can physically entrap platelets, or activate platelets through NET-associated histones, ultimately leading to profound platelet activation, fibrin deposition, and entrapment of red blood cells, exacerbating clot formation.</p>
Full article ">
20 pages, 1039 KiB  
Article
Identification of the Transcription Factor Relationships Associated with Androgen Deprivation Therapy Response and Metastatic Progression in Prostate Cancer
by Nitya V. Sharma, Kathryn L. Pellegrini, Veronique Ouellet, Felipe O. Giuste, Selvi Ramalingam, Kenneth Watanabe, Eloise Adam-Granger, Lucresse Fossouo, Sungyong You, Michael R. Freeman, Paula Vertino, Karen Conneely, Adeboye O. Osunkoya, Dominique Trudel, Anne-Marie Mes-Masson, John A. Petros, Fred Saad and Carlos S. Moreno
Cancers 2018, 10(10), 379; https://doi.org/10.3390/cancers10100379 - 11 Oct 2018
Cited by 25 | Viewed by 5331
Abstract
Background: Patients with locally advanced or recurrent prostate cancer typically undergo androgen deprivation therapy (ADT), but the benefits are often short-lived and the responses variable. ADT failure results in castration-resistant prostate cancer (CRPC), which inevitably leads to metastasis. We hypothesized that differences in [...] Read more.
Background: Patients with locally advanced or recurrent prostate cancer typically undergo androgen deprivation therapy (ADT), but the benefits are often short-lived and the responses variable. ADT failure results in castration-resistant prostate cancer (CRPC), which inevitably leads to metastasis. We hypothesized that differences in tumor transcriptional programs may reflect differential responses to ADT and subsequent metastasis. Results: We performed whole transcriptome analysis of 20 patient-matched Pre-ADT biopsies and 20 Post-ADT prostatectomy specimens, and identified two subgroups of patients (high impact and low impact groups) that exhibited distinct transcriptional changes in response to ADT. We found that all patients lost the AR-dependent subtype (PCS2) transcriptional signatures. The high impact group maintained the more aggressive subtype (PCS1) signal, while the low impact group more resembled an AR-suppressed (PCS3) subtype. Computational analyses identified transcription factor coordinated groups (TFCGs) enriched in the high impact group network. Leveraging a large public dataset of over 800 metastatic and primary samples, we identified 33 TFCGs in common between the high impact group and metastatic lesions, including SOX4/FOXA2/GATA4, and a TFCG containing JUN, JUNB, JUND, FOS, FOSB, and FOSL1. The majority of metastatic TFCGs were subsets of larger TFCGs in the high impact group network, suggesting a refinement of critical TFCGs in prostate cancer progression. Conclusions: We have identified TFCGs associated with pronounced initial transcriptional response to ADT, aggressive signatures, and metastasis. Our findings suggest multiple new hypotheses that could lead to novel combination therapies to prevent the development of CRPC following ADT. Full article
Show Figures

Figure 1

Figure 1
<p>The hierarchical clustering and principal component analysis (PCA) of 190 significantly differentially expressed genes in 20 matched Pre-ADT biopsies and Post-ADT radical prostatectomies (RPs). (<b>A</b>) Clustering reveals two groups of Post-ADT RPs displaying segregated based on the expression of upregulated and downregulated genes (high- or low-impact groups, respectively); (<b>B</b>) Volcano plot highlighting 190 significantly differentially expressed genes; (<b>C</b>) PCA reveals 4 post-ADT RP samples as not clustering with either the high or low impact groups; (<b>D</b>) Boxplot depicting KLK3 expression in counts per million mapped reads demonstrates that the decrease in the KLK3 expression is significantly more pronounced in the high impact group than in the low impact group.</p>
Full article ">Figure 2
<p>Divergent expression of the PCS1 genes in the high impact group and common loss of PCS2 and PCS3 after ADT. (<b>A</b>) The bar plots depict three stacked bars. Each bar displays the fraction of the subtype-specific genes expressed in a given subtype that is more than two-fold above the median across all samples. Both the high and low impact groups lose the expression of the PCS2 genes after ADT, but the high impact group samples display a retention and increase in the PCS1 signature after ADT, while the low impact group loses the PCS1 signature but displays an increase in the PCS2 gene expression; (<b>B</b>) Plots depict the average percent change of the subtype gene expression before and after ADT. The PCS1 gene signature is significantly higher in the high impact group after ADT than in the low impact group after ADT (<span class="html-italic">p</span>-value = 1.04 × 10<sup>−3</sup> 95% CI: 30.95 to 60.71 by Mann–Whitney test).</p>
Full article ">Figure 3
<p>A flowchart depicting the how transcription factor coordinated groups (TFCGs) were identified. Expression-, motif-, and protein interaction data were used as inputs to PANDA. This was run twice using two independent expression datasets (e.g., high- and low impact expression data) to generate networks. Post-processing of the PANDA output (refer to methods) yielded edge probabilities representing the likelihood that a transcription factor targets a given gene. Next, Key TFs were found based on the criteria that a TF gains a significant number of predicted target genes in one network versus another. After determining the percentage overlap of shared predicted target genes (refer to methods), TFCGs were ascertained as groups of Key TFs that share &gt;70% of the predicted target genes.</p>
Full article ">Figure 4
<p>The identification of TFCGs in the high impact group network. The heatmap displays the hierarchical clustering of putative gene target percentage overlap of one Key TF as compared to all others. The dark blue to dark red color gradient denotes the degree of shared target overlap. Because the degree of target overlap between a pair of Key TFs may be non-reciprocal, the dendrograms are ordered based on mutual relationships and are oriented identically on the x- and y-axis. The diagonal represents a Key TF compared to itself. Only reciprocal relationships between groups of Key TFs were considered TFCGs (white boxes demarcate two representative TFCGs as symmetrical squares on the diagonal). Beside the heatmap are two representative TFCG schematics depicting a TFCG containing Key TFs that reciprocally share &gt;70% of their predicted target genes with each other.</p>
Full article ">
14 pages, 1678 KiB  
Article
Tumor Location Influences Oncologic Outcomes of Hepatocellular Carcinoma Patients Undergoing Radiofrequency Ablation
by Jinbin Chen, Kangqiang Peng, Dandan Hu, Jingxian Shen, Zhongguo Zhou, Li Xu, Jiancong Chen, Yangxun Pan, Juncheng Wang, Yaojun Zhang and Minshan Chen
Cancers 2018, 10(10), 378; https://doi.org/10.3390/cancers10100378 - 10 Oct 2018
Cited by 34 | Viewed by 4283
Abstract
Radiofrequency ablation (RFA) is recommended as a first-line therapy for small hepatocellular carcinoma (HCC). Tumor location is a potential factor influencing the procedure of RFA. To compare oncologic outcomes of RFA for different tumor locations, this retrospective study enrolled 194 patients with small [...] Read more.
Radiofrequency ablation (RFA) is recommended as a first-line therapy for small hepatocellular carcinoma (HCC). Tumor location is a potential factor influencing the procedure of RFA. To compare oncologic outcomes of RFA for different tumor locations, this retrospective study enrolled 194 patients with small HCC who had undertaken RFA. The HCC nodules were classified as peri-hepatic-vein (pHV) or non-pHV, peri-portal-vein (pPV) or non-pPV, and subcapsular or non-subcapsular HCC. The regional recurrence-free survival (rRFS), overall survival (OS), recurrence-free survival (recurrence in any location, RFS) and distant recurrence-free survival (dRFS) were compared. Operation failures were recorded in five pPV HCC patients, which was more frequent than in non-pPV HCC patients (p = 0.041). The 1-, 3-, and 5-year rRFS was 68.7%, 53.7%, and 53.7% for pHV patients and 85.1%, 76.1%, and 71.9% for non-pHV patients, respectively (p = 0.012). After propensity score matching, the 1-, 3-, and 5-year rRFS was still worse than that of non-pHV patients (p = 0.013). The OS, RFS, and dRFS were not significantly different between groups. Conclusions: A pHV location was a risk factor for the regional recurrence after RFA in small HCC patients. The tumor location may not influence OS, RFS, and dRFS. Additionally, a pPV location was a potential high-risk factor for incomplete ablation. Full article
Show Figures

Figure 1

Figure 1
<p>Flow diagram of patients identified, included, and excluded. RAF: Radiofrequency ablation; HCC: Hepatocellular carcinoma.</p>
Full article ">Figure 2
<p>Kaplan–Meier curves comparing recurrence and overall survival from different groups. (<b>A</b>–<b>C</b>) Comparing rRFS between non-pHV and pHV (<b>A</b>), non-pPV and pPV (<b>B</b>), subcapsular and non-subcapsular (<b>C</b>) HCCs; (<b>D</b>–<b>F</b>) comparing OS between non-pHV and pHV (<b>D</b>), non-pPV and pPV (<b>E</b>), subcapsular and non-subcapsular (<b>F</b>) HCCs; (<b>G</b>–<b>I</b>) comparing RFS between non-pHV and pHV (<b>G</b>), non-pPV and pPV (<b>H</b>), subcapsular and non-subcapsular (<b>I</b>) HCCs; (<b>J</b>–<b>L</b>) comparing dRFS between non-pHV and pHV (<b>J</b>), non-pPV and pPV (<b>K</b>), subcapsular and non-subcapsular (<b>L</b>) HCCs. pHV: peri-hepatic vein; pPV: peri-portal-vein; HCC, hepatocellular carcinoma; rRFS: regional recurrence-free survival; OS: overall survival; RFS: recurrence-free survival; dRFS, distant recurrence-free survival.</p>
Full article ">Figure 3
<p>Kaplan–Meier curves comparing rRFS. (<b>A</b>) between HCCs smaller than 3 cm and 3–5 cm; (<b>B</b>) between initially diagnosed HCCs and recurrent HCCs; (<b>C</b>–<b>F</b>) between non-pHV and pHV HCCs in stratified subgroups; (<b>C</b>) HCCs between 3 and 5 cm; (<b>D</b>) HCCs smaller than 3 cm; (<b>E</b>) initially diagnosed HCCs; (<b>F</b>) recurrent HCCs. rRFS: regional recurrence-free survival; HCC: hepatocellular carcinoma; pHV: peri-hepatic vein.</p>
Full article ">Figure 4
<p>Kaplan–Meier curves comparing rRFS between non-pHV and pHV HCC patients after propensity score-match. (<b>A</b>) For all cases; (<b>B</b>) For HCCs smaller than 3 cm; (<b>C</b>) For initially diagnosed HCCs. rRFS: regional recurrence-free survival; HCC: hepatocellular carcinoma; pHV: peri-hepatic vein.</p>
Full article ">
16 pages, 2657 KiB  
Article
Classification of Cells in CTC-Enriched Samples by Advanced Image Analysis
by Sanne De Wit, Leonie L. Zeune, T. Jeroen N. Hiltermann, Harry J. M. Groen, Guus Van Dalum and Leon W. M. M. Terstappen
Cancers 2018, 10(10), 377; https://doi.org/10.3390/cancers10100377 - 10 Oct 2018
Cited by 34 | Viewed by 5485
Abstract
In the CellSearch® system, blood is immunomagnetically enriched for epithelial cell adhesion molecule (EpCAM) expression and cells are stained with the nucleic acid dye 4′6-diamidino-2-phenylindole (DAPI), Cytokeratin-PE (CK), and CD45-APC. Only DAPI+/CK+ objects are presented to the operator to identify circulating tumor [...] Read more.
In the CellSearch® system, blood is immunomagnetically enriched for epithelial cell adhesion molecule (EpCAM) expression and cells are stained with the nucleic acid dye 4′6-diamidino-2-phenylindole (DAPI), Cytokeratin-PE (CK), and CD45-APC. Only DAPI+/CK+ objects are presented to the operator to identify circulating tumor cells (CTC) and the identity of all other cells and potential undetected CTC remains unrevealed. Here, we used the open source imaging program Automatic CTC Classification, Enumeration and PhenoTyping (ACCEPT) to analyze all DAPI+ nuclei in EpCAM-enriched blood samples obtained from 192 metastatic non-small cell lung cancer (NSCLC) patients and 162 controls. Significantly larger numbers of nuclei were detected in 300 patient samples with an average and standard deviation of 73,570 ± 74,948, as compared to 359 control samples with an average and standard deviation of 4191 ± 4463 (p < 0.001). In patients, only 18% ± 21% and in controls 23% ± 15% of the nuclei were identified as leukocytes or CTC. Adding CD16-PerCP for granulocyte staining, the use of an LED as the light source for CD45-APC excitation and plasma membrane staining obtained with wheat germ agglutinin significantly improved the classification of EpCAM-enriched cells, resulting in the identification of 94% ± 5% of the cells. However, especially in patients, the origin of the unidentified cells remains unknown. Further studies are needed to determine if undetected EpCAM+/DAPI+/CK-/CD45- CTC is present among these cells. Full article
(This article belongs to the Special Issue Circulating Tumor Cells (CTCs))
Show Figures

Figure 1

Figure 1
<p>ACCEPT identification of nucleated cells. The three scatter plots in panels (<b>a</b>–<b>c</b>) were used to define nucleated cells (depicted in blue) by ACCEPT. In total, 104,504 events were detected and 107,431 of them were classified as nucleated cells, whereas the other events are depicted as grey dots. The division into single cells, doublets, small, and large clusters was based on DNA perimeter to area ratio, as illustrated in panel (<b>b</b>). In the scatter plot in panel (<b>c</b>), the mean fluorescence intensity of Cytokeratin (CK)-phycoerythrin (PE) (CK mean intensity) is plotted against the mean fluorescence intensity of CD45-allophycocyanin (APC) (CD45 mean intensity). In panels (<b>d</b>–<b>g</b>) typical examples of the segmentation (red line) around the nucleus of a single cell are illustrated in panel (<b>d</b>); of a doublet in panel (<b>e</b>); a small cluster in panel (<b>f</b>); and a large cluster in panel (<b>g</b>). The white scale bar represents 10 pixels, which corresponds to a size of 6.4 µm.</p>
Full article ">Figure 2
<p>Frequency distribution of the cell populations detected in CellSearch<sup>®</sup> and with the addition of the CD16 classification after epithelial cell adhesion molecule (EpCAM) immunomagnetic enrichment of 300 blood samples from 192 non-small cell lung cancer (NSCLC) patients (filled circle) and 127 blood samples from 20 healthy volunteers (open diamond). Healthy volunteer samples spiked with cell line cells (<span class="html-italic">n</span> = 88) are indicated with an open square. Cell populations: All nucleated cells (grey), circulating tumor cells (CTC) (green), CD45+ leukocytes (brown), CD45+/CD16- leukocytes (red), CD45-/CD16+ leukocytes (yellow), CD45+/CD16+ leukocytes (orange), and unidentified cells (blue). The differences in cell count between the NSCLC patients and healthy volunteers in the same cell classification is significant for all subclasses (<span class="html-italic">p</span> &lt; 0.001). Samples from healthy volunteers were not spiked (diamond symbol, <span class="html-italic">n</span> = 39; median 0 CTC) or spiked (square symbol) with cancer cell lines PC3 (<span class="html-italic">n</span> = 47; median 63 CTC; 1.0 × 10<sup>4</sup> EpCAM antigens) and NCI-H460 (<span class="html-italic">n</span> = 41; median 1 CTC; 1.4 × 10<sup>2</sup> EpCAM antigens).</p>
Full article ">Figure 3
<p>Cell population distribution in (<b>a</b>) patients and (<b>b</b>) controls using the CellSearch definition (<b>upper</b>) and using CD16 expression (<b>lower</b>) for further classification of the cells.</p>
Full article ">Figure 4
<p>ACCEPT gallery showing cells from all classifications using the presence or absence of several markers. The scale bar is 10 pixels, representing 6.4 µm.</p>
Full article ">Figure 5
<p>Improved identification of cells by comparison of cell population distributions analyzed with the mercury arc light source in CellSearch (<b>left</b>), followed by analysis with a LED light source on a separate microscope (<b>right</b>).</p>
Full article ">Figure 6
<p>Distribution of cell populations in samples with wheat germ agglutinin (wga)-AlexaFluor488 staining (<span class="html-italic">n</span> = 10). The stacked bar represents the five cell populations present in these cartridges. One healthy volunteer sample was spiked with MCF-7 cancer cells, which are represented in the “CTC” category (6%). Of each population, the percentage of cells that stained positive for wga is displayed on the right side of the image, whereas the population remaining unstained with wga is visualized in grey.</p>
Full article ">
15 pages, 666 KiB  
Review
Molecular Markers of Anticancer Drug Resistance in Head and Neck Squamous Cell Carcinoma: A Literature Review
by Sandra López-Verdín, Jesús Lavalle-Carrasco, Ramón G. Carreón-Burciaga, Nicolás Serafín-Higuera, Nelly Molina-Frechero, Rogelio González-González and Ronell Bologna-Molina
Cancers 2018, 10(10), 376; https://doi.org/10.3390/cancers10100376 - 10 Oct 2018
Cited by 36 | Viewed by 5509
Abstract
This manuscript provides an update to the literature on molecules with roles in tumor resistance therapy in head and neck squamous cell carcinoma (HNSCC). Although significant improvements have been made in the treatment for head and neck squamous cell carcinoma, physicians face yet [...] Read more.
This manuscript provides an update to the literature on molecules with roles in tumor resistance therapy in head and neck squamous cell carcinoma (HNSCC). Although significant improvements have been made in the treatment for head and neck squamous cell carcinoma, physicians face yet another challenge—that of preserving oral functions, which involves the use of multidisciplinary therapies, such as multiple chemotherapies (CT) and radiotherapy (RT). Designing personalized therapeutic options requires the study of genes involved in drug resistance. This review provides an overview of the molecules that have been linked to resistance to chemotherapy in HNSCC, including the family of ATP-binding cassette transporters (ABCs), nucleotide excision repair/base excision repair (NER/BER) enzymatic complexes (which act on nonspecific DNA lesions generated by gamma and ultraviolet radiation by cross-linking and forming intra/interchain chemical adducts), cisplatin (a chemotherapeutic agent that causes DNA damage and induces apoptosis, which is a paradox because its effectiveness is based on the integrity of the genes involved in apoptotic signaling pathways), and cetuximab, including a discussion of the genes involved in the cell cycle and the proliferation of possible markers that confer resistance to cetuximab. Full article
(This article belongs to the Special Issue Cancer Chemoresistance)
Show Figures

Figure 1

Figure 1
<p>The principal molecular markers according to drug resistance mechanism-based groups in head and neck squamous cell carcinomas (HNSCCs). (<b>1</b>) Reduced concentration of antineoplastic drugs in cancerous cells. The family of ATP-binding cassette (ABC) transporters mostly includes P-glycoproteins (P-gp), which intracellularly bind to cytostatic agents and promote their exocytosis via ATP hydrolysis and conformational changes in the protein. Extracellularly, alterations in plasma membrane proteins may also decrease drug permeability. Expression or overexpression of the ABC genes encoding <span class="html-italic">MDR1</span>, <span class="html-italic">MRP1</span>, <span class="html-italic">MRP2</span>, and <span class="html-italic">BCRP</span> is involved in oral squamous cell carcinoma (OSCC) chemotherapeutic resistance. (<b>2</b>) Increased DNA reparation ability of tumor cells. An increase in the tolerance to DNA damage because of highly efficient DNA repair machinery may be caused by the gene encoding components of the nucleotide excision repair and base excision repair (NER and BER) complexes. Polymorphisms in DNA repair genes may be used for predicting favorable clinical results in patients with HNSCC. (<b>3</b>) Enhanced tumor survival and routes of dissemination. FasL is upregulated in cells treated with cisplatin and 5-FU, which induce programmed cell death. Alterations in the gene encoding <span class="html-italic">p53</span> silence matrix metalloproteinases (MMPs) overexpression, which has been associated with the survival and dissemination of tumors and drug resistance. (<b>4</b>) Inactivation of antineoplastic drugs. Increasing evidence suggests that EGFR ligands influence the response to EGFR-targeted therapy and might be useful as predictive biomarkers. The autocrine growth factor production might compete with blocking antibodies for binding to EGFR and thereby reduce their effectiveness.</p>
Full article ">
16 pages, 2664 KiB  
Article
Energy Stress-Mediated Cytotoxicity in Tuberous Sclerosis Complex 2-Deficient Cells with Nelfinavir and Mefloquine Treatment
by Henry D. McCann, Charlotte E. Johnson, Rachel J. Errington, D. Mark Davies, Elaine A. Dunlop and Andrew R. Tee
Cancers 2018, 10(10), 375; https://doi.org/10.3390/cancers10100375 - 10 Oct 2018
Cited by 5 | Viewed by 6569
Abstract
To find new anti-cancer drug therapies, we wanted to exploit homeostatic vulnerabilities within Tuberous Sclerosis Complex 2 (TSC2)-deficient cells with mechanistic target of rapamycin complex 1 (mTORC1) hyperactivity. We show that nelfinavir and mefloquine synergize to selectively evoke a cytotoxic response in TSC2-deficient [...] Read more.
To find new anti-cancer drug therapies, we wanted to exploit homeostatic vulnerabilities within Tuberous Sclerosis Complex 2 (TSC2)-deficient cells with mechanistic target of rapamycin complex 1 (mTORC1) hyperactivity. We show that nelfinavir and mefloquine synergize to selectively evoke a cytotoxic response in TSC2-deficient cell lines with mTORC1 hyperactivity. We optimize the concentrations of nelfinavir and mefloquine to a clinically viable range that kill cells that lack TSC2, while wild-type cells tolerate treatment. This new clinically viable drug combination causes a significant level of cell death in TSC2-deficient tumor spheroids. Furthermore, no cell recovery was apparent after drug withdrawal, revealing potent cytotoxicity. Transcriptional profiling by RNA sequencing of drug treated TSC2-deficient cells compared to wild-type cells suggested the cytotoxic mechanism of action, involving initial ER stress and an imbalance in energy homeostatic pathways. Further characterization revealed that supplementation with methyl pyruvate alleviated energy stress and reduced the cytotoxic effect, implicating energy deprivation as the trigger of cell death. This work underpins a critical vulnerability with cancer cells with aberrant signaling through the TSC2-mTORC1 pathway that lack flexibility in homeostatic pathways, which could be exploited with combined nelfinavir and mefloquine treatment. Full article
(This article belongs to the Collection Drug Resistance and Novel Therapies in Cancers)
Show Figures

Figure 1

Figure 1
<p>Mefloquine and nelfinavir synergize to kill <span class="html-italic">Tsc2</span>−/− Mouse embryonic fibroblasts (MEFs), ELT3-T3 and sporadic cancer cells. Dose response curves were performed in <span class="html-italic">Tsc2</span>+/+ and <span class="html-italic">Tsc2</span>−/− MEFs using flow cytometry to measure cell death following treatment with (<b>A</b>) nelfinavir (NFV); (<b>B</b>) mefloquine (MQ) and (<b>C</b>) combined mefloquine with a fixed concentration of 10 µM nelfinavir (MQ/NFV); (<b>D</b>) <span class="html-italic">Tsc2</span>+/+ and <span class="html-italic">Tsc2</span>−/− MEFs; (<b>E</b>) ELT3-T3 and ELT3-V3; (<b>F</b>) MCF7, HCT116 and NCI-H460 were treated with either DMSO, etoposide (ETO), 10 µM mefloquine (MQ), 10 µM nelfinavir (NFV) or mefloquine combined with nelfinavir (MQ/NFV) for 48 h. Cells were then tested by flow cytometry and cells were separated into viable and non-viable cell populations via DRAQ7 staining. Statistical significance is shown with combination treated <span class="html-italic">Tsc2</span>−/− MEFs or the ELT3-V3 cells to their wild-type controls, and comparing single drug treatment of mefloquine and combination with the MCF7, HCT116 and NCI-H460.</p>
Full article ">Figure 2
<p>Mefloquine and nelfinavir prevents colony formation and spheroid growth. (<b>A</b>) Colony formation was tested in <span class="html-italic">Tsc2</span>−/− MEFs seeded on soft agar that were treated for 14 days with Dimethyl Sulfoxide (DMSO), 10 µM mefloquine (MQ), 10 µM nelfinavir (NFV) or in combination. Tumor diameters were measured using Image J; scale bar is 200 μm. Significance was observed when comparing combined nelfinavir and mefloquine treatment to DMSO vehicle control. (<b>B</b>) <span class="html-italic">Tsc2</span>−/− MEF spheroids were treated under the same conditions as (<b>A</b>) for 96 h. DRAQ7 was supplemented for the final 36 h to monitor cell death before images were taken and DRAQ7 fluorescence quantified. (<b>C</b>) Spheroids treated in (<b>B</b>) were re-plated onto standard tissue culture plates and grown in drug-free media. Images were taken every 24 h and the area of outgrowth calculated using Image J, scale bar is 200 μm and outgrowth area is graphed.</p>
Full article ">Figure 3
<p>Mefloquine and nelfinavir drug combination causes increased ER stress in <span class="html-italic">Tsc2</span>−/− MEFs. (<b>A</b>) <span class="html-italic">Tsc2</span>+/+ and <span class="html-italic">Tsc2</span>−/− MEFs were treated with either DMSO, 1 µM thapsigargin (TPG), 10 µM mefloquine (MQ), 10 µM nelfinavir (NFV), or mefloquine and nelfinavir combination for 6 h, where indicated. Total protein levels of TSC2, IRE1α, ATF4, CHOP, GADD34, S6K1 and β-actin and S6K1 phosphorylated at Thr389 were detected by Western blot. (<b>B</b>) <span class="html-italic">Xbp1</span> mRNA splicing was determined from the same treatments as described in (<b>A</b>). PCR products were resolved on agarose gels (unspliced = 480 bp upper band, spliced = 454 bp lower band). (<b>C</b>–<b>E</b>) <span class="html-italic">Tsc2</span>+/+ and <span class="html-italic">Tsc2</span>−/− MEFs were treated with either DMSO or mefloquine and nelfinavir combination (MQ/NFV) for 6 h before being processed for RNA sequencing. A heat map for a panel of ER stress-linked genes is shown (<b>C</b>) and are graphed in (<b>D</b>). (<b>E</b>) Differences of mRNA expression between <span class="html-italic">Tsc2</span>+/+ and <span class="html-italic">Tsc2</span>−/− MEFs treated with mefloquine and nelfinavir is shown as a volcano plot and highlights ER stress genes. (<b>F</b>) <span class="html-italic">Tsc2</span>+/+ and <span class="html-italic">Tsc2</span>−/− MEFs were treated with DMSO or mefloquine (MQ) and nelfinavir (NFV) combination for 6 h and 48 h. Total protein levels of ATF4, IRE-1α, GADD34, CHOP and β-actin were determined by Western blot.</p>
Full article ">Figure 4
<p>Mefloquine and nelfinavir drug cytotoxicity is not associated with mTORC1 hyperactivity and causes minimal autophagy inhibition. (<b>A</b>) <span class="html-italic">Tsc2</span>−/− MEFs, NCI-H460, MCF7 and HCT116 cells were pre-treated with 50 nM rapamycin (RAP) for 1 h, where indicated, before being treated with 10 μM nelfinavir (NFV) and 10 µM mefloquine (MQ) for 48 h. Cells were stained with DRAQ7 and % cell death determined using flow cytometry. (<b>B</b>) Western blotting was carried out to determine rp-S6 phosphorylation at Ser235/236 in the cells treated in (<b>A</b>) after 48 h of treatment. (<b>C</b>) <span class="html-italic">Tsc2</span>+/+ and <span class="html-italic">Tsc2</span>−/− cells were treated with DMSO, 10 µM mefloquine (MQ), 20 µM chloroquine (CQ), 10 µM mefloquine or 20 µM chloroquine combined with 10 µM nelfinavir for 3 h. Accumulation of lipidated LC3-II were analyzed by Western blot. Total protein levels of β-actin were used as a loading control.</p>
Full article ">Figure 5
<p>Mefloquine and nelfinavir combined drug treatment induces cytotoxicity via energy stress in <span class="html-italic">Tsc2</span>−/− MEFs. (<b>A</b>) The RNA sequencing data used for <a href="#cancers-10-00375-f003" class="html-fig">Figure 3</a>C−E was assessed for gene-expression of genes involved in energy homeostasis. A heatmap for a panel of energy stress-linked genes is shown. Differences of mRNA expression between <span class="html-italic">Tsc2</span>+/+ and <span class="html-italic">Tsc2</span>−/− MEFs treated with mefloquine and nelfinavir is shown as a volcano plot (<b>B</b>) and graphed (<b>C</b>). (<b>D</b>) <span class="html-italic">Tsc2</span>−/− cells were treated with DMSO, 10 μM mefloquine and 10 μM nelfinavir combination (MQ/NFV) or mefloquine/nelfinavir combination with the addition of 8 mM methyl pyruvate (MQ/NFV/MP) for 48 h. Cells were then stained with DRAQ7 and % cell death determined by flow cytometry. (<b>E</b>) <span class="html-italic">Tsc2</span>−/− were treated with either DMSO or 10 μM mefloquine and 10 μM nelfinavir combination in the presence or absence of 8 mM methyl pyruvate for 24 h and total and phosphorylated ACC and AMPK was determined by western blot. (<b>F</b>) <span class="html-italic">Tsc2</span>+/+ and <span class="html-italic">Tsc2</span>−/− cells were treated with either DMSO or 10 μM mefloquine and 10 μM nelfinavir combination in the presence or absence of 8 mM methyl pyruvate for 6 and 24 h, where indicated. Total protein levels of ACC, CHOP GADD34 and ATF4 as well as phosphorylated ACC were detected by Western blot.</p>
Full article ">
14 pages, 2374 KiB  
Article
Low PD-L1 Expression Strongly Correlates with Local Recurrence in Epstein-Barr Virus-Positive Nasopharyngeal Carcinoma after Radiation-Based Therapy
by Yu-Jen Liu, Ngan-Ming Tsang, Chuen Hsueh, Chi-Ju Yeh, Shir-Hwa Ueng, Tong-Hong Wang and Wen-Yu Chuang
Cancers 2018, 10(10), 374; https://doi.org/10.3390/cancers10100374 - 9 Oct 2018
Cited by 18 | Viewed by 3700
Abstract
The prognostic value of programmed death-ligand 1 (PD-L1) expression in nasopharyngeal carcinoma (NPC) is controversial, with previous studies showing conflicting results. Most NPCs in endemic areas are Epstein-Barr virus (EBV)-positive. Our aim was to evaluate the clinical significance of PD-L1 expression in EBV-positive [...] Read more.
The prognostic value of programmed death-ligand 1 (PD-L1) expression in nasopharyngeal carcinoma (NPC) is controversial, with previous studies showing conflicting results. Most NPCs in endemic areas are Epstein-Barr virus (EBV)-positive. Our aim was to evaluate the clinical significance of PD-L1 expression in EBV-positive NPC. We retrospectively analyzed PD-L1 expression on tumor cells (TCs) and immune cells (ICs) by immunohistochemistry in 208 EBV-positive NPC patients who underwent radiotherapy (203 with concurrent chemotherapy). The percentages of TCs and ICs expressing PD-L1 were evaluated respectively. There was a strong correlation between local recurrence and low PD-L1 expression on ICs (p = 0.0012), TCs (p = 0.013) or both (p = 0.000044), whereas all clinical parameters had no influence on local recurrence. Using multivariate analysis, low PD-L1 expression on ICs was an independent adverse prognostic factor (p = 0.0080; HR = 1.88; 95% CI = 1.18–3.00) for disease-free survival. High PD-L1 expression on both ICs and TCs was an independent favorable prognostic factor (p = 0.022; HR = 0.46; 95% CI = 0.24–0.89) for overall survival. We show for the first time that low PD-L1 expression on ICs and TCs strongly correlates with local recurrence in EBV-positive NPC patients after radiation-based therapy. A simple immunohistochemical study for PD-L1 can identify patients prone to local recurrence, and such patients might benefit from more aggressive treatment in future clinical trials. Full article
Show Figures

Figure 1

Figure 1
<p>The local recurrence rates in patients with different levels of programmed death-ligand 1 (PD-L1) expression on immune cells (ICs) and tumor cells (TCs).</p>
Full article ">Figure 2
<p>Local recurrence-free survival (LRFS) in patients with different levels of PD-L1 expression on immune cells (ICs) and tumor cells (TCs). There was significantly shorter LRFS in patients with low PD-L1 expression on ICs (<b>a</b>), TCs (<b>b</b>), or both ICs and TCs (<b>c</b>). Significantly longer LRFS was observed in patients with high PD-L1 expression on both ICs and TCs (<b>d</b>).</p>
Full article ">Figure 3
<p>Distant metastasis-free survival (DMFS) in patients with different levels of PD-L1 expression on immune cells (ICs) and tumor cells (TCs). PD-L1 expression on ICs (<b>a</b>), TCs (<b>b</b>), or both ICs and TCs (<b>c</b>,<b>d</b>) had no significant influence on DMFS.</p>
Full article ">Figure 4
<p>Disease-free survival (DFS) in patients with different levels of PD-L1 expression on immune cells (ICs) and tumor cells (TCs). Low PD-L1 expression on ICs (<b>a</b>) or both ICs and TCs (<b>c</b>) was associated with shorter DFS. PD-L1 expression on TCs (<b>b</b>) had no significant influence on DFS. High PD-L1 expression on both ICs and TCs (<b>d</b>) correlated with longer DFS.</p>
Full article ">Figure 5
<p>Overall survival (OS) in patients with different levels of PD-L1 expression on immune cells (ICs) and tumor cells (TCs). Low PD-L1 expression on ICs (<b>a</b>), TCs (<b>b</b>), or both ICs and TCs (<b>c</b>) had no significant influence on OS. High PD-L1 expression on both ICs and TCs (<b>d</b>) correlated with significantly longer OS.</p>
Full article ">Figure 6
<p>Epstein-Barr virus (EBV)-positive nasopharyngeal carcinoma (NPC) is characterized by poorly differentiated tumor cells (TCs) and many admixed immune cells (ICs) (<b>a</b>; H&amp;E stain). Nuclear EBV-encoded small RNAs (EBER) signal is present in the TCs (<b>b</b>; in situ hybridization). Also seen are examples of cases with PD-L1-low on both TCs and ICs (<b>c</b>), PD-L1-high on TCs and PD-L1-low on ICs (<b>d</b>), PD-L1-low on TCs and PD-L1-high on ICs (<b>e</b>), and PD-L1-high on both TCs and ICs (<b>f</b>). Note that TCs have much larger nuclei than the ICs have. The original magnification of all microscopic images was × 400.</p>
Full article ">
22 pages, 7908 KiB  
Article
Cytoplasmic p21 Mediates 5-Fluorouracil Resistance by Inhibiting Pro-Apoptotic Chk2
by Arnatchai Maiuthed, Chuanpit Ninsontia, Katharina Erlenbach-Wuensch, Benardina Ndreshkjana, Julienne K. Muenzner, Aylin Caliskan, Husayn Ahmed P., Chatchai Chaotham, Arndt Hartmann, Adriana Vial Roehe, Vijayalakshmi Mahadevan, Pithi Chanvorachote and Regine Schneider-Stock
Cancers 2018, 10(10), 373; https://doi.org/10.3390/cancers10100373 - 9 Oct 2018
Cited by 23 | Viewed by 6470
Abstract
The oncogenic cytoplasmic p21 contributes to cancer aggressiveness and chemotherapeutic failure. However, the molecular mechanisms remain obscure. Here, we show for the first time that cytoplasmic p21 mediates 5-Fluorouracil (5FU) resistance by shuttling p-Chk2 out of the nucleus to protect the tumor cells [...] Read more.
The oncogenic cytoplasmic p21 contributes to cancer aggressiveness and chemotherapeutic failure. However, the molecular mechanisms remain obscure. Here, we show for the first time that cytoplasmic p21 mediates 5-Fluorouracil (5FU) resistance by shuttling p-Chk2 out of the nucleus to protect the tumor cells from its pro-apoptotic functions. We observed that cytoplasmic p21 levels were up-regulated in 5FU-resistant colorectal cancer cells in vitro and the in vivo Chorioallantoic membrane (CAM) model. Kinase array analysis revealed that p-Chk2 is a key target of cytoplasmic p21. Importantly, cytoplasmic form of p21 mediated by p21T145D transfection diminished p-Chk2-mediated activation of E2F1 and apoptosis induction. Co-immunoprecipitation, immunofluorescence, and proximity ligation assay showed that p21 forms a complex with p-Chk2 under 5FU exposure. Using in silico computer modeling, we suggest that the p21/p-Chk2 interaction hindered the nuclear localization signal of p-Chk2, and therefore, the complex is exported out of the nucleus. These findings unravel a novel mechanism regarding an oncogenic role of p21 in regulation of resistance to 5FU-based chemotherapy. We suggest a possible value of cytoplasmic p21 as a prognosis marker and a therapeutic target in colorectal cancer patients. Full article
Show Figures

Figure 1

Figure 1
<p>Susceptibility of colorectal cancer cell lines towards 5FU treatment and p21 expression in 5FU-resistant cells. Effects of 5FU on cell viability of (<b>a</b>) HCT116 (<b>b</b>) SW837 and (<b>c</b>) HT29 cells. Cells were treated with various concentrations of 5FU (0–100 μM) for 48 h. The percentage of cell viability was determined by the MTT assay. Values represent means ± SD of three independent experiments. * <span class="html-italic">p</span> &lt; 0.05 versus non-treated control. Effects of 5FU on cell apoptosis of (<b>d</b>) HCT116 (<b>e</b>) HT29 and (<b>f</b>) SW837 cells. Cells were treated with 25 μM or 100 μM of 5FU for 48 h. Apoptotic cell death was determined by Annexin-PI co-staining and fluorescent signals were analyzed by flow cytometry. UL: upper left (necrosis), LL: lower left (vital), LR: lower right (apoptosis), UR: upper right (late apoptosis). (<b>g</b>) The expression level of p21 in 5FU-resistant cells was determined by Western Blot analysis in three colorectal cancer cell lines. Cells were treated with various concentrations of 5FU for 48 h. After incubation, dead cells were discarded by washing the plates 3 times with PBS, and the remaining resistant cells were collected to prepare protein lysates as mentioned in the Material and Methods section. The blots were re-probed with GAPDH to confirm equal loading of the samples.</p>
Full article ">Figure 2
<p>Localization of p21 in 5FU-resistant HCT116 cells. (<b>a</b>) HCT116 cells were treated with various concentrations of 5FU for 48 h and the expression of p21 was determined by immunofluorescence staining using mouse anti-p21 monoclonal antibodies followed by an Alexa Fluor 555-labeled secondary antibody to visualize p21 expression (red) and the nuclei (Hoechst 33342, blue). Scale bar: 50 μm. (<b>b</b>) The expression level of phosphorylated-p21 (p-p21<sup>T145</sup>) in 5FU-resistant HCT116 cells was determined by Western Blot analysis. Cells were treated with various concentrations of 5FU for 48 h. After incubation, dead cells were discarded by washing the plates 3 times with PBS and the remaining resistant cells were collected to prepare protein lysates as mentioned in the Material and Methods section. The blots were re-probed with GAPDH to confirm equal loading of the samples. (<b>c</b>) <span class="html-italic">Ex ovo</span> images and overviews of H&amp;E-stained sections of CAM micro-tumors. For this, HCT116 cells were treated with 15 μM of 5FU for 48 h. Then the 5FU-resistant HCT116 cells were subjected to the CAM. After 5 days, tumor tissues were collected, tumor size was measured, and xenografts were subjected to standard histological and immunohistochemical procedures. (<b>d</b>) H&amp;E staining and immunohistochemical staining of p21 protein in vital areas of tumor slices. (<b>e</b>) Immunoscore of p21 regarding its cytoplasmic and nuclear localization in xenografts of 5FU-treated HCT116 and control cells. *** <span class="html-italic">p</span> &lt; 0.001 versus non-treated control.</p>
Full article ">Figure 3
<p>Cytoplasmic p21 mediates 5FU resistance in colorectal cancer cells. (<b>a</b>–<b>f</b>) The expression levels of PARP, cleaved PARP (cl. PARP), phosphorylated-p21 (p-p21<sup>T145</sup>) and p21 in resistant cells (R) and dead cells (D) were determined by Western Blot analysis after 48 h of treatment with 5FU. For this, HCT116, HT29, and SW837 cells were treated with various concentrations of 5FU. After 48 h, resistant cells (R) and dead cells (D) were collected separately and protein lysates were prepared. The blots were re-probed with GAPDH to confirm equal loading of the samples. (<b>g</b>) Expression of p21 in viable and dead cells after 48 h of 5FU treatment. HCT116, HT29, and SW837 cells were treated with various concentrations of 5FU for 48 h and the expression levels of p21 were determined by immunofluorescence staining for p21 (red) and the cell nuclei (Hoechst 33342, blue). White arrow indicates apoptotic cells having condensed chromatin and/or fragmented nuclei. Scale bar: 50 μm. (<b>h</b>) 5FU susceptibility of HCT116 cells transfected with hyperphosphorylated p21<sup>T145D</sup> and unphosphorylatable p21<sup>T145A</sup>. After 24 h of transfection, cells were treated with 5FU (25 μM) for further 48 h. Untreated cells were used as controls. The expression levels of PARP, cleaved PARP (cl. PARP), and p21 were determined by Western Blot analysis. The blots were re-probed with GAPDH to confirm equal loading of the samples.</p>
Full article ">Figure 4
<p>Susceptibility of HCT116 wild-type (HCT116) and HCT116 p21 knockout (p21−/−) colorectal cancer cell lines towards 5FU treatment. (<b>a</b>) Effects of 5FU (10 μM) on the induction of apoptosis and necrosis in HCT116 and p21−/− cells after 48 h of incubation as assessed by the Annexin-PI assay. The experiment was carried out in technical and biological duplicate. One representative experiment is shown. (<b>b</b>) Fractions of live, early-apoptotic, late-apoptotic and necrotic cells in 5FU-treated and control HCT116 and p21−/− cell populations as determined from the Annexin-PI assay after 48 h of incubation. Values of one representative experiment are shown. (<b>c</b>) Cell viability of HCT116 and p21−/− cells after treatment with 5FU (10 μM) for 24 h and 48 h with respect to DMSO controls. Values represent means ± SD of three independent experiments. ** <span class="html-italic">p</span> &lt; 0.01.</p>
Full article ">Figure 5
<p>p21 inhibits pro-apoptotic effect of Chk2. (<b>a</b>,<b>b</b>) Expression levels of phospho-proteins in transfected cells. HCT116 cells were transfected with hyperphosphorylated p21<sup>T145D</sup>. After 48 h of transfection, cells lysates were prepared and subjected to the Human Phospho-Kinase Array Kit (R&amp;D systems). The expression levels of phosphorylated Chk2 (p-Chk2<sup>T68</sup>) and Chk2 in 5FU-resistant HCT116 (<b>c</b>), HT29 (<b>d</b>), and SW837 (<b>e</b>) cells were determined by Western Blot. (The same lysates were loaded on two different membranes for Chk2 and pChk2 detection). For this, cells were treated with various concentrations of 5FU for 48 h. Dead cells were removed by washing with PBS and the remaining viable cells were collected to prepare protein lysates as mentioned in the Material and Methods sections. The blots were re-probed with GAPDH to confirm equal loading of the samples. (<b>f</b>) The expression levels of phosphorylated Chk2 (p-Chk2<sup>T68</sup>), Chk2, and p-E2F1 in HCT116 cells transfected with hyperphosphorylated p21<sup>T145D</sup> and unphosphorylatable p21<sup>T145A</sup> in response to 5FU treatment were determined by Western Blot analysis. After 24 h transfection, cells were left untreated or were treated with 5FU (25 μM) for further 48 h. Dead cells were removed by washing with PBS and the remaining viable cells were collected to prepare protein lysates. The expression of p-E2F1, p-Chk2<sup>T68</sup> and Chk2 were determined and the blots were re-probed with GAPDH to confirm equal loading of the samples. Immunohistochemical staining of p-chk2<sup>T68</sup> in CAM xenografts formed by HCT116 control (<b>g</b>) and HCT116 5FU-treated (<b>h</b>) cells. (<b>i</b>) p-chk2<sup>T68</sup> immunoscore in cytoplasmic and nuclear localizations in tumors of the HCT116 5FU-treated and untreated groups. * <span class="html-italic">p</span> &lt; 0.05 versus non-treated control.</p>
Full article ">Figure 6
<p>Co-localization of p21 and p-Chk2<sup>T68</sup>/Chk2 in 5FU-resistant cells. (<b>a</b>,<b>b</b>) HT29, (<b>c</b>) HCT116 and (<b>d</b>) SW837 cells were treated with various concentrations of 5FU for 48 h and the expression of p21 and p-Chk2<sup>T68</sup> was examined by immunofluorescence staining using mouse anti-p21 monoclonal antibodies followed by an Alexa Fluor 555-labeled secondary antibody to visualize p21 expression (red), rabbit anti-p-Chk2<sup>T68</sup> monoclonal antibodies followed by an Alexa Fluor 488-labeled secondary antibody to visualize p-Chk2<sup>T68</sup> expression (green) and cell nuclei (Hoechst 33342, blue). (<b>a</b>) Enlarged images of p21 and p-Chk2T68 co-localization in 5FU-resistant HT29 cells. Scale bar: 50 μm; (<b>e</b>) HCT116 cells were treated with 100 μM 5FU for 48 h and the expression of p21 and Chk2 was examined by immunofluorescence staining using mouse anti-p21 monoclonal antibodies followed by an Alexa Fluor 555-labeled secondary antibody to visualize p21 expression (red), rabbit anti-Chk2 monoclonal antibodies followed by an Alexa Fluor 488-labeled secondary antibody to visualize Chk2 expression (green) and cell nuclei (Hoechst 33342, blue). Scale bar: 50 μm; and (<b>f</b>) 2.5-fold computer-enlarged images from merge images in (<b>e</b>).</p>
Full article ">Figure 7
<p>Interaction between p21 and Chk2 proteins. Cells were treated with 100 μM 5FU for 48 h and the protein–protein interaction of p21-p-Chk2<sup>T68</sup> was analyzed by proximity ligation assay (HT29) (red signals indicate the protein–protein interaction between p21 and p-Chk2<sup>T68</sup>. (<b>a</b>) Fluorescence images of untreated control HT29 cells (40× magnification) and 5FU-treated HT29 cells (40× and 100× magnification) (scale bar: 50 μm); (<b>b</b>) confocal images. (<b>c</b>) 5FU-treated HCT116 cell lysates were prepared and immunoprecipitated with an anti-p-chk2<sup>T68</sup> antibody. The resulting immune complexes were then analyzed for p21 by Western Blot using an anti-p21 antibody. (<b>d</b>) Complex of p21 and Chk2 obtained by structural modelling; p21 (cyan) was modelled using two PDB structures 4I58 and 5EOU as templates using MODELLER [<a href="#B39-cancers-10-00373" class="html-bibr">39</a>]. Chk2 (magenta) was obtained from its crystal structure 2WTC after removing the coordinates of the inhibitor. The structures were energy-minimized and docked using ClusPro [<a href="#B40-cancers-10-00373" class="html-bibr">40</a>] and rendered using Chimera [<a href="#B40-cancers-10-00373" class="html-bibr">40</a>]. (<b>e</b>) Complex of phosphorylated p21 and Chek2: the energy-minimized stable structure of p21 (cyan) was phosphorylated at Threonine residue at position 145 using Chimera [<a href="#B41-cancers-10-00373" class="html-bibr">41</a>] and was docked with the structural model of Chek2 (magenta) using ClusPro [<a href="#B40-cancers-10-00373" class="html-bibr">40</a>]. The nuclear localization signal (NLS) region of Chk2 is shown in red. The insert shows the phosphorylation of T145 of p21 in the model. The interactions between the proteins were identified using the Protein Interaction Calculator (PIC) [<a href="#B42-cancers-10-00373" class="html-bibr">42</a>]. (<b>f</b>) Complex of p21 and phosphorylated Chk2: the energy-minimized stable structure of Chk2 (magenta) was phosphorylated at Threonine residue at position 68 using Chimera [<a href="#B41-cancers-10-00373" class="html-bibr">41</a>] and was docked with the structural model of p21 (cyan) using ClusPro [<a href="#B40-cancers-10-00373" class="html-bibr">40</a>]. The NLS region of Chk2 is shown in red and the residues around and in the NLS are labelled. The insert shows the phosphorylation of T68 of Chk2 in the model. The interactions between the proteins were identified using the PIC [<a href="#B42-cancers-10-00373" class="html-bibr">42</a>]. (<b>g</b>) Complex of phosphorylated p21 (T145) and phosphorylated Chek2 (T68): individual structural models of p21 phosphorylated at T145 and Chek2 phosphorylated at T68 were docked using ClusPro [<a href="#B40-cancers-10-00373" class="html-bibr">40</a>] and rendered using Chimera [<a href="#B41-cancers-10-00373" class="html-bibr">41</a>]. The NLS of Chek2 is shown in red and the nuclear export signal (NES) is shown in green. The interaction profile of the p-p21/p-Chk2 complex identified by the PIC [<a href="#B42-cancers-10-00373" class="html-bibr">42</a>] shows that no amino acid in the NES region of p21 interacts with p-Chk2, hence showing that the NES is free from any interactions facilitating export of the complex to the cytoplasm.</p>
Full article ">Figure 7 Cont.
<p>Interaction between p21 and Chk2 proteins. Cells were treated with 100 μM 5FU for 48 h and the protein–protein interaction of p21-p-Chk2<sup>T68</sup> was analyzed by proximity ligation assay (HT29) (red signals indicate the protein–protein interaction between p21 and p-Chk2<sup>T68</sup>. (<b>a</b>) Fluorescence images of untreated control HT29 cells (40× magnification) and 5FU-treated HT29 cells (40× and 100× magnification) (scale bar: 50 μm); (<b>b</b>) confocal images. (<b>c</b>) 5FU-treated HCT116 cell lysates were prepared and immunoprecipitated with an anti-p-chk2<sup>T68</sup> antibody. The resulting immune complexes were then analyzed for p21 by Western Blot using an anti-p21 antibody. (<b>d</b>) Complex of p21 and Chk2 obtained by structural modelling; p21 (cyan) was modelled using two PDB structures 4I58 and 5EOU as templates using MODELLER [<a href="#B39-cancers-10-00373" class="html-bibr">39</a>]. Chk2 (magenta) was obtained from its crystal structure 2WTC after removing the coordinates of the inhibitor. The structures were energy-minimized and docked using ClusPro [<a href="#B40-cancers-10-00373" class="html-bibr">40</a>] and rendered using Chimera [<a href="#B40-cancers-10-00373" class="html-bibr">40</a>]. (<b>e</b>) Complex of phosphorylated p21 and Chek2: the energy-minimized stable structure of p21 (cyan) was phosphorylated at Threonine residue at position 145 using Chimera [<a href="#B41-cancers-10-00373" class="html-bibr">41</a>] and was docked with the structural model of Chek2 (magenta) using ClusPro [<a href="#B40-cancers-10-00373" class="html-bibr">40</a>]. The nuclear localization signal (NLS) region of Chk2 is shown in red. The insert shows the phosphorylation of T145 of p21 in the model. The interactions between the proteins were identified using the Protein Interaction Calculator (PIC) [<a href="#B42-cancers-10-00373" class="html-bibr">42</a>]. (<b>f</b>) Complex of p21 and phosphorylated Chk2: the energy-minimized stable structure of Chk2 (magenta) was phosphorylated at Threonine residue at position 68 using Chimera [<a href="#B41-cancers-10-00373" class="html-bibr">41</a>] and was docked with the structural model of p21 (cyan) using ClusPro [<a href="#B40-cancers-10-00373" class="html-bibr">40</a>]. The NLS region of Chk2 is shown in red and the residues around and in the NLS are labelled. The insert shows the phosphorylation of T68 of Chk2 in the model. The interactions between the proteins were identified using the PIC [<a href="#B42-cancers-10-00373" class="html-bibr">42</a>]. (<b>g</b>) Complex of phosphorylated p21 (T145) and phosphorylated Chek2 (T68): individual structural models of p21 phosphorylated at T145 and Chek2 phosphorylated at T68 were docked using ClusPro [<a href="#B40-cancers-10-00373" class="html-bibr">40</a>] and rendered using Chimera [<a href="#B41-cancers-10-00373" class="html-bibr">41</a>]. The NLS of Chek2 is shown in red and the nuclear export signal (NES) is shown in green. The interaction profile of the p-p21/p-Chk2 complex identified by the PIC [<a href="#B42-cancers-10-00373" class="html-bibr">42</a>] shows that no amino acid in the NES region of p21 interacts with p-Chk2, hence showing that the NES is free from any interactions facilitating export of the complex to the cytoplasm.</p>
Full article ">Figure 8
<p>Schematic model of p21/Chk2-mediated 5FU resistance. Black stars mark where experimental evidence is given, and orange star marks in silico analysis. The fate of p-Chk2 in the cytoplasm after detachment of the complex is unclear.</p>
Full article ">
15 pages, 1118 KiB  
Article
Audencel Immunotherapy Based on Dendritic Cells Has No Effect on Overall and Progression-Free Survival in Newly Diagnosed Glioblastoma: A Phase II Randomized Trial
by Johanna Buchroithner, Friedrich Erhart, Josef Pichler, Georg Widhalm, Matthias Preusser, Günther Stockhammer, Martha Nowosielski, Sarah Iglseder, Christian F. Freyschlag, Stefan Oberndorfer, Karin Bordihn, Gord Von Campe, Markus Hoffermann, Reinhard Ruckser, Karl Rössler, Sabine Spiegl-Kreinecker, Michael B. Fischer, Thomas Czech, Carmen Visus, Günther Krumpl, Thomas Felzmann and Christine Marosiadd Show full author list remove Hide full author list
Cancers 2018, 10(10), 372; https://doi.org/10.3390/cancers10100372 - 5 Oct 2018
Cited by 74 | Viewed by 6368
Abstract
Dendritic cells (DCs) are antigen-presenting cells that are capable of priming anti-tumor immune responses, thus serving as attractive tools to generate tumor vaccines. In this multicentric randomized open-label phase II study, we investigated the efficacy of vaccination with tumor lysate-charged autologous DCs (Audencel) [...] Read more.
Dendritic cells (DCs) are antigen-presenting cells that are capable of priming anti-tumor immune responses, thus serving as attractive tools to generate tumor vaccines. In this multicentric randomized open-label phase II study, we investigated the efficacy of vaccination with tumor lysate-charged autologous DCs (Audencel) in newly diagnosed glioblastoma multiforme (GBM). Patients aged 18 to 70 years with histologically proven primary GBM and resection of at least 70% were randomized 1:1 to standard of care (SOC) or SOC plus vaccination (weekly intranodal application in weeks seven to 10, followed by monthly intervals). The primary endpoint was progression-free survival at 12 months. Secondary endpoints were overall survival, safety, and toxicity. Seventy-six adult patients were analyzed in this study. Vaccinations were given for seven (3–20) months on average. No severe toxicity was attributable to vaccination. Seven patients showed flu-like symptoms, and six patients developed local skin reactions. Progression-free survival at 12 months did not differ significantly between the control and vaccine groups (28.4% versus 24.5%, p = 0.9975). Median overall survival was similar with 18.3 months (vaccine: 564 days, 95% CI: 436–671 versus control: 568 days, 95% CI: 349–680; p = 0.89, harzard ratio (HR) 0.99). Hence, in this trial, the clinical outcomes of patients with primary GBM could not be improved by the addition of Audencel to SOC. Full article
Show Figures

Figure 1

Figure 1
<p>Treatment schedule.</p>
Full article ">Figure 2
<p>Progression-free survival in days. Kaplan–Meier analysis by treatment group indicates no difference between the vaccine and the control arm (<span class="html-italic">p</span> = 0.83).</p>
Full article ">Figure 3
<p>Overall survival in days. Kaplan–Meier analysis by treatment group indicates no difference between the vaccine and the control arm (<span class="html-italic">p</span> = 0.99).</p>
Full article ">Figure 4
<p>Impact of MGMT promoter methylation status on overall survival (<b>a</b>) in the control group (<span class="html-italic">p</span> = 0.01) and (<b>b</b>) the Audencel group (<span class="html-italic">p</span> = 0.05).</p>
Full article ">
15 pages, 3539 KiB  
Article
Unliganded Progesterone Receptor Governs Estrogen Receptor Gene Expression by Regulating DNA Methylation in Breast Cancer Cells
by Gaetano Verde, Lara I. De Llobet, Roni H.G. Wright, Javier Quilez, Sandra Peiró, François Le Dily and Miguel Beato
Cancers 2018, 10(10), 371; https://doi.org/10.3390/cancers10100371 - 5 Oct 2018
Cited by 16 | Viewed by 4902
Abstract
Breast cancer prognosis and response to endocrine therapy strongly depends on the expression of the estrogen and progesterone receptors (ER and PR, respectively). Although much is known about ERα gene (ESR1) regulation after hormonal stimulation, how it is regulated in hormone-free [...] Read more.
Breast cancer prognosis and response to endocrine therapy strongly depends on the expression of the estrogen and progesterone receptors (ER and PR, respectively). Although much is known about ERα gene (ESR1) regulation after hormonal stimulation, how it is regulated in hormone-free condition is not fully understood. We used ER-/PR-positive breast cancer cells to investigate the role of PR in ESR1 regulation in the absence of hormones. We show that PR binds to the low-methylated ESR1 promoter and maintains both gene expression and DNA methylation of the ESR1 locus in hormone-deprived breast cancer cells. Depletion of PR reduces ESR1 expression, with a concomitant increase in gene promoter methylation. The high amount of methylation in the ESR1 promoter of PR-depleted cells persists after the stable re-expression of PR and inhibits PR binding to this genomic region. As a consequence, the rescue of PR expression in PR-depleted cells is insufficient to restore ESR1 expression. Consistently, DNA methylation impedes PR binding to consensus progesterone responsive elements. These findings contribute to understanding the complex crosstalk between PR and ER and suggest that the analysis of ESR1 promoter methylation in breast cancer cells can help to design more appropriate targeted therapies for breast cancer patients. Full article
(This article belongs to the Special Issue Epigenetic Influence on Cancer Metastasis and/or Treatment Resistance)
Show Figures

Figure 1

Figure 1
<p>Loss of PR reduces the <span class="html-italic">ESR1</span> expression in hormone-deprived T47D breast cancer cells. (<b>a</b>) Gene-specific mRNA expression measured by quantitative RT-PCR in T47D or PR-deficient cells (T47D-Y) (left panel<span class="html-italic">)</span> and T47D cells transduced with shRNA against PR (shPR, clone trcn0000010776) or scramble shRNA (shC) (right panel). The gene-specific expression levels were normalized to <span class="html-italic">GAPDH</span> expression and are represented as relative values in the T47D cells. <span class="html-italic">RMND1</span> was used as a PR-independent control. <span class="html-italic">PGR</span>, PR-encoding gene; <span class="html-italic">ESR1</span>, ER-encoding gene. Error bars represent the SD of three independent experiments. ** <span class="html-italic">p</span> less than or equal to 0.01, *** <span class="html-italic">p</span> less than or equal to 0.005, unpaired two-tailed Student’s <span class="html-italic">t</span>-test. (<b>b</b>) PR and ERα protein levels measured by Western blot in T47D and T47D-Y cells (left panel) and in T47D transduced with shRNA against PR (shPR; clone trcn0000010776) or scramble shRNA (shC) (right panel). α-tubulin protein was used as the loading control. The intensities of the PR and ER bands were normalized to α-tubulin and represented as the relative value in the control cells. The vertical white line depicts a removed lane between the two samples. Blots are representative of three independent experiments. (<b>c</b>) PR depletion impairs <span class="html-italic">TFF1</span> estrogen-mediated gene transcription. T47D cells, PR-deficient (T47D-Y) cells, short hairpin control (shC) and PR-depleted cells (shPR, clone trcn0000010776) were treated with estradiol (E2, 10 nM) or ethanol (vehicle) for 6 h, at which point <span class="html-italic">TFF1</span> mRNA expression was measured by quantitative RT-PCR. The <span class="html-italic">TFF1</span> gene expression was normalized to <span class="html-italic">GAPDH</span> expression and is represented as fold change relative to the vehicle (E2/vehicle). Error bars represent the standard deviation (SD) of three independent experiments. * <span class="html-italic">p</span> less than or equal to 0.05, ** <span class="html-italic">p</span> less than or equal to 0.01, unpaired two-tailed Student’s <span class="html-italic">t</span>-test.</p>
Full article ">Figure 2
<p>PR binds to the promoter and to an enhancer-like intron of the <span class="html-italic">ESR1</span> gene in hormone-deprived T47D breast cancer cells. (<b>a</b>) Screen shot from the UCSC genome browser showing the <span class="html-italic">ESR1</span> gene, the RNA reads and the ChIP-seq results from PR binding, with a peak at the gene promoter marked by polymerase 2 binding (Pol2), histone 3 trimethylated at lysine 4 (H3K4me3), low DNA methylation (5 mC) and a CpG island at the bottom. Another PR peak is found in an intronic region containing the classical enhancer epigenetic marks of the DNase hypersensitive site (DNase), histone 3 monomethylated at lysine 4 (H3K4me1) and low DNA methylation signal (5mC). The negative control immunoprecipitation is indicated by the IgG antibody. (<b>b</b>,<b>c</b>) The ChIP assay was performed with a specific antibody against PR or total rabbit IgG in T47D cells and PR-deficient cells (T47D-Y) (<b>b</b>) or PR-depleted cells (shPR, clone trcn0000010776) and control cells expressing a scrambled shRNA (shC) (<b>c</b>). Specific binding was assessed by quantitative PCR amplification of the <span class="html-italic">ESR1</span> gene promoter, an enhancer-like intronic sequence and a genomic region localized at the 3′-end of the enhancer-like intron (negative control region). Error bars represent the SD of three independent experiments. * <span class="html-italic">p</span> less than or equal to 0.05, ** <span class="html-italic">p</span> less than or equal to 0.01, *** <span class="html-italic">p</span> less than or equal to 0.005, unpaired two-tailed Student’s <span class="html-italic">t</span>-test.</p>
Full article ">Figure 3
<p>PR rescue of PR-deficient cells does not restore <span class="html-italic">ESR1</span> gene expression. (<b>a</b>) Gene-specific mRNA expression measured by quantitative RT-PCR in T47D control cells, PR-deficient cells (T47D-Y) and PR-rescue cells (T47D-Y + PR). The mRNA expression levels were normalized to <span class="html-italic">GAPDH</span> expression and are represented as values relative to the T47D cells. <span class="html-italic">PGR</span>, PR-encoding gene; <span class="html-italic">ESR1</span>, ER-encoding gene. Error bars represent the SD of three independent experiments. * <span class="html-italic">p</span> less than or equal to 0.05, ** <span class="html-italic">p</span> less than or equal to 0.01, *** <span class="html-italic">p</span> less than or equal to 0.005, unpaired two-tailed Student’s <span class="html-italic">t</span>-test. (<b>b</b>) Gene-specific protein levels measured by Western blotting in T47D control cells, T47D-Y and T47D-Y + PR cells. The lanes T47D and T47D-Y of this image are the same as in <a href="#cancers-10-00371-f001" class="html-fig">Figure 1</a>b and are shown here for comparison with T47DY +PR. Blots are representative of three independent experiments. * indicates the degradation products of PR-B isoform. (<b>c</b>) PR rescue of PR-depleted cells does not restore the estrogen-mediated gene expression. T47D, PR-deficient cells (T47D-Y) and PR-rescue (T47D-Y + PR) cells were treated with estradiol (E2, 10 nM) or ethanol (vehicle) for 6 h, at which point, TFF1 mRNA expression levels were measured by quantitative RT-PCR. Gene-specific expression levels were normalized to <span class="html-italic">GAPDH</span> expression and are represented as values relative to the vehicle (E2/vehicle). Error bars represent the SD of three independent experiments. ** <span class="html-italic">p</span> less than or equal to 0.01, unpaired two-tailed Student’s <span class="html-italic">t</span>-test.</p>
Full article ">Figure 4
<p>The loss of PR increases the DNA methylation level at the <span class="html-italic">ESR1</span> promoter. DNA methylation of the <span class="html-italic">ESR1</span> promoter and the enhancer-like intron was assessed by methylated DNA immunoprecipitation (MeDIP)-qPCR in T47D control cells, T47D-Y cells and T47D-Y cells with stable PR transfection (T47D-Y + PR) (<b>a</b>), or in T47D cells transduced with shRNA against <span class="html-italic">PR</span> (shPR; clone trcn0000010776) or scrambled shRNA (shC) (<b>b</b>). The results are represented as values relative to the control (T47D or shC). IgG, negative control for immunoprecipitation. Error bars represent the SD of three independent experiments. ** <span class="html-italic">p</span> less than or equal to 0.01, unpaired two-tailed Student’s <span class="html-italic">t</span>-test.</p>
Full article ">Figure 5
<p>DNA methylation affects PR binding to the <span class="html-italic">ESR1</span> promoter. (<b>a</b>) The high-methylated <span class="html-italic">ESR1</span> promoter, in contrast to the low-methylated intronic sequence, was only partially bound by PR in PR-rescued cells (T47D-Y + PR). ChIP assays were performed with a specific antibody against PR. Specific binding was assessed by quantitative PCR amplification of the <span class="html-italic">ESR1</span> gene promoter and an enhancer-like intronic sequence in T47D control cells, PR-deficient cells (T47D-Y) and PR-rescued cells (T47D-Y + PR). Error bars represent the SD of three independent experiments. * <span class="html-italic">p</span> less than or equal to 0.05, ** <span class="html-italic">p</span> less than or equal to 0.01, *** <span class="html-italic">p</span> less than or equal to 0.005, unpaired two-tailed Student’s <span class="html-italic">t</span>-test. (<b>b</b>) The 5-azacytidine (5-azaC) demethylated <span class="html-italic">ESR1</span> promoter. DNA methylation analysis was performed by the MeDIP-qPCR assay using T47D-Y + PR cells treated with the demethylating agent 5-azaC (5 µM) or vehicle (control). The results are represented as fold change relative to the control. Error bars represent the SD of three independent experiments. ** <span class="html-italic">p</span> less than or equal to 0.01. (<b>c</b>) The demethylating agent 5-azaC increases PR binding at the <span class="html-italic">ESR1</span> promoter in PR-rescued cells (T47D-Y + PR). ChIP was performed as in (b) using T47D-Y + PR cells treated for 112 h with the demethylating agent 5-azaC (5 µM) or vehicle (control). Error bars represent the SD of three independent experiments. <span class="html-italic">p</span> = 0.07, unpaired two-tailed Student’s <span class="html-italic">t</span>-test.</p>
Full article ">Figure 6
<p>DNA methylation impedes PR binding to progesterone-responsive elements (PREs). (<b>a</b>) Screen shot from the UCSC genome browser showing the CpG island (CpG 89) at the <span class="html-italic">ESR1</span> promoter and the positions of the canonical PREs containing a CpG (blue line) and six half-palindromic PREs with one or two neighboring CpGs (red lines). (<b>b</b>,<b>c</b>) Electrophoretic-mobility shift assay using the indicated amount of purified human PR to capture the PRE with no CpG (ACAGTTTGT; no CpG), one methylated (MetCpG) or unmethylated CpG (UnmetCpG) (ACGGTTTGT) (<b>b</b>); two methylated (MetCpGs) or two unmethylated CpGs (UnmetCpGs) (ACGGTTCGT) (<b>c</b>). Quantification of the percentage of PR binding to different probes is shown in the lower part of the gel images. Error bars represent the SD of three independent experiments. * <span class="html-italic">p</span> less than or equal to 0.05, ** <span class="html-italic">p</span> less than or equal to 0.01, unpaired two-tailed Student’s <span class="html-italic">t</span>-test. (<b>d</b>) A double-stranded oligonucleotide probe with no CpG (ACAGTTTGT) was incubated with 2.4 μg of purified human PR and analyzed by PAGE either in the absence (–) or presence (+) of 100-fold excess of unlabeled oligonucleotides containing two unmethylated (UNMET) or two methylated (MET) CpGs (ACGGTTCGT). Error bars represent the SD of three independent experiments. *** <span class="html-italic">p</span> less than or equal to 0.005, unpaired two-tailed Student’s <span class="html-italic">t</span>-test. The dashed grey line indicates that a lane between the two samples was removed.</p>
Full article ">Figure 7
<p>Model of the regulation of the <span class="html-italic">ESR1</span> gene expression and DNA methylation by PR in hormone-free breast cancer cells. In hormone-free ER+/PR+ breast cancer cells, PR binds to the low-methylated gene promoter, as well as to an enhancer-like intronic sequence of <span class="html-italic">ESR1</span>. PR binding at the gene promoter is required for maintaining <span class="html-italic">ESR1</span> transcription. In the absence of PR, DNA methylation (mC) increases at the ESR1 promoter, and ESR1 transcription is reduced. Re-expression of PR in PR-depleted cells leads to PR binding to the low-methylated enhancer-like intronic sequence, but the high level of DNA methylation (mC) at the ESR1 promoter impedes PR binding to this genomic region. Consequently, re-expression of PR in PR-depleted cells is insufficient to restore ESR1 expression.</p>
Full article ">
15 pages, 3861 KiB  
Article
Microenvironmental pH and Exosome Levels Interplay in Human Cancer Cell Lines of Different Histotypes
by Mariantonia Logozzi, Davide Mizzoni, Daniela F. Angelini, Rossella Di Raimo, Mario Falchi, Luca Battistini and Stefano Fais
Cancers 2018, 10(10), 370; https://doi.org/10.3390/cancers10100370 - 5 Oct 2018
Cited by 150 | Viewed by 7805
Abstract
Exosomes are extracellular nanovesicles primarily involved in the pathogenesis of many diseases including cancer. This study was set out from recent evidence that extracellular acidity may increase the exosome release by cancer cells. However, this preliminary evidence did not provide solid information on [...] Read more.
Exosomes are extracellular nanovesicles primarily involved in the pathogenesis of many diseases including cancer. This study was set out from recent evidence that extracellular acidity may increase the exosome release by cancer cells. However, this preliminary evidence did not provide solid information on whether the pH-dependent exosome over-release represents a common feature of all cancers. To the purpose of demonstrating that cancer acidity is a major determinant in inducing an increased exosome release by human cancer cells, we evaluated human tumor cell lines deriving from either colon, breast, prostate cancers, melanoma, or osteosarcoma. All cell lines were cultured in either the current 7.4 pH or the typical pH of cancer that is 6.5. The levels of released extracellular vesicles were measured by protein counts, nanoparticle tracking analysis (NTA), and nanoscale flow cytometry. The results showed that pH 6.5 induced a remarkable increase in exosome release, and buffering the medium significantly reduced the exosome release in all cancers. With these results, we provide, for the first time, evidence that tumor acidity and exosome levels represent common cancer phenotypes. Full article
Show Figures

Figure 1

Figure 1
<p>Protein quantification and characterization by Western blot analysis for housekeeping markers of exosomes. (<b>A</b>) Protein analysis of exosomes purified form several tumor cell lines (LNCaP, Me30966, SaOS2, SKBR3, and HCT116) cultured in both buffered and pH 6.5 conditions. Protein quantification was performed with the Bradford protein assay, and the exosomes were lysed using 3-((3-cholamidopropyl) dimethylammonio)-1-propanesulfonate (CHAPS) buffer. Means ± standard error (SE) of three different experiments are shown. The <span class="html-italic">p</span>-values were &lt;0.02 in all cellular lines cultured in pH 6.5 with respect to buffered conditions. (<b>B</b>) Western blot analyses of alpha-1,3-mannosyltransferase (ALG-2)-interacting protein X (Alix), tumor susceptibility gene 101 (Tsg101), and cluster of differentiation 81 (CD81) proteins, performed in total protein extracts of several tumor cell lines (LNCaP, Me30966, SaOS2, SKBR3, and HCT116), cultured in buffered and pH 6.5 conditions, and exosomes purified from supernatants of the same cells. * <span class="html-italic">p</span> &lt; 0.02, ** <span class="html-italic">p</span> &lt; 0.01, *** <span class="html-italic">p</span> &lt; 0.0002.</p>
Full article ">Figure 2
<p>Confocal microscopy of tumor cells cultured in buffered and pH 6.5 conditions. The cells, after being fixed in 3% paraformaledehyde, were labeled with CD63 monoclonal antibody (MEM-259), and Alexa Fluor 488 with a concentration of 1:25 for 2 h at room temperature; then, they were labeled with diamidino-2-phenylindole (DAPI) and observed with a confocal microscope. (<b>Left</b>) In upper panel, tumor cells cultured in buffered conditions labeled with CD63; in lower panel, the same cells with isotype control. (<b>Right</b>) In upper panel, tumor cells cultured in pH 6.5 conditions labeled with CD63; in lower panel, the same cells with isotype control.</p>
Full article ">Figure 3
<p>Nanoscale flow cytometry of exosomes in tumor cells cultured in buffered and pH 6.5 conditions. The cytometer was calibrated using a mixture of non-fluorescent silica beads and fluorescent (green) latex beads with sizes from 110 nm to 1300 nm. The exosome preparation derived from several tumor cell line (LNCaP, Me30966, SaOS2, SKBR3, and HCT116) supernatants cultured in different pH cell culture conditions (buffered and pH 6.5 medium) were stained with anti-CD9 and anti-CD81 antibodies and analyzed using flow cytometry. The double-positive events were then analyzed for their size, based on the calibration with beads. Cumulative data are shown of the absolute number of CD9<sup>+</sup>/CD81<sup>+</sup> exosomes of size less than 180 nm recovered from the samples at pH 6.5 as a function of those recovered from samples at pH 7.4. Data are expressed as means ± SE of three independent experiments. The <span class="html-italic">p</span>-values were &lt;0.1 in all cellular lines cultured in pH 6.5 with respect to buffered conditions. * <span class="html-italic">p</span> &lt; 0.1, ** <span class="html-italic">p</span> &lt; 0.01, *** <span class="html-italic">p</span> &lt; 0.001.</p>
Full article ">Figure 4
<p>Nanoparticle tracking analysis (NTA) quantification of exosomes released from tumor cells cultured in buffered and pH 6.5 conditions. (<b>Left</b>) NTA analysis shows concentrations of particles isolated from cells in both culture conditions. Means ± SE of three different experiments are shown. The <span class="html-italic">p</span>-values were &lt;0.1 in all cellular lines cultured in pH 6.5 with respect to buffered conditions. (<b>Right</b>) Overlay of the size, concentration, and distribution in both culture conditions. * <span class="html-italic">p</span> &lt; 0.1, ** <span class="html-italic">p</span> &lt; 0.01, *** <span class="html-italic">p</span> &lt; 0.001.</p>
Full article ">Figure 5
<p>Alkalization of the tumor environment induces a reduction of exosome release. (<b>Left</b>) NTA analysis for the distribution and concentration of the number of exosomes released by the tumor cells cultured in pH conditions ranging from 7.4 to 6.5 (i.e., 7.4, 6.9, 6.7, and 6.5). Data are expressed as means ± SE of three independent experiments. The <span class="html-italic">p</span>-value was &lt;0.0001 in all cellular lines cultured in acidic pH with respect to buffered conditions. (<b>Right</b>) NTA analysis for the distribution and concentration of the number of exosomes released by the tumor cells cultured in pH conditions ranging from 6.5 to 7.4 (i.e., 6.5, 6.7, 6.9, and 7.4). Data are expressed as means ± SE of three independent experiments. The <span class="html-italic">p</span>-value was ≤0.0001 in all cellular lines cultured in buffered conditions with respect to pH 6.5 conditions. * <span class="html-italic">p</span> &lt; 0.1, ** <span class="html-italic">p</span> &lt; 0.01, *** <span class="html-italic">p</span> &lt; 0.001, **** <span class="html-italic">p</span>&lt; 0.0001.</p>
Full article ">
18 pages, 917 KiB  
Article
Physical Activity and Gastric Cancer Risk in Patients with and without Helicobacter pylori Infection in A Korean Population: A Hospital-Based Case-Control Study
by Madhawa Neranjan Gunathilake, Jeonghee Lee, Aelee Jang, Il Ju Choi, Young-Il Kim and Jeongseon Kim
Cancers 2018, 10(10), 369; https://doi.org/10.3390/cancers10100369 - 2 Oct 2018
Cited by 13 | Viewed by 4598
Abstract
Although physical activity (PA) is beneficial for prolonging lifespan, evidence for the protective role of PA against the development of gastric cancer (GC) is not yet well established. This study assessed the association between PA and GC risk in patients with and without [...] Read more.
Although physical activity (PA) is beneficial for prolonging lifespan, evidence for the protective role of PA against the development of gastric cancer (GC) is not yet well established. This study assessed the association between PA and GC risk in patients with and without Helicobacter pylori (H. pylori) infection in a Korean population. In total, 415 GC patients and 830 controls were enrolled at the National Cancer Center, Korea. The International Physical Activity Questionnaire-Short Form was used to collect PA data. The odds ratios (ORs) and 95% confidence intervals (CIs) were estimated using unconditional logistic regression models. In the H. pylori-positive group, subjects who engaged in regular exercise showed a significantly reduced risk of GC in the entire population (OR = 0.52, 95% CI = 0.38–0.70) and in females (OR = 0.60, 95% CI = 0.21–0.64). Subjects who engaged in a high level of total PA showed a significantly reduced risk of GC relative to subjects in the lowest tertile in the fully adjusted model (OR = 0.46, 95% CI = 0.32–0.65, p-trend < 0.001). There was an inverse association between PA and GC risk in the entire population, and in the H. pylori-positive subgroup. Our data indicate the need for the promotion of all domains of PA, especially for Korean populations. Full article
(This article belongs to the Special Issue Helicobacter pylori Associated Cancer)
Show Figures

Figure 1

Figure 1
<p>Simplified flow chart for the selection of study subjects.</p>
Full article ">
17 pages, 3129 KiB  
Article
Gap Junction Intercellular Communication Positively Regulates Cisplatin Toxicity by Inducing DNA Damage through Bystander Signaling
by Sanjeevani Arora, Joshua R. Heyza, Elaine C. Chalfin, Randall J. Ruch and Steve M. Patrick
Cancers 2018, 10(10), 368; https://doi.org/10.3390/cancers10100368 - 2 Oct 2018
Cited by 29 | Viewed by 4331
Abstract
The radiation-induced bystander effect (RIBE) can increase cellular toxicity in a gap junction dependent manner in unirradiated bystander cells. Recent reports have suggested that cisplatin toxicity can also be mediated by functional gap junction intercellular communication (GJIC). In this study using lung and [...] Read more.
The radiation-induced bystander effect (RIBE) can increase cellular toxicity in a gap junction dependent manner in unirradiated bystander cells. Recent reports have suggested that cisplatin toxicity can also be mediated by functional gap junction intercellular communication (GJIC). In this study using lung and ovarian cancer cell lines, we showed that cisplatin cytotoxicity is mediated by cellular density. This effect is ablated when GJA1 or Connexin 43 (Cx43) is targeted, a gap junction gene and protein, respectively, leading to cisplatin resistance but only at high or gap junction forming density. We also observed that the cisplatin-mediated bystander effect was elicited as DNA Double Strand Breaks (DSBs) with positive H2AX Ser139 phosphorylation (γH2AX) formation, an indicator of DNA DSBs. These DSBs are not observed when gap junction formation is prevented. We next showed that cisplatin is not the “death” signal traversing the gap junctions by utilizing the cisplatin-GG intrastrand adduct specific antibody. Finally, we also showed that cells deficient in the structure-specific DNA endonuclease ERCC1-ERCC4 (ERCC1-XPF), an important mediator of cisplatin resistance, further sensitized when treated with cisplatin in the presence of gap junction forming density. Taken together, these results demonstrate the positive effect of GJIC on increasing cisplatin cytotoxicity. Full article
Show Figures

Figure 1

Figure 1
<p>Clonogenic survival after cisplatin treatment at low and high density of cells. (<b>A</b>) H1355, (<b>B</b>) H460, (<b>C</b>) H1299, (<b>D</b>) A2780. Clonogenic survival was performed at high-density and low-density cisplatin treatment as described in the methods section. Calculated IC<sub>50</sub> values are represented in each figure for each cell line. Values are represented as mean ± SEM from three independent experiments.</p>
Full article ">Figure 2
<p>Cx43 in cancer. (<b>A</b>–<b>D</b>) Cx43 expression in NSCLC and ovarian cancer cells: RNA (<b>A</b>,<b>C</b>) and protein (<b>B</b>,<b>D</b>). (<b>A</b>,<b>C</b>) Total RNA was extracted from cells and analyzed using StaRT-PCR, as described in <a href="#sec4-cancers-10-00368" class="html-sec">Section 4</a>. Each PCR was run in triplicate. The transcript levels are represented as Cx43 mRNA/10<sup>6</sup> ACTB mRNA. The values are represented as mean ± SEM from triplicate PCRs. (<b>B</b>,<b>D</b>) Whole cell lysate from the cells were probed with antibody for Cx43 with α-tubulin as a loading control. Each PCR was run in triplicate. The transcript levels are represented as Cx43 mRNA/10<sup>6</sup> ACTB mRNA. The values are represented as mean ± SEM from triplicate PCRs. (<b>E</b>) Graph indicates the frequency of <span class="html-italic">GJA1</span> somatic mutations in different cancers extracted from cancer studies in the TCGA (The Cancer Genome Atlas) (data retrieval date November 23rd 2016). Cancer abbreviations are BRCA, breast invasive carcinoma; ccRCC, clear cell Renal Cell Carcinoma; CESC, cervical squamous cell carcinoma; COAD, colorectal adenocarcinoma; LIHC, liver hepatocellular carcinoma; LUAD, Lung Adenocarcinoma; LSC, Lung Squamous Carcinoma; SKMC, cutaneous melanoma; STAD, stomach adenocarcinoma; UC, uterine carcinoma. The graph has been divided to indicate mutation frequencies in hypermutated and non-hypermutated cancer. (<b>F</b>) Survival plots indicating probability of overall survival and time to first progression in lung cancers based upon GJA1 expression in human tumors obtained from kmplotter.org.</p>
Full article ">Figure 2 Cont.
<p>Cx43 in cancer. (<b>A</b>–<b>D</b>) Cx43 expression in NSCLC and ovarian cancer cells: RNA (<b>A</b>,<b>C</b>) and protein (<b>B</b>,<b>D</b>). (<b>A</b>,<b>C</b>) Total RNA was extracted from cells and analyzed using StaRT-PCR, as described in <a href="#sec4-cancers-10-00368" class="html-sec">Section 4</a>. Each PCR was run in triplicate. The transcript levels are represented as Cx43 mRNA/10<sup>6</sup> ACTB mRNA. The values are represented as mean ± SEM from triplicate PCRs. (<b>B</b>,<b>D</b>) Whole cell lysate from the cells were probed with antibody for Cx43 with α-tubulin as a loading control. Each PCR was run in triplicate. The transcript levels are represented as Cx43 mRNA/10<sup>6</sup> ACTB mRNA. The values are represented as mean ± SEM from triplicate PCRs. (<b>E</b>) Graph indicates the frequency of <span class="html-italic">GJA1</span> somatic mutations in different cancers extracted from cancer studies in the TCGA (The Cancer Genome Atlas) (data retrieval date November 23rd 2016). Cancer abbreviations are BRCA, breast invasive carcinoma; ccRCC, clear cell Renal Cell Carcinoma; CESC, cervical squamous cell carcinoma; COAD, colorectal adenocarcinoma; LIHC, liver hepatocellular carcinoma; LUAD, Lung Adenocarcinoma; LSC, Lung Squamous Carcinoma; SKMC, cutaneous melanoma; STAD, stomach adenocarcinoma; UC, uterine carcinoma. The graph has been divided to indicate mutation frequencies in hypermutated and non-hypermutated cancer. (<b>F</b>) Survival plots indicating probability of overall survival and time to first progression in lung cancers based upon GJA1 expression in human tumors obtained from kmplotter.org.</p>
Full article ">Figure 3
<p>Clonogenic survival at high- and low-density post Cx43 knockdown. (<b>A</b>) H1355, (<b>B</b>) H460, (<b>C</b>) A2780 cells. Non-targeting siRNA transfected (siC) and siCx43 transfected cells were treated to cisplatin at high density and low density and plated for colony survival as described in the methods section. Calculated IC<sub>50</sub> values are represented in each figure for each cell line. Values are represented as mean ± SEM from three independent experiments, each plated in triplicate.</p>
Full article ">Figure 4
<p>Positive γ-H2AX foci indicating DNA DSB formation in bystander cells post-cisplatin treatment. (<b>A</b>) H1355 and (<b>B</b>) A2780 cells were divided into 2 populations—labeled with vital cell tracker dye or left unstained. Labeled cells were either treated or left untreated (control) to cisplatin (CDDP) and then mixed with unstained untreated cells and then visualized for positive γ-H2AX foci by immunostaining. Values are represented as percent above background ± S.D. from 3 independent experiments. (<b>C</b>) Representative image from H1355 cells. Left panel is without cisplatin/vehicle while right panel is cisplatin treated. Blue—DAPI, red/orange—cell tracker orange, green—γ-H2AX foci merged. (<b>D</b>,<b>E</b>) DSB formation in H1355, Cx43 knockdown cells (<b>D</b>) and cells plated at colony density (<b>E</b>). In both cases, cell were divided into 2 populations—labeled with vital cell tracker dye or left unstained. Labeled cells were either treated or left untreated (control) to cisplatin and then mixed with unstained untreated cells and then visualized for positive γ-H2AX foci by immunostaining. Values are represented as percent above background ± S.D. from 3 independent experiments.</p>
Full article ">Figure 4 Cont.
<p>Positive γ-H2AX foci indicating DNA DSB formation in bystander cells post-cisplatin treatment. (<b>A</b>) H1355 and (<b>B</b>) A2780 cells were divided into 2 populations—labeled with vital cell tracker dye or left unstained. Labeled cells were either treated or left untreated (control) to cisplatin (CDDP) and then mixed with unstained untreated cells and then visualized for positive γ-H2AX foci by immunostaining. Values are represented as percent above background ± S.D. from 3 independent experiments. (<b>C</b>) Representative image from H1355 cells. Left panel is without cisplatin/vehicle while right panel is cisplatin treated. Blue—DAPI, red/orange—cell tracker orange, green—γ-H2AX foci merged. (<b>D</b>,<b>E</b>) DSB formation in H1355, Cx43 knockdown cells (<b>D</b>) and cells plated at colony density (<b>E</b>). In both cases, cell were divided into 2 populations—labeled with vital cell tracker dye or left unstained. Labeled cells were either treated or left untreated (control) to cisplatin and then mixed with unstained untreated cells and then visualized for positive γ-H2AX foci by immunostaining. Values are represented as percent above background ± S.D. from 3 independent experiments.</p>
Full article ">Figure 5
<p>Clonogenic survival in ERCC1/XPF knockdown cells on cisplatin treatment at low and high density of cells. (<b>A</b>) A2780 and (<b>B</b>) H1299. Non-targeting siRNA (siC) and ERCC1-XPF siRNA transfected cells (siX + siE) transfected cells were treated to cisplatin at high density and low density and plated for colony survival as described in the methods section. Calculated IC<sub>50</sub> values are represented in each figure for each cell line. Values are represented as mean ± SEM from three independent experiments.</p>
Full article ">
16 pages, 1722 KiB  
Article
Molecular Scoring of Hepatocellular Carcinoma for Predicting Metastatic Recurrence and Requirements of Systemic Chemotherapy
by Naoshi Nishida, Takafumi Nishimura, Toshimi Kaido, Kosuke Minaga, Kentaro Yamao, Ken Kamata, Mamoru Takenaka, Hiroshi Ida, Satoru Hagiwara, Yasunori Minami, Toshiharu Sakurai, Tomohiro Watanabe and Masatoshi Kudo
Cancers 2018, 10(10), 367; https://doi.org/10.3390/cancers10100367 - 29 Sep 2018
Cited by 28 | Viewed by 3868
Abstract
Hepatocellular carcinoma (HCC) causes one of the most frequent cancer-related deaths; an HCC subset shows rapid progression that affects survival. We clarify molecular features of aggressive HCC, and establish a molecular scoring system that predicts metastasis after curative treatment. In total, 125 HCCs [...] Read more.
Hepatocellular carcinoma (HCC) causes one of the most frequent cancer-related deaths; an HCC subset shows rapid progression that affects survival. We clarify molecular features of aggressive HCC, and establish a molecular scoring system that predicts metastasis after curative treatment. In total, 125 HCCs were examined for TP53, CTNNB1, and TERT promoter mutation, methylation of 8 tumor suppressor genes, and 3 repetitive DNA sequences to estimate promoter hypermethylation and global hypomethylation. A fractional allelic loss (FAL) was calculated to represent chromosomal instability through microsatellite analysis. Molecular subclasses were determined using corresponding and hierarchical clustering analyses. Next, twenty-five HCC patients who underwent liver transplantation were analyzed for associations between molecular characteristics and metastatic recurrence; survival analyses were validated using a publicly available dataset of 376 HCC cases from the Cancer Genome Atlas (TCGA). An HCC subtype characterized by TP53 mutation, high FAL, and global hypomethylation was associated with aggressive tumor characteristics, like vascular invasion; CTNNB1 mutation was a feature of the less-progressive phenotype. A number of molecular risk factors, including TP53 mutation, high FAL, significant global hypomethylation, and absence of CTNNB1 mutation, were noted to predict shorter recurrence-free survival in patients who underwent liver transplantation (p = 0.0090 by log-rank test). These findings were validated in a cohort of resected HCC cases from TCGA (p = 0.0076). We concluded that molecular risks determined by common genetic and epigenetic alterations could predict metastatic recurrence after curative treatments, and could be a marker for considering systemic therapy for HCC patients. Full article
Show Figures

Figure 1

Figure 1
<p>Molecular classification of HCC based on corresponding and hierarchical clustering analyses. Members of the A1-subclass are shown in blue, A2-subclass in green, B1-subclass in red, and B2-subclass in purple. (<b>a</b>) 125 HCCs were analyzed using the corresponding analysis based on the presence or absence or the <span class="html-italic">CTNNB1</span>, <span class="html-italic">TP53</span>, and <span class="html-italic">TERT</span> promoter mutations, methylation status on 8 TSG promoters (with or without hypermethylation), methylation status on the 3 kinds of rDNAs (with or without significant hypomethylation), and FAL score (&lt;21% and ≥21%). (<b>b</b>) Hierarchical clustering analyses using x- and y-axis values of two-dimensional drawings of corresponding analysis shown in (<b>a</b>). Each subclass was determined based on the clusters.</p>
Full article ">Figure 2
<p>Heat-map of the molecular alterations and clinical background of the cases in each subclass. The black rectangle represents positive, the white represents absence, and gray shows that information is missing. <span class="html-italic">p</span>-hyper denotes promoter hypermethylation determined by methylation levels of 8 tumor suppressor genes, and S-hypo denotes significant global hypomethylation determined by methylation levels of 3 kinds of repetitive DNA sequences. <span class="html-italic">TERT</span>-p mutation, <span class="html-italic">TERT</span> promoter mutation. FAL: fractional allelic loss (%) as a representative of the degree of chromosomal alterations. Mod-poorly: moderately-poorly differentiated.</p>
Full article ">Figure 3
<p>Recurrence-free survival of HCC patients who underwent liver transplantation. The solid line represents the survival of cases with the aggressive molecular pattern (molecular risk factors ≥ 3), and the broken line represents the cases with mild molecular pattern (molecular risk factors ≤ 2). <span class="html-italic">p</span> = 0.0090 by log-rank test.</p>
Full article ">Figure 4
<p>Recurrence-free survival (<b>a</b>) and overall survival (<b>b</b>) of HCC patients who underwent liver resection. The dataset included 376 HCCs referred from the Cancer Genome Atlas (TCGA). Among these, the results of whole exome sequencing, copy number values by Affymetrix SNP6, methylation analysis by HumanMethylation450 BeadChip, and clinical data, including the survival and curability of resection, are available for 168 HCC cases. These were subjected to Kaplan-Meier analysis. Since genome-wide methylation analysis was not applicable, the number of molecular risk factors ≥2 was considered as an aggressive molecular pattern, and those with 0–1 molecular risk factor was considered as showing a mild molecular pattern. The solid and the broken lines represent the survival of cases with aggressive and mild molecular patterns, respectively. (<b>a</b>) Kaplan–Meier curve for recurrence-free survival; <span class="html-italic">p</span> = 0.0076 by log-rank test. (<b>b</b>) Kaplan–Meier curve for overall survival; <span class="html-italic">p</span> = 0.1037 by log-rank test.</p>
Full article ">
13 pages, 1055 KiB  
Review
Bipolar Tumor-Associated Macrophages in Ovarian Cancer as Targets for Therapy
by Vijayalaxmi Gupta, Fiona Yull and Dineo Khabele
Cancers 2018, 10(10), 366; https://doi.org/10.3390/cancers10100366 - 29 Sep 2018
Cited by 74 | Viewed by 7027
Abstract
Ovarian cancer, a rare but fatal disease, has been a challenging area in the field of gynecological cancer. Ovarian cancer is characterized by peritoneal metastasis, which is facilitated by a cross-talk between tumor cells and other cells in the tumor microenvironment (TME). In [...] Read more.
Ovarian cancer, a rare but fatal disease, has been a challenging area in the field of gynecological cancer. Ovarian cancer is characterized by peritoneal metastasis, which is facilitated by a cross-talk between tumor cells and other cells in the tumor microenvironment (TME). In epithelial ovarian cancer, tumor-associated macrophages (TAMs) constitute over 50% of cells in the peritoneal TME and malignant ascites, and are potential targets for therapy. Here, we review the bipolar nature of TAMs and the evolving strategies to target TAMs in ovarian cancer. Full article
(This article belongs to the Special Issue The Tumor Microenvironment of High Grade Serous Ovarian Cancer)
Show Figures

Figure 1

Figure 1
<p>The ontogeny and polarization of M1 and M2 macrophages. Tissue-resident macrophages are mainly derived from yolk sac during development. Tumor-associated macrophages (TAMs) are derived from tissue-resident macrophages, or by differentiation of monocytes from the bone marrow. TAMs are polarized into M1-like or M2-like phenotypes based on signals received from the microenvironment (TME).</p>
Full article ">Figure 2
<p>Strategies for targeting TAMs in ovarian cancer. (<b>A</b>) Block monocyte recruitment to the tumor niche. (<b>B</b>) Chemical intervention to increase M1/M2 ratio by inhibiting M2 polarization, increasing M1 polarization by using Interferon gamma (IFN-ƴ, Lipopolysaccharide (LPS)) or by repolarizing M2 to M1 by adding IFN-ƴ or regulating the Notch, NF-κB. (<b>C</b>) Inhibit immune signaling pathways on macrophages, for e.g., CSF-1, VEGFR, which promotes angiogenesis, and PD-L1, which inhibits T cell activity.</p>
Full article ">
15 pages, 20719 KiB  
Article
Oncobox Bioinformatical Platform for Selecting Potentially Effective Combinations of Target Cancer Drugs Using High-Throughput Gene Expression Data
by Maxim Sorokin, Roman Kholodenko, Maria Suntsova, Galina Malakhova, Andrew Garazha, Irina Kholodenko, Elena Poddubskaya, Dmitriy Lantsov, Ivan Stilidi, Petr Arhiri, Andreyan Osipov and Anton Buzdin
Cancers 2018, 10(10), 365; https://doi.org/10.3390/cancers10100365 - 29 Sep 2018
Cited by 25 | Viewed by 5768
Abstract
Sequential courses of anticancer target therapy lead to selection of drug-resistant cells, which results in continuous decrease of clinical response. Here we present a new approach for predicting effective combinations of target drugs, which act in a synergistic manner. Synergistic combinations of drugs [...] Read more.
Sequential courses of anticancer target therapy lead to selection of drug-resistant cells, which results in continuous decrease of clinical response. Here we present a new approach for predicting effective combinations of target drugs, which act in a synergistic manner. Synergistic combinations of drugs may prevent or postpone acquired resistance, thus increasing treatment efficiency. We cultured human ovarian carcinoma SKOV-3 and neuroblastoma NGP-127 cancer cell lines in the presence of Tyrosine Kinase Inhibitors (Pazopanib, Sorafenib, and Sunitinib) and Rapalogues (Temsirolimus and Everolimus) for four months and obtained cell lines demonstrating increased drug resistance. We investigated gene expression profiles of intact and resistant cells by microarrays and analyzed alterations in 378 cancer-related signaling pathways using the bioinformatical platform Oncobox. This revealed numerous pathways linked with development of drug resistant phenotypes. Our approach is based on targeting proteins involved in as many as possible signaling pathways upregulated in resistant cells. We tested 13 combinations of drugs and/or selective inhibitors predicted by Oncobox and 10 random combinations. Synergy scores for Oncobox predictions were significantly higher than for randomly selected drug combinations. Thus, the proposed approach significantly outperforms random selection of drugs and can be adopted to enhance discovery of new synergistic combinations of anticancer target drugs. Full article
(This article belongs to the Special Issue Drug Resistance in Cancers)
Show Figures

Figure 1

Figure 1
<p>Overall design of the study. (<b>A</b>) Adaptation of cell lines to target drugs. (<b>B</b>) Bioinformatical pipeline for finding target drugs combinations.</p>
Full article ">Figure 2
<p>Distribution of PAS values over time. (<b>A</b>) A density plot was built for each cell line for each drug and for each timepoint. Each curve shows density of Pathway Activation Strength for 378 signaling pathways. Density plots were built using Lattice R package (<b>B</b>,<b>C</b>). Standard deviation of PAS values for SKOV-3 (<b>B</b>) and NGP-127 (<b>C</b>) cells treated with target drugs for 1 to 4 months.</p>
Full article ">Figure 3
<p>Viability of SKOV-3 and NGP-127 cells treated with different concentrations of target drugs: (<b>A</b>) Akt inhibitor Afuresertib; (<b>B</b>) EGFR and ErbB inhibitor Sapitinib; (<b>C</b>) phospholipase C inhibitor U73122; and (<b>D</b>) Notch inhibitor FLI-06. Viability and IC<sub>50</sub> were measured with MTT (3-[4,5-dimethylthiazol-2-yl]-2,5-diphenyltetrazolium bromide) test.</p>
Full article ">Figure 4
<p>Examples of antagonistic (<b>A</b>), additive (<b>B</b>), and synergistic (<b>C</b>) effect of inhibitor/drug combinations. Dashed line corresponds to single drug, solid line—combination. Survival of cells, subjected to combination of drugs was normalized by viability of cells, treated with the drug used in constant concentration. For example, the viability of SKOV-3 cells subjected to Sorafenib and Afuresertib was divided by viability of SKOV-3 cells subjected to IC<sub>20</sub> of Afuresertib alone.</p>
Full article ">Figure 5
<p>Viability of naïve SKOV-3 cells treated with different combinations of target drugs: (<b>A</b>–<b>C</b>) Sunitinib, Everolimus, or Temsirolimus, respectively, in combination with Notch inhibitor FLI-06 or alone; (<b>D</b>) Pazopanib in combination with mTOR inhibitor Temsirolimus; (<b>E</b>,<b>F</b>) Sorafenib or Sunitinib, respectively, in combination with Akt inhibitor Afuresertib or alone. Dashed line corresponds to single drug, solid line—combination.</p>
Full article ">Figure 6
<p>Viability of target drug resistant SKOV-3 cells treated with different combinations of target drugs: (<b>A</b>) Sorafenib-resistant cells treated with (i) combination of Phospholipase C inhibitor U73122 and Sorafenib or (ii) Sorafenib alone; (<b>B</b>) Sunitinib-resistant cells treated with (i) combination of <span class="html-italic">EGFR</span> inhibitor Sapitinib and Sunitinib or (ii) Sunitinib alone; (<b>C</b>) Temsirolimus-resistant cells treated with (i) combination of Temsirolimus and EGFR inhibitor Sapitinib or (ii) Temsirolimus alone; (<b>D</b>) Pazopanib-resistant cells treated with (i) combination of Pazopanib and EGFR inhibitor Sapitinib or (ii) Pazopanib alone. Dashed line corresponds to single drug, solid line—combination.</p>
Full article ">Figure 7
<p>Viability of NGP-127 cells treated with different combinations of target drugs: (<b>A</b>) Sorafenib with Phospholipase C inhibitor U73122; (<b>B</b>) Pazopanib with Phospholipase C inhibitor U73122; and (<b>C</b>) NGP-127 cell lines adapted to Pazopanib and treated with (i) combination of Pazopanib and EGFR inhibitor Sapitinib or (ii) Pazopanib alone. Dashed line corresponds to single drug, solid line—combination.</p>
Full article ">Figure 8
<p>Ras pathway was hyperactivated in Sorafenib-resistant SKOV-3 cells. The pathway was visualized using Oncobox software. The pathway is shown as an interacting network, where green arrows indicate activation and red arrows indicate inhibition. Color depth of each node of the network corresponds to the logarithms of the case-to-normal (CNR) expression rate for each node, where “normal” is a geometric average between intact SKOV3 cells, the scale represents extent of up/downregulation. The molecular targets of Sorafenib and U73122 are shown by black arrows. Predicted bypass of nodes targeted by Sorafenib is shown on bold arrows.</p>
Full article ">
11 pages, 1991 KiB  
Review
Sensitization of Cancer Cells to Radiation and Topoisomerase I Inhibitor Camptothecin Using Inhibitors of PARP and Other Signaling Molecules
by Yusuke Matsuno, Mai Hyodo, Haruka Fujimori, Atsuhiro Shimizu and Ken-ichi Yoshioka
Cancers 2018, 10(10), 364; https://doi.org/10.3390/cancers10100364 - 28 Sep 2018
Cited by 21 | Viewed by 5259
Abstract
Radiation and certain anticancer drugs damage DNA, resulting in apoptosis induction in cancer cells. Currently, the major limitations on the efficacy of such therapies are development of resistance and adverse side effects. Sensitization is an important strategy for increasing therapeutic efficacy while minimizing [...] Read more.
Radiation and certain anticancer drugs damage DNA, resulting in apoptosis induction in cancer cells. Currently, the major limitations on the efficacy of such therapies are development of resistance and adverse side effects. Sensitization is an important strategy for increasing therapeutic efficacy while minimizing adverse effects. In this manuscript, we review possible sensitization strategies for radiation and anticancer drugs that cause DNA damage, focusing especially on modulation of damage repair pathways and the associated reactions. Full article
(This article belongs to the Special Issue Sensitization Strategies in Cancer Treatment)
Show Figures

Figure 1

Figure 1
<p>Model of the topoisomerase 1 reaction and its inhibition by camptothecin (CPT) and poly (ADP-ribose) polymerase (PARP) inhibitor. (<b>A</b>,<b>B</b>) Top1 cuts a single strand of DNA to relax super-coiled DNA stress (<b>A</b>). CPT blocks the ligation step and, hence, induces toxicity during the subsequent S phase in association with replication stress (<b>B</b>). (<b>C</b>) PARP inhibitor sensitizes the cell to CPT by blocking multiple steps of the repair pathway. In this cellular background, apoptosis is induced more efficiently.</p>
Full article ">Figure 2
<p>Model of checkpoint response enhancement through modulation of DNA repair pathways. (<b>A</b>,<b>B</b>) In response to double-strand breaks (DSBs), γH2AX/53BP1 foci form immediately, and are subsequently enlarged in association when the damage checkpoint response is stimulated (<b>A</b>). Under these conditions, repair factors associated with non-homologous end joining (NHEJ) accumulate at DSB sites. Stimulation of the checkpoint response increases the efficiency of apoptosis induction. By contrast, DSBs recognized by homologous recombination (HR) factors are usually not associated with the enlargement of γH2AX foci or stimulation of the damage checkpoint response (<b>B</b>).</p>
Full article ">
Previous Issue
Next Issue
Back to TopTop