[go: up one dir, main page]

Next Issue
Volume 14, March
Previous Issue
Volume 14, January


Forests, Volume 14, Issue 2 (February 2023) – 273 articles

Cover Story (view full-size image): 
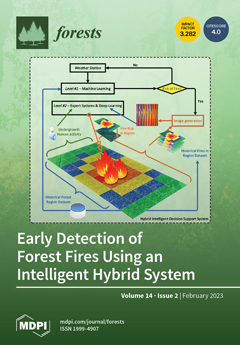
The devastating effects of forest fires highlight a global problem whose prevention demands all possible efforts. This paper proposes the design, development, and proof of concept of a new, intelligent hybrid system that allows early estimates of fire risk in a wooded area to be generated. These estimates are used for decisions by coloring, on the map of a region, the grids corresponding to each of its zones. The combination of symbolic and statistical inferential models has made it possible to formalize the available and underlying knowledge on the occurrence of fires in the study region. Thanks to this combination, and its augmented formalization capabilities, it has been possible to verify that a stochastic event such as a forest fire can be anticipated with reasonable success rates. View this paper
  • Issues are regarded as officially published after their release is announced to the table of contents alert mailing list.
  • You may sign up for e-mail alerts to receive table of contents of newly released issues.
  • PDF is the official format for papers published in both, html and pdf forms. To view the papers in pdf format, click on the "PDF Full-text" link, and use the free Adobe Reader to open them.
Order results
Result details
Section
Select all
Export citation of selected articles as:
15 pages, 4561 KiB  
Article
Habitat Suitability Evaluation of Different Forest Species in Lvliang Mountain by Combining Prior Knowledge and MaxEnt Model
by Xiaonan Zhao, Yutong Zheng, Wei Wang, Zhao Wang, Qingfeng Zhang, Jincheng Liu and Chutian Zhang
Forests 2023, 14(2), 438; https://doi.org/10.3390/f14020438 - 20 Feb 2023
Cited by 8 | Viewed by 2151
Abstract
The accurate habitat suitability evaluation of forest species is vital for forest resource management and conservation. Therefore, the previously published thresholds of soil organic carbon (SOC) contents for the six main forest species were used to screen sample points in this study; the [...] Read more.
The accurate habitat suitability evaluation of forest species is vital for forest resource management and conservation. Therefore, the previously published thresholds of soil organic carbon (SOC) contents for the six main forest species were used to screen sample points in this study; the maximum entropy modeling (MaxEnt) was applied to predict the potential distribution of those species in Lvliang Mountain, Shanxi Province, China. The following results were derived: (1) the area under the curve (AUC) value of the MaxEnt model was 0.905, indicating the model results had high accuracy; (2) the main environmental factors affecting the woodlands were mean diurnal temperature range, solar radiation, population density and slope; (3) the model accurately depicted the most suitable areas for those species, namely Populus davidiana Dode (Malpighiales: Salicaceae), Betula platyphylla Sukaczev (Fagales: Betulaceae), Quercus wutaishanica Mayr (Fagales: Fagaceae), Platycladus orientalis (L.) Franco (Pinales: Cupressaceae), Larix gmelinii (Rupr.) Kuzen. (Pinales: Pinaceae) and Pinus tabuliformis Carrière (Pinales: Pinaceae). This study has improved the representativeness of the samples based on prior knowledge to enhance the biological meaning and accuracy of the prediction results. Its findings provide a theoretical basis for the forest resource protection, management measures alongside the reconstruction of low-yield and low-efficiency forests. Full article
(This article belongs to the Section Forest Ecology and Management)
Show Figures

Figure 1

Figure 1
<p>Study area and distribution of sample sites adopted in the Maxent modeling.</p>
Full article ">Figure 2
<p>Correlations among 27 variables in <a href="#forests-14-00438-t002" class="html-table">Table 2</a>. The red color stands for positive correlations and the blue color stands for negative correlations. The stronger the correlation between variables, the darker the color and the higher the saturation and the larger the size of the circle, the greater the correlation between variables. The red fonts represent the selected variables.</p>
Full article ">Figure 3
<p>ROC curves and AUC values of the MaxEnt model.</p>
Full article ">Figure 4
<p>Jackknife test of the importance of environmental variables in MaxEnt model. The environmental variables in figure are mean diurnal temperature range (BIO2), slope (SLOPE), elevation (DEM), solar radiation (SRAD), isothermality (BIO3), population density (PD), min temperature of coldest month (BIO6), topographic wetness index (TWI), precipitation of warmest quarter (BIO18) and Per Capita GDP (GDP).</p>
Full article ">Figure 5
<p>Jackknife test of the importance of environmental variables in MaxEnt model. (<b>a</b>) Mean diurnal temperature range (BIO2); (<b>b</b>) Solar radiation (SRAD); (<b>c</b>) Slope (SLOPE); (<b>d</b>) Population density (PD).</p>
Full article ">Figure 6
<p>Map of habitat suitability of forests in Lvliang Mountain.</p>
Full article ">Figure 7
<p>Marginal probability of different forest species that meet the SOC content requirements. (<b>a</b>) <span class="html-italic">P. davidiana</span>, (<b>b</b>) <span class="html-italic">B. platyphylla</span>, (<b>c</b>) <span class="html-italic">Q. wutaishanica</span>, (<b>d</b>) <span class="html-italic">P. orientalis</span>, (<b>e</b>) <span class="html-italic">L. gmelinii</span>, (<b>f</b>) <span class="html-italic">P. tabuliformis</span>.</p>
Full article ">
24 pages, 7750 KiB  
Review
Conserving Potential and Endangered Species of Pericopsis mooniana Thwaites in Indonesia
by Julianus Kinho, Suhartati, Husna, Faisal Danu Tuheteru, Diah Irawati Dwi Arini, Moh. Andika Lawasi, Resti Ura’, Retno Prayudyaningsih, Yulianti, Subarudi, Lutfy Abdulah, Ruliyana Susanti, Totok Kartono Waluyo, Sona Suhartana, Andianto, Marfuah Wardani, Titi Kalima, Elis Tambaru, Wahyudi Isnan, Adi Susilo, Ngatiman, Laode Alhamd, Dulsalam and Soenarnoadd Show full author list remove Hide full author list
Forests 2023, 14(2), 437; https://doi.org/10.3390/f14020437 - 20 Feb 2023
Cited by 1 | Viewed by 2584
Abstract
Indonesia has around 4000 wood species, and 10% (400) of species are categorized as commercial wood. One species is kayu kuku (Pericopsis mooniana Thwaites), native to Southeast Sulawesi. This species is considered a fancy wood used for sawn timber, veneer, plywood, carving, [...] Read more.
Indonesia has around 4000 wood species, and 10% (400) of species are categorized as commercial wood. One species is kayu kuku (Pericopsis mooniana Thwaites), native to Southeast Sulawesi. This species is considered a fancy wood used for sawn timber, veneer, plywood, carving, and furniture. The high demand for wood caused excessive logging and threatened its sustainability. In addition, planting P. mooniana has presented several challenges, including seedling production, viability and germination rate, nursery technology, and silviculture techniques. As a result, the genera of Pericopsis, including P. elata (Europe), P. mooniana (Sri Lanka), and P. angolenses (Africa), have been listed in the Convention on International Trade in Endangered Species (CITES) Appendix. Based on The International Union for Conservation of Nature (IUCN) Red List of Threatened Species, P. mooniana is categorized as Vulnerable (A1cd). This conservation status has raised issues regarding its biodiversity, conservation, and sustainability in the near future. This paper aims to review the conservation of potential and endangered species of P. mooniana and highlight some efforts for its species conservation and sustainable use in Indonesia. The method used is a systematic literature review based on P. mooniana’s publication derived from various reputable journal sources and additional literature sources. The results revealed that the future demand for P. mooniana still increases significantly due to its excellent wood characteristics. This high demand should be balanced with both silviculture techniques and conservation efforts. The silviculture of P. mooniana has been improved through seed storage technology, improved viability and germination rates, proper micro and macro propagation, applying hormones, in vitro seed storage, improved nursery technology, and harvesting techniques. P. mooniana conservation can be conducted with both in situ and ex situ conservation efforts. In situ conservation is carried out by protecting its mother trees in natural conditions (i.e., Lamedae Nature Reserve) for producing good quality seeds and seedlings. Ex situ conservation is realized by planting seeds and seedlings to produce more wood through rehabilitating and restoring critical forests and lands due to its ability to adapt to marginal land and mitigate climate change. Other actions required for supporting ex situ conservation are preventing illegal logging, regeneration, conservation education, reforestation, agroforestry system applied in private and community lands, and industrial forest plantations. Full article
(This article belongs to the Special Issue Biodiversity and Conservation of Forests)
Show Figures

Figure 1

Figure 1
<p>Stages in conducting the review.</p>
Full article ">Figure 2
<p>Picture of <span class="html-italic">P. mooniana</span>, natural stands (<b>A</b>); flowering twigs, flower parts, and pods (<b>B</b>); fruit morphology (<b>C</b>,<b>D</b>) [<a href="#B4-forests-14-00437" class="html-bibr">4</a>,<a href="#B20-forests-14-00437" class="html-bibr">20</a>].</p>
Full article ">Figure 3
<p>Distribution map of <span class="html-italic">P. mooniana</span> in Indonesia.</p>
Full article ">Figure 4
<p>Visualization of growth performance of mycorrhizal and non-mycorrhizal <span class="html-italic">P. mooniana</span> at greenhouse and nursery scales. (<b>A</b>) Coal overburden (OB) media [<a href="#B90-forests-14-00437" class="html-bibr">90</a>], (<b>B</b>) gold tailings media [<a href="#B83-forests-14-00437" class="html-bibr">83</a>], (<b>C</b>) serpentine soil media/post-nickel mining [<a href="#B87-forests-14-00437" class="html-bibr">87</a>], and (<b>D</b>) serpentine soil media [<a href="#B2-forests-14-00437" class="html-bibr">2</a>].</p>
Full article ">Figure 5
<p>Visualization of growth performance of <span class="html-italic">P. mooniana</span> with and without mycorrhizal in a post-nickel field at 12 months (<b>A</b>) and a post-gold mine at four months after planting (<b>B</b>) (Photo: F.D. Tuheteru and Husna, 2022).</p>
Full article ">Figure 6
<p>Visualization of root nodules of <span class="html-italic">P. mooniana</span> plant mycorrhizal (<b>A</b>,<b>B</b>) and non-mycorrhizal (<b>C</b>) [<a href="#B2-forests-14-00437" class="html-bibr">2</a>].</p>
Full article ">Figure 7
<p><span class="html-italic">P. mooniana</span> wood in macroscopic section, reproduced with permission from Krisdianto and Dewi [<a href="#B124-forests-14-00437" class="html-bibr">124</a>].</p>
Full article ">Figure 8
<p>Wood product of <span class="html-italic">P. mooniana</span> from Southeast Sulawesi, Indonesia (Photo: F.D. Tuheteru, 2023).</p>
Full article ">
10 pages, 964 KiB  
Article
Specificity and Sensitivity of a Rapid LAMP Assay for Early Detection of Emerald Ash Borer (Agrilus planipennis) in Europe
by Donnie L. Peterson, Kathleen Kyle, Aurélien Sallé, Francesco Pecori, Duccio Migliorini, Alberto Santini, Nicola Luchi and Michelle Cleary
Forests 2023, 14(2), 436; https://doi.org/10.3390/f14020436 - 20 Feb 2023
Cited by 4 | Viewed by 2810
Abstract
Buprestids are an emerging threat to broadleaf forests across the world. Species such as emerald ash borer (EAB, Agrilus planipennis) seriously threaten ash (Fraxinus spp.) in North America and Europe. As it continues spreading west from European Russia, native European ash [...] Read more.
Buprestids are an emerging threat to broadleaf forests across the world. Species such as emerald ash borer (EAB, Agrilus planipennis) seriously threaten ash (Fraxinus spp.) in North America and Europe. As it continues spreading west from European Russia, native European ash populations will suffer dramatic losses. Due to their cryptic lifestyle of the egg and larval stages on developing bark and vascular tissue, buprestids and other wood borers can be difficult to detect. Early detection tools are vital to implement fast eradication measures, and prevent the establishment of invasive species populations. Detection methods using polymerase chain reaction (PCR) assays to target specific taxa can be extremely timely to obtain results especially since samples need to be transported to the laboratory first. However, loop-mediated isothermal amplification (LAMP) eDNA assays are highly specific and sensitive providing results within 30 min after sample extraction. In this study, we investigated the specificity and sensitivity of an EAB LAMP assay as an early detection tool in Europe. The assay was specific to EAB when tested against 12 European Agrilus spp., five buprestids, two Scolytinae, and five cerambycids (n = 24). The LAMP assay sensitivity amplified DNA from a concentration as low as 0.02 pg/µL. These results demonstrate that the LAMP assay is a highly specific, sensitive tool that can be used to detect and monitor EAB in European forests and urban settings. Full article
(This article belongs to the Special Issue Diagnostics of Forest Pest Insects)
Show Figures

Figure 1

Figure 1
<p>Fluorescence of EAB DNA in a 1:5 serial dilution to determine the lower detection threshold of the EAB LAMP assay.</p>
Full article ">
20 pages, 2439 KiB  
Article
Usage of and Barriers to Green Spaces in Disadvantaged Neighborhoods: A Case Study in Shi Jiazhuang, Hebei Province, China
by Chenyang Dai, Sreetheran Maruthaveeran, Mohd Fairuz Shahidan and Yichun Chu
Forests 2023, 14(2), 435; https://doi.org/10.3390/f14020435 - 20 Feb 2023
Cited by 4 | Viewed by 2554
Abstract
Studies have shown that disadvantaged neighborhoods have fewer green spaces, resources, and facilities, resulting in residents facing more barriers to using green spaces. This study aims to quantify green space usage patterns and constraints in old residential neighborhoods in a large city in [...] Read more.
Studies have shown that disadvantaged neighborhoods have fewer green spaces, resources, and facilities, resulting in residents facing more barriers to using green spaces. This study aims to quantify green space usage patterns and constraints in old residential neighborhoods in a large city in northern China. A questionnaire survey and semi-structured interviews were conducted with 668 residents. Results showed that most residents visited their local green spaces daily, often in the evenings, and spent between 30 and 60 min there. The number of visits on weekends is higher than on weekdays, with no difference in visiting alone or in groups. The main reason for visiting green spaces was to relax and enjoy nature, followed by spending time with family. Limitations to usage included poor physical environments, such as inadequate facilities, lack of maintenance, overcrowding, poor accessibility, limited activities, and pet restrictions. This study provides insights into the current state of green space utilization in old residential neighborhoods, as well as a discussion of the limitations, which could inform future renovations and designs of green spaces in these areas. Full article
(This article belongs to the Special Issue Forest, Trees, Human Health and Wellbeing)
Show Figures

Figure 1

Figure 1
<p>The location of Shijiazhuang, Hebei Province, China.</p>
Full article ">Figure 2
<p>Buildings and green spaces in old residential neighborhoods.</p>
Full article ">Figure 3
<p>Selected old residential neighborhoods as study sites in Shijiazhuang.</p>
Full article ">Figure 4
<p>The respondents’ constraints in using green spaces in an old residential neighborhoods.</p>
Full article ">
19 pages, 11987 KiB  
Article
Responses of the Distribution Pattern of the Suitable Habitat of Juniperus tibetica Komarov to Climate Change on the Qinghai-Tibet Plateau
by Huayong Zhang, Bingjian Zhao, Tousheng Huang, Hao Chen, Junjie Yue and Yonglan Tian
Forests 2023, 14(2), 434; https://doi.org/10.3390/f14020434 - 20 Feb 2023
Cited by 4 | Viewed by 1845
Abstract
Predicting the suitable habitat of plants under climate change has become a trending research topic in recent years. Juniperus tibetica Komarov (Cupressales: Cupressaceae) is a unique and vulnerable species on the Qinghai–Tibet Plateau (QTP) and the highest timberline in the Northern Hemisphere. The [...] Read more.
Predicting the suitable habitat of plants under climate change has become a trending research topic in recent years. Juniperus tibetica Komarov (Cupressales: Cupressaceae) is a unique and vulnerable species on the Qinghai–Tibet Plateau (QTP) and the highest timberline in the Northern Hemisphere. The prediction of the suitable habitat of J. tibetica will be beneficial for understanding the ecosystem of the QTP. In the present study, variations in the distribution pattern of the suitable habitats (DPSH) of J. tibetica on the QTP were investigated by MaxEnt and GIS spatial analysis based on 288 distribution records and 8 environmental factors. The environmentally abnormal areas and environmental factors determining the DPSH along with climate change were analyzed, and the most suitable climate models were evaluated. The results show that the suitable habitat of J. tibetica will migrate to higher-elevation and -latitude areas in the future. Precipitation was the most important factor affecting current suitable habitats and limiting future ones, followed by temperature. By comparing the integrality of suitable habitat under different climate models, it was suggested that the HadGEM2-ES (RCP2.6) and BCC-CSM1.1 (RCP8.5) climate models were the best for predicting the DPSH of J. tibetica. This study revealed the response of the suitable habitat of J. tibetica relative to climate change at a large scale and provides a theoretical basis for the scientific management and conservation of J. tibetica resources on the QTP. Full article
(This article belongs to the Section Forest Meteorology and Climate Change)
Show Figures

Figure 1

Figure 1
<p>Distribution points of <span class="html-italic">J. tibetica</span> on the QTP.</p>
Full article ">Figure 2
<p>Correlation of 28 environmental factors. (<b>a</b>) Correlation of environment factors; (<b>b</b>) Correlation of soil factors.</p>
Full article ">Figure 3
<p>Receiver operator characteristic (ROC) curve and model testing and training AUC values based on 10-times cross validation. (<b>a</b>) ROC curve; (<b>b</b>) Testing and training AUC values based on 10-times cross validation.</p>
Full article ">Figure 4
<p>Response curves of probability of presence for <span class="html-italic">J. tibetica</span>. (<b>a</b>) Response curve of Bio1; (<b>b</b>) response curve of Bio12; (<b>c</b>) response curve of Bio14; (<b>d</b>) response curve of Bio15; (<b>e</b>) response curve of ELE; (<b>f</b>) response curve of ASP; (<b>g</b>) response curve of Topsoil pH (H<sub>2</sub>O); (<b>h</b>) response curve of Topsoil Gravel Content.</p>
Full article ">Figure 5
<p>The suitable habitat of <span class="html-italic">J. tibetica</span> under different climate scenarios. (<b>a</b>) Suitable habitat during the LGM; (<b>b</b>) Current suitable habitat; (<b>c</b>) Suitable habitat for the BCC-CSM1.1 (RCP2.6) in 2070; (<b>d</b>) Suitable habitat for the BCC-CSM1.1 (RCP8.5) climate scenario in 2070; (<b>e</b>) Suitable habitat for the CCSM4 (RCP2.6) in 2070; (<b>f</b>) Suitable habitat for the CCSM4 (RCP8.5) in 2070; (<b>g</b>) Suitable habitat for the HadGEM2-ES (RCP2.6) in 2070; (<b>h</b>) Suitable habitat for the HadGEM2-ES (RCP8.5) in 2070.</p>
Full article ">Figure 6
<p>Changes of suitable habitat <span class="html-italic">J. tibetica</span> under different climate scenarios. (<b>a</b>) Differences between current and LGM modelled suitable habitat, including areas decreased and increased since the LGM; (<b>b</b>) Differences between BCC-CSM1.1 (RCP2.6) and current modelled suitable habitat; (<b>c</b>) Differences between BCC-CSM1.1 (RCP8.5) and current modelled suitable habitat; (<b>d</b>) Differences between CCSM4 (RCP2.6) and current modelled suitable habitat; (<b>e</b>) Differences between CCSM4 (RCP8.5) and current modelled suitable habitat; (<b>f</b>) Differences between HadGEM2-ES (RCP2.6) and current modelled suitable habitat; (<b>g</b>) Differences between HadGEM2-ES (RCP8.5) and current modelled suitable habitat.</p>
Full article ">Figure 7
<p>The distribution ellipses of suitable habitat of <span class="html-italic">J. tibetica</span> in different periods. (<b>a</b>) RCP2.6 Climate scenarios; (<b>b</b>) RCP2.6 Climate scenarios.</p>
Full article ">Figure 8
<p>The centroid of the suitable habitat of <span class="html-italic">J. tibetica</span> under different climate scenarios.</p>
Full article ">Figure 9
<p>Multivariate environmental similarity surface (MESS) for <span class="html-italic">J. tibetica</span> during different periods. (<b>a</b>) MESS for the LGM; (<b>b</b>) MESS for the BCC-CSM1.1 (RCP2.6); (<b>c</b>) MESS for the BCC-CSM1.1 (RCP8.5); (<b>d</b>) MESS for the CCSM4 (RCP2.6); (<b>e</b>) MESS for the CCSM4 (RCP8.5); (<b>f</b>) MESS for the HadGEM2-ES (RCP2.6); (<b>g</b>) MESS for the HadGEM2-ES (RCP8.5).</p>
Full article ">Figure 10
<p>The most dissimilar (MoD) variable analysis for <span class="html-italic">J. tibetica</span> during different periods. (<b>a</b>) MoD for the LGM; (<b>b</b>) MoD for the BCC-CSM1.1 (RCP2.6); (<b>c</b>) MoD for the BCC-CSM1.1 (RCP8.5); (<b>d</b>) MoD for the CCSM4 (RCP2.6); (<b>e</b>) MoD for the CCSM4 (RCP8.5); (<b>f</b>) MoD for the HadGEM2-ES (RCP2.6); (<b>g</b>) MoD for the HadGEM2-ES (RCP8.5).</p>
Full article ">
12 pages, 14728 KiB  
Article
Effects of Tool Tooth Number and Cutting Parameters on Milling Performance for Bamboo–Plastic Composite
by Meiqi Song, Dietrich Buck, Yingyue Yu, Xiaohang Du, Xiaolei Guo, Jinxin Wang and Zhaolong Zhu
Forests 2023, 14(2), 433; https://doi.org/10.3390/f14020433 - 20 Feb 2023
Cited by 10 | Viewed by 1827
Abstract
Cutting force and temperature are critical indicators for improving cutting performance and productivity. This study used an up-milling experiment to ascertain the effect of tool tooth number, cutting speed, and depth on the machinability of bamboo–plastic composite. We focused on the changes in [...] Read more.
Cutting force and temperature are critical indicators for improving cutting performance and productivity. This study used an up-milling experiment to ascertain the effect of tool tooth number, cutting speed, and depth on the machinability of bamboo–plastic composite. We focused on the changes in the resultant force and cutting temperature under different milling conditions. A response surface methodology was used to build prediction models for the resultant force and temperature. A verification test was conducted to prove the model’s reliability. The empirical findings suggested that the number of tool teeth had the most significant impacts on both the resultant force and the cutting temperature, followed by the depth of cut and the cutting speed. Moreover, the resultant force and cutting temperature showed increasing trends with decreasing numbers of tool teeth and increasing cut depths. However, cutting speed had a negative relationship with the resultant force and a positive relationship with temperature. We also determined the optimal milling conditions with the lowest force and temperature: four tool teeth, 300 m/min cutting speed, and 0.5 mm depth. This parameter combination can be used in the industrial manufacture of bamboo–plastic composite to improve tool life and manufacturing productivity. Full article
(This article belongs to the Section Wood Science and Forest Products)
Show Figures

Figure 1

Figure 1
<p>Milling experiment: (<b>a</b>) cutting tool, (<b>b</b>) cutting temperature measurement, (<b>c</b>) cutting force measurement.</p>
Full article ">Figure 2
<p>(<b>a</b>) Actual and predicted values for resultant force; (<b>b</b>) Actual and predicted values for cutting temperature.</p>
Full article ">Figure 3
<p>(<b>a</b>) Normal distributions of resultant force; (<b>b</b>) Normal distributions of cutting temperature.</p>
Full article ">Figure 4
<p>Effects of tool tooth numbers and cutting parameters on (<b>a</b>–<b>c</b>) resultant force and (<b>d</b>–<b>f</b>) temperature.</p>
Full article ">Figure 5
<p>Changes in cutting quantities under different conditions.</p>
Full article ">Figure 6
<p>Three-dimensional surface and contour maps of resultant force (<b>a</b>) tool tooth number and cutting speed, (<b>b</b>) tool tooth number and depth of cut, and (<b>c</b>) cutting speed and depth of cut.</p>
Full article ">Figure 7
<p>Three-dimensional surface and contour maps of cutting temperature (<b>a</b>) tool tooth number and cutting speed, (<b>b</b>) tool tooth number and depth of cut, and (<b>c</b>) cutting speed and depth of cut.</p>
Full article ">Figure 8
<p>Optimal milling conditions.</p>
Full article ">
15 pages, 4133 KiB  
Article
Impacts of Different Reforestation Methods on Fungal Community and Nutrient Content in an Ex-Tea Plantation
by Anjie Liang, Xinyi Wen, Wenjing Yu, Shunde Su, Yongming Lin, Hailan Fan, Jun Su and Chengzhen Wu
Forests 2023, 14(2), 432; https://doi.org/10.3390/f14020432 - 20 Feb 2023
Cited by 1 | Viewed by 2378
Abstract
Long-term monocultures of tea and the excessive use of chemical fertilizer lead to the degradation of soil quality. Improving the soil quality of ex-tea plantations through vegetation restoration is an important task. However, the changes in soil nutrients, fungal communities, and the effects [...] Read more.
Long-term monocultures of tea and the excessive use of chemical fertilizer lead to the degradation of soil quality. Improving the soil quality of ex-tea plantations through vegetation restoration is an important task. However, the changes in soil nutrients, fungal communities, and the effects of microorganisms on soil nutrients after reforestation remain unclear. Therefore, in this study, we aimed to explore the effects of Pinus and Chinese fir on soil nutrients and fungal communities in ex-tea plantation areas that were subjected to the reforestation modes of pure forest and mixed forest by measuring soil chemical properties and ITS rRNA gene sequences. The results showed that (1) after reforestation, the relative normalized difference vegetation index (NDVI) of the Mixed forest, Mixed Pine and Mixed Fir areas increased (p < 0.05) compared to that of pure forest; (2) the soil organic carbon (SOC), total nitrogen (TN), and N:P ratios of the mixed forest increased by an average of 54%, 90%, and 299% (p < 0.05) compared to pure forest, whereas the total phosphorus (TP) and available potassium (AK) decreased by an average of 39% and 89% (p < 0.05); and (3) there was no significant difference in the diversity of the fungal communities of the pure and mixed forests, but the fungal phyla Mucoromycota, Glomeromycota, and Rozellomycota were significantly different in the pure and mixed forests. This differing microbial composition led to a significant increase (p < 0.05) in symbiotrophs (ecotomycorhizal, ericoid mycorhizal) in the mixed forest, which was negatively correlated with the soil TP and positively correlated with the TN and the N:P ratio. In addition, there was also a significant decrease (p < 0.05) in complex nutrient types (ectomycorrhizal-fungal parasite-plant saprotroph-wood saprotroph), which were negatively correlated with the SOC and TN, and arbuscular mycorrhizas, which were positively correlated with the TP. Our results show that the chemical properties of soils and the structure of the fungal communities changed significantly due to the reforestation of Chinese fir and Pinus, and the mixed forest mode of reforestation was more conducive to improving the soil quality; therefore, a mixed forest of Chinese fir and Pinus can be used to improve degraded soils in ex-tea planting areas. Full article
(This article belongs to the Special Issue Detection and Mitigation of Forest Degradation and Fragmentation)
Show Figures

Figure 1

Figure 1
<p>Study site map (<b>a</b>) and layout of sampling plots (<b>b</b>). Fir, pure <span class="html-italic">C.lanceolata</span> forest; Pine, pure <span class="html-italic">Pinus</span> forest; Mixed, mixed forest of <span class="html-italic">C. lanceolata</span> and <span class="html-italic">Pinus</span>.</p>
Full article ">Figure 2
<p>Experimental plots and vegetation indexes of pure forest and mixed forest, (<b>A</b>): Fir, pure <span class="html-italic">C. lanceolata</span> forest; (<b>B</b>): Pine, pure <span class="html-italic">Pinus</span> forest; (<b>C</b>): Mixed, mixed forest of <span class="html-italic">C. lanceolata</span> and <span class="html-italic">Pinus</span>; (<b>D</b>): relative normalized difference vegetation index (NDVI) value; the NDVI values are mean values of these selected rectangles, different letters (a–c) indicate significant differences at the 0.05 level; Mied Fir: <span class="html-italic">C. lanceolata</span> in Mixed; Mixed Pine: <span class="html-italic">Pinus</span> in Mixed. The red rectangles denote Chinese fir and the black rectangles denote <span class="html-italic">Pinus</span>.</p>
Full article ">Figure 3
<p>Diversity and composition of soil fungi in pure and mixed forest. (<b>A</b>) Venn diagram of fungal OTU numbers, (<b>B</b>) principal coordinate analysis (PCoA) ordination of soil fungi, (<b>C</b>) redundancy analysis (RDA) of the fungal community structure and soil chemical properties. The red and blue arrows indicate soil chemical properties and the two most abundant fungal phyla, respectively. Soil chemical properties depicted in blue exhibited a significant correlation with fungal communities (<span class="html-italic">p</span> &lt; 0.05). (<b>D</b>) Variations in the taxonomic composition of fungal communities at the phylum level; red text represents significant differences at the 0.05 level. SOC: soil organic carbon; TN: total nitrogen; C:N: C:N ratio; N:P: N:P ratio; TP: total phosphorus; AK: available potassium.</p>
Full article ">Figure 4
<p>Fungal functional guilds and their correlation with soil chemistry. (<b>A</b>) The relative read abundance of annotated fungal functional guilds in pure and mixed forest. The guilds with a relative read abundance of &lt;1% were combined and grouped as others; letters in blue are symbiotrophs, purple are saprotrophs, green are pathotrophs, black are complex nutrient types and the red rectangles represent significant differences at the 0.05 level. (<b>B</b>) Correlation between OTUs of fungal functional guilds and soil chemical properties (<span class="html-italic">p</span> &lt; 0.05). Blue and yellow represent positive and negative differences between samples. M1: Ectomycorrhizal; M2: Ericoid mycorrhizal; M3: Lichenized; M4: Plant pathogen; M5: Animal pathogen-fungal parasite-undefined saprotroph; M6: Ectomycorrhizal-fungal parasite-plant saprotroph-wood saprotroph; M7: Endophyte-litter Saprotroph-soil saprotroph-undefined saprotroph; M8: Arbuscular mycorrhizal; M9: Wood saprotroph; SOC: soil organic carbon; TN: total nitrogen; C:N: C:N ratio; N:P: N:P ratio; TP: total phosphorus; K: available potassium (AK).</p>
Full article ">
11 pages, 4480 KiB  
Article
Tree Species Mixtures Can Improve the Water Storage of the Litter–Soil Continuum in Subtropical Coniferous Plantations in China
by Ni Ding, Yunxing Bai and Yunchao Zhou
Forests 2023, 14(2), 431; https://doi.org/10.3390/f14020431 - 20 Feb 2023
Cited by 2 | Viewed by 1704
Abstract
Increasing evidence has shown that introducing broadleaved trees into coniferous plantations can regulate hydrologic stores and fluxes; however, the effects and regulatory mechanisms of species mixing on the water conservation capacity of the litter–soil continuum remain poorly understood, and differences among tree species [...] Read more.
Increasing evidence has shown that introducing broadleaved trees into coniferous plantations can regulate hydrologic stores and fluxes; however, the effects and regulatory mechanisms of species mixing on the water conservation capacity of the litter–soil continuum remain poorly understood, and differences among tree species may appear. Herein, we investigated and compared the water conservation capacity of the litter layer (semi-decomposed and decomposed layer) and soil layer (0–100 cm) in a monoculture plantation (Pinus massoniana) and five mixed plantations (Pinus massoniana mixed with Cercidiphyllum japonicum, Manglietia chingii, Camellia oleifera, Michelia maudiae, and Bretschneidera sinensis) and comprehensively considered their potential influencing factors. We discovered that the identity of broadleaved tree species significantly affected the water storage of litter and soil in the mixed plantations (p < 0.05). The effective water-holding capacity of the litter (13.39 t·ha−1) was low due to the coniferous litter’s simple structure and challenging breakdown, despite the fact that the litter stock of the monoculture plantation was substantially larger than that of the mixed plantation (14.72 t·ha−1). Introducing deep-rooted tree species (e.g., Bretschneidera sinensis and Camellia oleifera) into Pinus massoniana farmsteads improved the soil-pore structure and aggregate stability, thereby significantly increasing the 0–100 cm soil water storage. Furthermore, we found that litter storage, soil organic carbon, and litter thickness, as key influencing factors, have complex effects on the water storage of the litter–soil continuum. Generally, these findings demonstrated that mixed plantations can potentially improve the water conservation capacity of the litter–soil system. Nevertheless, special attention should be given to the complementarity between tree species combinations. Full article
(This article belongs to the Special Issue Biodiversity-Ecosystem Functioning Relationships in Forest Ecosystems)
Show Figures

Figure 1

Figure 1
<p>Comparison of maximum water-holding capacity (<b>a</b>) and effective water–holding capacity (<b>b</b>) of litter in different forest types. Note: OF: semi-decomposed litter; OL: undecomposed litter. The lowercase letters illustrate significant differences among different forest types in the same litter layer (<span class="html-italic">p</span> &lt; 0.05). <span class="html-italic">Pinus massoniana</span> (PM), <span class="html-italic">Bretschneidera sinensis</span> (BS), <span class="html-italic">Manglietia chingii</span> (MC), <span class="html-italic">Cercidiphyllum japonicum</span> (CJ), <span class="html-italic">Camellia oleifera</span> (CO), and <span class="html-italic">Michelia maudiae</span> (MM).</p>
Full article ">Figure 2
<p>(<b>a</b>) Soil–saturated water storage, (<b>b</b>) capillary water storage, and (<b>c</b>) noncapillary water storage in different forest types. Note: the points denote the overall mean values, and the shaded regions represent the 95% CIs. <span class="html-italic">Pinus massoniana</span> (PM), <span class="html-italic">Bretschneidera sinensis</span> (BS), <span class="html-italic">Manglietia chingii</span> (MC), <span class="html-italic">Cercidiphyllum japonicum</span> (CJ), <span class="html-italic">Camellia oleifera</span> (CO), and <span class="html-italic">Michelia maudiae</span> (MM).</p>
Full article ">Figure 3
<p>Comprehensive evaluation of water capacity function in the litter–soil continuum of different forest types. Note: the lower the comprehensive evaluation score, the higher the water conservation capacity in the litter–soil continuum. <span class="html-italic">Pinus massoniana</span> (PM), <span class="html-italic">Bretschneidera sinensis</span> (BS), <span class="html-italic">Manglietia chingii</span> (MC), <span class="html-italic">Cercidiphyllum japonicum</span> (CJ), <span class="html-italic">Camellia oleifera</span> (CO), and <span class="html-italic">Michelia maudiae</span> (MM).</p>
Full article ">Figure 4
<p>Factors influencing the water conservation capacity of the litter-soil continuum. (<b>a</b>) Redundancy analysis (RDA) for the associations of environmental factors with water conservation capacity. (<b>b</b>) Correlation between environmental factors and water conservation capacity. (<b>c</b>) Independent effects of environmental factors on water conservation capacity. Note: SOC: soil organic carbon; LS: litter stock; LT: litter thickness; <span class="html-italic">GMD</span>: geometric mean diameter; <span class="html-italic">MWD</span>: mean weight diameter; <span class="html-italic">SSWS</span>: soil saturated water storage; <span class="html-italic">D</span>: fractal dimension; <span class="html-italic">CWS</span>: capillary water storage; <span class="html-italic">MWHC</span>: maximum water–holding capacity of litter; <span class="html-italic">NCWS</span>: noncapillary water storage; and <span class="html-italic">EWHC</span>: effective water-holding capacity of litter. <span class="html-italic">Pinus massoniana</span> (PM), <span class="html-italic">Bretschneidera sinensis (</span>BS<span class="html-italic">)</span>, <span class="html-italic">Manglietia chingii</span> (MC), <span class="html-italic">Cercidiphyllum japonicum</span> (CJ), <span class="html-italic">Camellia oleifera</span> (CO), and <span class="html-italic">Michelia maudiae</span> (MM).</p>
Full article ">
14 pages, 1336 KiB  
Article
Efficient Procedure for Induction Somatic Embryogenesis in Holm Oak: Roles of Explant Type, Auxin Type, and Exposure Duration to Auxin
by María Teresa Martínez and Elena Corredoira
Forests 2023, 14(2), 430; https://doi.org/10.3390/f14020430 - 19 Feb 2023
Cited by 1 | Viewed by 1710
Abstract
Holm oak is the dominant tree species in the Mediterranean climate. Currently, worrisome degradation of its ecosystems has been observed, produced, among other factors, by changes in land use, extreme weather events, forest fires, climate change, and especially the increasingly frequent episodes of [...] Read more.
Holm oak is the dominant tree species in the Mediterranean climate. Currently, worrisome degradation of its ecosystems has been observed, produced, among other factors, by changes in land use, extreme weather events, forest fires, climate change, and especially the increasingly frequent episodes of high tree mortality caused by “oak decline”, which has brought with it a social concern that transcends the productive interest. Breeding and conservation programs for this species are necessary to ensure the prevalence of these ecosystems for future generations. Biotechnological tools such as somatic embryogenesis (SE) have great potential value for tree improvement and have been shown to be highly efficient in the propagation and conservation of woody species. One challenge to this approach is that SE induction in holm oak has not yet been optimized. Here, we present a new reproducible procedure to induce SE in holm oak; we evaluated the responsiveness of different initial explants exposed to different types, concentrations, and durations of auxin. SE rates were significantly improved (37%) by culturing nodal segments for two weeks in induction medium. In addition, a significant auxin–genotype interaction was observed. Full article
(This article belongs to the Special Issue Application of Plant Biotechnology in Forestry)
Show Figures

Figure 1

Figure 1
<p>Initial explants used to induce somatic embryogenesis on holm oak at the excision day. (<b>A</b>) Shoot apex explant. (<b>B</b>) Leaf explant. (<b>C</b>) Node explant. Bar: 1 mm.</p>
Full article ">Figure 2
<p>Somatic embryogenesis induction on different explants excised from axillary shoot cultures established from adult holm oak trees. (<b>A</b>) Somatic embryos and nodular embryogenic structures generated on different apex explants of genotype Q10-SE cultured on induction medium with IAA. (<b>B</b>–<b>D</b>) Embryogenic response on an apex (<b>B</b>), node (<b>C</b>), and leaf (<b>D</b>) explant of genotype Q3-SE. (<b>A</b>): diameter dish 90 mm. (<b>D</b>): bar 1 mm.</p>
Full article ">
13 pages, 4188 KiB  
Article
Physiological Responses of Chionanthus retusus Seedlings to Drought and Waterlogging Stresses
by Muge Niu, Tianran Zhao, Dong Xu, Cuishuang Liu, Yuan Liu, Maotong Sun, Huicheng Xie and Jihong Li
Forests 2023, 14(2), 429; https://doi.org/10.3390/f14020429 - 19 Feb 2023
Cited by 3 | Viewed by 1817
Abstract
Understanding the adaptability of Chionanthus retusus Lindl. et Paxt. to extreme water conditions will help in exploring the potential application of this species in barren mountains. Three-year-old Chionanthus retusus seedlings were used in a greenhouse pot experiment that analyzed the effect of different [...] Read more.
Understanding the adaptability of Chionanthus retusus Lindl. et Paxt. to extreme water conditions will help in exploring the potential application of this species in barren mountains. Three-year-old Chionanthus retusus seedlings were used in a greenhouse pot experiment that analyzed the effect of different moisture gradients on growth, photosynthetic and fluorescence characteristics, protective enzyme system, osmotic substance regulation and cell membrane damage. The results indicated that C. retusus can effectively grow at a relative soil water content of 44.6% and above and can maintain growth for 20 days under flooded conditions. Under drought stress, net photosynthesis rate (Pn), stomatal conductance (Gs), transpiration rate (Tr), and intercellular carbon dioxide concentration (Ci) all showed a trend of gradual decrease. The trend of change was similar under waterlogging conditions. The maximal quantum yield of PSII photochemistry (Fv/Fm), actual photochemical efficiency of PSII (ΦPSII), photochemical quenching coefficient (qP), and electron transport rate (ETR) all decreased as drought deepened. Malondialdehyde (MDA) content decreased first and then increased. However, superoxide dismutase (SOD) activity content, peroxidase (POD) activity content, and proline (Pro) activity content showed a trend of increasing and then decreasing. C. retusus had good adaptability in the slight drought treatment group and flooded treatment group but showed intolerance in the high drought group, which could still last for approximately 21 days. C. retusus was found to have a strong adaptability to water stress and can be used as an afforestation tree in barren mountains. Full article
(This article belongs to the Special Issue Stress Resistance and Genetic Improvement of Forest Trees)
Show Figures

Figure 1

Figure 1
<p>Effects of water stress on growth morphology of <span class="html-italic">Chionanthus retusus</span> clones (28 d). The top column shows the leaf state under different stress conditions, and the bottom column shows the plant growth state under different stress conditions. CK, control group; SD, slight drought treatment group; MD, moderate drought treatment group; HD, high drought treatment group; WF, flooded treatment group.</p>
Full article ">Figure 2
<p>Effects of water stress on photosynthetic characteristics of <span class="html-italic">C. retusus</span> leaves. (<b>A</b>) Effects of water stress on Pn of <span class="html-italic">C. retusus</span> leaves; (<b>B</b>) Effects of water stress on Gs of <span class="html-italic">C. retusus</span> leaves; (<b>C</b>) Effects of water stress on Tr of <span class="html-italic">C. retusus</span> leaves; (<b>D</b>) Effects of water stress on Ci of <span class="html-italic">C. retusus</span> leaves. Upper-case letters represent the variations in different treatment groups, and lower-case letters represent the difference in stress days within the group (significant). See the caption for <a href="#forests-14-00429-f001" class="html-fig">Figure 1</a> for an explanation of abbreviations.</p>
Full article ">Figure 3
<p>Effects of water stress on chlorophyll fluorescence characteristics of <span class="html-italic">C. retusus</span> leaves. (<b>A</b>) Effects of water stress on F<sub>v</sub>/F<sub>m</sub> of <span class="html-italic">C. retusus</span> leaves; (<b>B</b>) Effects of water stress on Φ<sub>PSII</sub> of <span class="html-italic">C. retusus</span> leaves; (<b>C</b>) Effects of water stress on q<sup>P</sup> of <span class="html-italic">C. retusus</span> leaves; (<b>D</b>) Effects of water stress on ETR of <span class="html-italic">C. retusus</span> leaves. Upper-case letters represent the variations in different treatment groups, and lower-case letters represent the difference in stress days within the group (significant). See the caption for <a href="#forests-14-00429-f001" class="html-fig">Figure 1</a> for an explanation of abbreviations.</p>
Full article ">Figure 4
<p>Effects of water stress on protective enzyme activities of <span class="html-italic">C. retusus</span> leaves. (<b>A</b>) Effects of water stress on SOD activities of <span class="html-italic">C. retusus</span> leaves. (<b>B</b>) Effects of water stress on POD activities of <span class="html-italic">C. retusus</span> leaves. Upper-case letters represent the variations in different treatment groups, and lower-case letters represent the difference in stress days within the group (significant). See the caption for <a href="#forests-14-00429-f001" class="html-fig">Figure 1</a> for an explanation of abbreviations.</p>
Full article ">Figure 5
<p>Effects of water stress on malondialdehyde (MDA) content and osmoregulation substances of <span class="html-italic">C. retusus</span> leaves. (<b>A</b>) Effects of water stress on MDA content of <span class="html-italic">C. retusus</span> leaves; (<b>B</b>) Effects of water stress on Pro content of <span class="html-italic">C. retusus</span> leaves; Upper-case letters represent the variations in different treatment groups, and lower-case letters represent the difference in stress days within the group (significant). See the caption for <a href="#forests-14-00429-f001" class="html-fig">Figure 1</a> for an explanation of abbreviations.</p>
Full article ">Figure 6
<p>Effect of water stress on the net photosynthetic rate of <span class="html-italic">C. retusus</span> leaves.</p>
Full article ">Figure 7
<p>Principal component score graphs of 12 indicators of different treatments for <span class="html-italic">C. retusus</span>. Red, orange, yellow, green and blue represent the principal component scores of different groups treated at days 0, 7, 14, 21, and 28 under different stress conditions, respectively. See the caption for <a href="#forests-14-00429-f001" class="html-fig">Figure 1</a> for an explanation of abbreviations.</p>
Full article ">
16 pages, 4442 KiB  
Article
An Agent-Based Model of a Sustainable Forest Operation in a Theoretical Lowland Dipterocarp Forest Modeled after Mount Makiling Forest Reserve, Philippines
by Zenith Arnejo, Leonardo Barua, Paul Joseph Ramirez, Cristino Tiburan Jr. and Nathaniel Bantayan
Forests 2023, 14(2), 428; https://doi.org/10.3390/f14020428 - 19 Feb 2023
Viewed by 2037
Abstract
This study investigates the integration of assisted natural regeneration (ANR) and selective logging (SL) to guarantee a sustainable forest operation in the Philippines using agent-based modeling. To assess the sustainability of the operation in light of the revenue from timber harvesting and the [...] Read more.
This study investigates the integration of assisted natural regeneration (ANR) and selective logging (SL) to guarantee a sustainable forest operation in the Philippines using agent-based modeling. To assess the sustainability of the operation in light of the revenue from timber harvesting and the health of the forest in terms of the total number of trees, various simulations were run on a theoretical forest modeled after the Mount Makiling Forest Reserve in the Philippines. The findings of the simulation have shown that, even after many years of continuous use, the performance of SL on a healthy forest similar to the theoretical forest is substantially identical with and without ANR. The “with ANR” setup, however, was able to demonstrate a considerably better and more stable harvest value over the final 100 years than the “without ANR” setup. In terms of ensuring sustainable forest cover, simulation findings showed that even after 500 years of continuous SL activity, the forest cover could be maintained to up to 80% with ANR. The model has shown that with the right combination of reforestation efforts and timber harvesting methods, a sustainable forest operation can contribute to the country’s economic needs for timber production while ensuring that the forest is actively managed. Full article
(This article belongs to the Special Issue Forest Dynamics Models for Conservation, Restoration, and Management)
Show Figures

Figure 1

Figure 1
<p>Scheduling of the successive steps in a year simulated by the GAMA Forest Model.</p>
Full article ">Figure 2
<p>Screenshots of the landscape: (<b>a</b>) landscape divided into parcels, (<b>b</b>) landscape populated with initial distribution of trees, and (<b>c</b>) landscape visualized with initial volume of parcels and location of protected parcels (in magenta).</p>
Full article ">Figure 3
<p>Landscape of the theoretical forest patterned after Mount Makiling Forest Reserve, Philippines and used in the GAMA Forest Model.</p>
Full article ">Figure 4
<p>Distribution of trees in the theoretical forest in terms of type (<b>a</b>) and DBH (<b>b</b>).</p>
Full article ">Figure 5
<p>Conceptualization of the GAMA Forest Model.</p>
Full article ">Figure 6
<p>Result of the 500-year simulation on three setups: 5-planter, 10-planter, and 15-planter.</p>
Full article ">Figure 7
<p>Average harvest value for simulation periods 1–400 and 401–500 on three setups: 5-planter, 10-planter, and 15-planter.</p>
Full article ">Figure 8
<p>Comparison between the number of parcels candidate for SL and ANR activities in a 500-year simulation using default values (see <a href="#forests-14-00428-t002" class="html-table">Table 2</a>).</p>
Full article ">Figure 9
<p>First-order index result of the Sobol analysis on the effect of the number of harvesters and planters on four output values: ANR parcels, harvest profit, remaining trees, and SL parcels.</p>
Full article ">Figure 10
<p>Comparison between the effect of implementing and not implementing ANR in sustaining the forest cover.</p>
Full article ">Figure 11
<p>Comparison between the effect of implementing and not implementing ANR with respect to the total harvest value.</p>
Full article ">
14 pages, 16576 KiB  
Article
Inferring Vertical Tree Growth Direction of Samanea saman and Delonix regia Trees with the Pattern of Lateral Root Distribution Using the Root Detector
by Mohamad Miftah Rahman, Yoga Fredisa, Dodi Nandika, Naresworo Nugroho, Iskandar Zulkanaen Siregar and Lina Karlinasari
Forests 2023, 14(2), 427; https://doi.org/10.3390/f14020427 - 19 Feb 2023
Cited by 1 | Viewed by 2025
Abstract
The root system is important for supporting tree growth and stability. In this study, we analyzed the relationship between the main lateral root distribution pattern and vertical tree growth direction based on root detection and analysis of tree morphometry. Tree growth represented by [...] Read more.
The root system is important for supporting tree growth and stability. In this study, we analyzed the relationship between the main lateral root distribution pattern and vertical tree growth direction based on root detection and analysis of tree morphometry. Tree growth represented by morphometric data were measured directly, and the root distribution was identified using a sonic Root Detector. Sixteen targeted trees (eight Samanea saman and eight Delonix regia trees) in an urban area landscape were selected in this study. The Root Detector revealed that the average sonic velocity of lateral roots was 676.88 m∙s−1 for S. saman and 865.32 m∙s−1 for D. regia. For root distribution, Root Detector determined the average numbers of main lateral roots for S. saman and D. regia, which were 6 and 10, respectively. Based on correlation analysis, significant relationships were found between tree root sonic velocity and the degree of lean, height, and diameter of the tree; meanwhile the relationship between crown diameter and slenderness were not significant. Findings confirmed that, in relation to the root distribution and the growth direction of the trunk and crown, the lateral root is mainly distributed in the opposite direction of the tree lean rather than crown growth direction. Full article
(This article belongs to the Section Forest Ecophysiology and Biology)
Show Figures

Figure 1

Figure 1
<p>An experimental setup in the field for root detector testing: (<b>a</b>) Fakopp Root Detector set in the tree, and (<b>b</b>) 15 cm steps in a circle at a distance of 80 cm from the midpoint of the main trunk.</p>
Full article ">Figure 2
<p>The example of representative graphical visualization of root distribution based on (<b>a</b>) Root Detector Evaluation Software (Fakopp Enterprise Bt, Hungary) in which dark circles points out a higher sonic velocity values of main root; and (<b>b</b>) sonic velocity and distribution data processing using Microsoft Excel (red line circle is root sonic velocity threshold, green line circle denotes the mean of root sonic velocity value, and the bigger peak dots indicate the main lateral root).</p>
Full article ">Figure 3
<p>Representative images of (<b>a</b>) the canopy area (green area) and the distribution of the main lateral roots based on the peak of sonic velocity (dash line), and (<b>b</b>) tree leaning and the crown direction tendency, which were related to the lateral root distribution and the direction of tree growth.</p>
Full article ">Figure 4
<p>The example of tree appearance of (<b>a</b>) rain tree (<span class="html-italic">Samanea saman</span>) and (<b>b</b>) flamboyant tree (<span class="html-italic">Delonix regia</span>) in the urban landscape.</p>
Full article ">Figure 5
<p>Boxplot of the distribution of tree diameter (dbh) (<b>a</b>) and tree height (<b>b</b>) of <span class="html-italic">Samanea saman</span> and <span class="html-italic">Delonix regia</span>.</p>
Full article ">Figure 6
<p>Boxplot of the tree slenderness (<b>a</b>) and distribution of crown diameter coefficients (<b>b</b>) of <span class="html-italic">Samanea saman</span> and <span class="html-italic">Delonix regia</span>.</p>
Full article ">Figure 7
<p>The sonic velocity (m∙s<sup>−1</sup>) detected by the Root Detector for <span class="html-italic">Samanea saman</span> and <span class="html-italic">Delonix regia</span>.</p>
Full article ">Figure 8
<p>The root woody biomass sonic velocity (m∙s<sup>−1</sup>) detected by the Root Detector for <span class="html-italic">Samanea saman</span> and <span class="html-italic">Delonix regia</span> for all trees at about 80 cm distance from the trunk. The dash line (---) is the average value of root sonic velocity.</p>
Full article ">Figure 9
<p>The direction of leaning for <span class="html-italic">Samanea saman</span> trees (circle-head line) and crown development (arrow-head line) in relation to lateral root distribution with the main lateral roots (dash lines).</p>
Full article ">Figure 9 Cont.
<p>The direction of leaning for <span class="html-italic">Samanea saman</span> trees (circle-head line) and crown development (arrow-head line) in relation to lateral root distribution with the main lateral roots (dash lines).</p>
Full article ">Figure 10
<p>The direction of leaning for <span class="html-italic">Delonix regia</span> trees (circle-head line) and crown development (arrow-head line) related to lateral root distribution with the main lateral roots (dash lines).</p>
Full article ">Figure 11
<p>The number of main lateral roots detected for <span class="html-italic">Samanea saman</span> and <span class="html-italic">Delonix regia</span> trees.</p>
Full article ">
17 pages, 3288 KiB  
Article
Fine-Root Soil Stoichiometry of Picea schrenkiana Fisch. et Mey. and Its Correlation with Soil Environmental Factors under Different Nitrogen Input Levels in the Tianshan Mountains, Xinjiang
by Han Zhang, Lu Gong, Zhaolong Ding and Xue Wu
Forests 2023, 14(2), 426; https://doi.org/10.3390/f14020426 - 19 Feb 2023
Cited by 3 | Viewed by 1518
Abstract
Nitrogen enters the soil surface along with the deposition and destroys the element balance of an ecosystem, which has an important impact on underground ecological processes. As active interfaces with the environment, fine roots play a key role in the processes of underground [...] Read more.
Nitrogen enters the soil surface along with the deposition and destroys the element balance of an ecosystem, which has an important impact on underground ecological processes. As active interfaces with the environment, fine roots play a key role in the processes of underground ecosystems and nutrient cycles. Nitrogen in deposition is mainly in two forms, namely organic nitrogen and inorganic nitrogen, which may have different responses to the ecological balance of fine roots and the soil environment; however, in Picea schrenkiana Fisch. et Mey., as a dominant species in the Tianshan Mountains of Xinjiang, it is not clear how different proportions of nitrogen deposition affect the element balance and interactions between fine roots and soil. In this study, from May 2018 to October 2020, five groups of in situ control experiments with different proportions of exogenous nitrogen addition (different ratios of ON–IN, CK = 0:0, N1 = 10:0, N2 = 7:3, N3 = 5:5, N4 = 3:7, and N5 = 0:10, were mixed and then used with equal total amounts of 10 kg·N·ha−1·a−1) were conducted on Picea schrenkiana. The results showed that inorganic nitrogen had a stronger effect on the carbon, nitrogen, and phosphorus contents of fine roots under different proportions of exogenous nitrogen addition, indicating that the fine roots of Picea schrenkiana had a greater response to inorganic nitrogen sources. In a mixed organic–inorganic nitrogen source with the same proportion of organic and inorganic nitrogen, the reaction between fine-root nitrogen (TN = 7.6 g·kg−1−10.8 g·kg −1) and soil phosphorus (TP = 0.99 g·kg−1−1.93 g·kg−1) was stronger, indicating that the Picea schrenkiana ecosystem may be a nitrogen-limited forest ecosystem. In addition, different proportions of nitrogen source inputs have an indirect impact on the fine-root stoichiometry and biomass of different root sequences through the impact on soil environmental factors and stoichiometry. Therefore, our research provides insights into the impact of increases in nitrogen on the nutrient cycling of mountain forests in arid areas and provides small-scale support for a research database of forest ecosystem responses to nitrogen deposition. Full article
Show Figures

Figure 1

Figure 1
<p>Schematic diagram of a root sequence [<a href="#B16-forests-14-00426" class="html-bibr">16</a>]. 1 is the first-order fine roots; 2 is the second-order fine roots; 3 is the third-order fine roots; and 4 is the fourth-order fine roots.</p>
Full article ">Figure 2
<p>One-way ANOVA of soil ecological stoichiometry and biomass characteristics of <span class="html-italic">Picea schrenkiana</span> in different soil layers under different nitrogen source input levels in the Tianshan Mountains, Xinjiang. Different capital letters indicate significant differences in the ecological stoichiometry of elements in the same soil layer under different nitrogen sources (<span class="html-italic">p</span> &lt; 0.05); different lowercase letters indicate significant differences in the ecological stoichiometry of different soil layer elements under the same nitrogen source addition (<span class="html-italic">p</span> &lt; 0.05).</p>
Full article ">Figure 3
<p>One-way ANOVA for soil ecological stoichiometry and biomass characteristics of <span class="html-italic">Picea schrenkiana</span> with different root sequences at the level of different nitrogen source inputs in the Tianshan Mountains, Xinjiang. FLR is first-order fine roots; SLR is second-order fine roots; and TLR is third-order fine roots. Different capital letters indicate that there is a significant difference in the ecological stoichiometry of elements in the same root order under different nitrogen sources (<span class="html-italic">p</span> &lt; 0.05); different lowercase letters indicate that there is a significant difference in the ecological stoichiometry of elements in different root orders under the same nitrogen source addition (<span class="html-italic">p</span> &lt; 0.05).</p>
Full article ">Figure 4
<p>One-way ANOVA of soil ecological stoichiometry and biomass characteristics of <span class="html-italic">Picea schrenkiana</span> in different soil layers under different nitrogen source input levels in the Tianshan Mountains, Xinjiang. FLR is first-order fine roots; SLR is second-order fine roots; and TLR is third-order fine roots. Different capital letters represent significant differences in the ecological stoichiometry of elements in the same root order under different nitrogen sources (<span class="html-italic">p</span> &lt; 0.05); different lower case letters represent significant differences in the ecological stoichiometry of elements in different root orders under the same nitrogen sources (<span class="html-italic">p</span> &lt; 0.05).</p>
Full article ">Figure 5
<p>RDA of the fine-root–soil stoichiometry of <span class="html-italic">Picea schrenkiana</span> at different root sequences under the mixed organic–inorganic nitrogen source input levels in the Tianshan Mountains, Xinjiang. <a href="#forests-14-00426-f005" class="html-fig">Figure 5</a> (<b>a</b>) shows the stoichiometric RDA of fine-root soil of <span class="html-italic">Picea schrenkiana</span> at the level of organic nitrogen inputs; (<b>b</b>) shows the stoichiometric RDA of fine-root soil of <span class="html-italic">Picea schrenkiana</span> at the level of inorganic nitrogen inputs; and (<b>c</b>) shows the stoichiometric RDA of fine-root soil of <span class="html-italic">Picea schrenkiana</span> at the level of the mixed organic–inorganic nitrogen source inputs. BIO is fine-root biomass, ROC is fine-root organic carbon, RTN is fine-root total nitrogen, RTP is fine-root total phosphorus, RC/N is the fine-root carbon/nitrogen ratio, RC/P is the fine-root carbon/phosphorus ratio, RN/P is the fine-root nitrogen/phosphorus ratio, SWC is soil water content, SOC is soil organic carbon, STN is soil total nitrogen, STP is soil total phosphorus, SC/N is the soil carbon/nitrogen ratio, SC/P is the soil carbon/phosphorus ratio, and SN/P is the soil nitrogen/phosphorus ratio.</p>
Full article ">Figure 6
<p>PLS model of the fine-root–soil stoichiometry of <span class="html-italic">Picea schrenkiana</span> with different root sequences at the level of the mixed organic–inorganic nitrogen source inputs in the Tianshan Mountains, Xinjiang. (<b>a</b>) shows the stoichiometric PLS model of fine-root soil of <span class="html-italic">Picea schrenkiana</span> at the organic nitrogen input level; (<b>b</b>) is the overall impact histogram of the fine-root soil stoichiometric PLS model of <span class="html-italic">Picea schrenkiana</span> at different nitrogen input levels; (<b>c</b>) shows the stoichiometric PLS model of the fine-root soil of <span class="html-italic">Picea schrenkiana</span> at inorganic nitrogen input levels; (<b>d</b>) is the overall impact histogram of the fine-root soil stoichiometric PLS model of <span class="html-italic">Picea schrenkiana</span> at different nitrogen input levels; (<b>e</b>) shows the stoichiometric PLS model of fine-root soil of <span class="html-italic">Picea schrenkiana</span> at the mixed organic–inorganic nitrogen source level; and (<b>f</b>) shows the overall impact histogram of the fine-root soil stoichiometric PLS model of <span class="html-italic">Picea schrenkiana</span> under different nitrogen input levels. The red arrow represents a positive correlation, and the blue arrow represents a negative correlation. N addition denotes the nitrogen source, SEC is the soil ecological stoichiometry, SEF is the soil environmental factor, FRTN is the first-order fine-root ecological stoichiometry, FBIO is the first-order fine-root biomass, SRTN is the second-order fine-root ecological stoichiometry, SBIO is the second-order fine-root biomass, TRTN is the third-order fine-root ecological stoichiometry, and TBIO is the third-order fine-root biomass.</p>
Full article ">Figure 6 Cont.
<p>PLS model of the fine-root–soil stoichiometry of <span class="html-italic">Picea schrenkiana</span> with different root sequences at the level of the mixed organic–inorganic nitrogen source inputs in the Tianshan Mountains, Xinjiang. (<b>a</b>) shows the stoichiometric PLS model of fine-root soil of <span class="html-italic">Picea schrenkiana</span> at the organic nitrogen input level; (<b>b</b>) is the overall impact histogram of the fine-root soil stoichiometric PLS model of <span class="html-italic">Picea schrenkiana</span> at different nitrogen input levels; (<b>c</b>) shows the stoichiometric PLS model of the fine-root soil of <span class="html-italic">Picea schrenkiana</span> at inorganic nitrogen input levels; (<b>d</b>) is the overall impact histogram of the fine-root soil stoichiometric PLS model of <span class="html-italic">Picea schrenkiana</span> at different nitrogen input levels; (<b>e</b>) shows the stoichiometric PLS model of fine-root soil of <span class="html-italic">Picea schrenkiana</span> at the mixed organic–inorganic nitrogen source level; and (<b>f</b>) shows the overall impact histogram of the fine-root soil stoichiometric PLS model of <span class="html-italic">Picea schrenkiana</span> under different nitrogen input levels. The red arrow represents a positive correlation, and the blue arrow represents a negative correlation. N addition denotes the nitrogen source, SEC is the soil ecological stoichiometry, SEF is the soil environmental factor, FRTN is the first-order fine-root ecological stoichiometry, FBIO is the first-order fine-root biomass, SRTN is the second-order fine-root ecological stoichiometry, SBIO is the second-order fine-root biomass, TRTN is the third-order fine-root ecological stoichiometry, and TBIO is the third-order fine-root biomass.</p>
Full article ">
29 pages, 41183 KiB  
Article
Response of Vegetation Coverage to Climate Changes in the Qinling-Daba Mountains of China
by Han Ren, Chaonan Chen, Yanhong Li, Wenbo Zhu, Lijuan Zhang, Liyuan Wang and Lianqi Zhu
Forests 2023, 14(2), 425; https://doi.org/10.3390/f14020425 - 19 Feb 2023
Cited by 5 | Viewed by 1546
Abstract
As a major component of the north–south transition zone in China, the vegetation ecosystem of the Qinling-Daba Mountains (QBM) is highly sensitive to climate change. However, the impact of sunshine duration, specifically, on regional vegetation remains unclear. By using linear trend, correlation, and [...] Read more.
As a major component of the north–south transition zone in China, the vegetation ecosystem of the Qinling-Daba Mountains (QBM) is highly sensitive to climate change. However, the impact of sunshine duration, specifically, on regional vegetation remains unclear. By using linear trend, correlation, and multiple regression analyses, this study systematically analyzed the spatiotemporal characteristics and trend changes of the vegetation coverage in the QBM from 2000–2020. Changes in the main climate elements in different periods and the responses to them are also discussed. Over the past 21 years, the vegetation coverage on the east and west sides of the QBM has been lower than that in the central areas. However, it is showing a continuously improving trend, especially in winters and springs. The findings indicate that change of FVC in the QBM exhibited a positive correlation with temperature, a negative correlation with sunshine hours, and both positive and negative correlation with precipitation. On an annual scale, average temperature was the main controlling climatic factor. On a seasonal scale, the area dominated by precipitation in spring was larger. In summer, the relative importance of the three was weak. In autumn and winter, sunshine duration became the main factor affecting vegetation coverage in most areas. Full article
(This article belongs to the Special Issue Modeling and Remote Sensing of Forests Ecosystem)
Show Figures

Figure 1

Figure 1
<p>Overview of the QBM: (<b>a</b>) Geographical position; (<b>b</b>) Basic Elements: elevation, mountain peak, city location, and rivers; (<b>c</b>) Ecological Function Reserve (Number 1–6 represent the six ecological function reserves); (<b>d</b>) Forestry Engineering.</p>
Full article ">Figure 2
<p>Spatial Distribution of Selected Meteorological Stations in the Study Area.</p>
Full article ">Figure 3
<p>Change of <span class="html-italic">FVC</span> average value in the QBM from 2000–2020. (<b>a</b>) Year; (<b>b</b>) Spring; (<b>c</b>) Summer; (<b>d</b>) Autumn; (<b>e</b>) Winter.</p>
Full article ">Figure 4
<p>Changes of <span class="html-italic">FVC</span> spatial pattern in the QBM from 2000–2020. (<b>a</b>) Average value; (<b>b</b>) <span class="html-italic">FVC</span> level; (<b>c</b>) Change trend rate; (<b>d</b>) Significance level.</p>
Full article ">Figure 5
<p>Change of seasonal average <span class="html-italic">FVC</span> spatial pattern in the QBM from 2000–2020. (<b>a</b>) Average value; (<b>b</b>) <span class="html-italic">FVC</span> level; (<b>c</b>) Change trend rate; (<b>d</b>) Significance level.</p>
Full article ">Figure 5 Cont.
<p>Change of seasonal average <span class="html-italic">FVC</span> spatial pattern in the QBM from 2000–2020. (<b>a</b>) Average value; (<b>b</b>) <span class="html-italic">FVC</span> level; (<b>c</b>) Change trend rate; (<b>d</b>) Significance level.</p>
Full article ">Figure 6
<p>Annual mean change of climate factors in the QBM from 2000–2020: (<b>a</b>) <span class="html-italic">TEM</span>; (<b>b</b>) <span class="html-italic">PRE</span>; (<b>c</b>) <span class="html-italic">SSD</span>.</p>
Full article ">Figure 7
<p>Seasonal mean changes of climate factors in the QBM from 2000–2020: (<b>a</b>) <span class="html-italic">TEM</span>; (<b>b</b>) <span class="html-italic">PRE</span>; (<b>c</b>) <span class="html-italic">SSD</span>.</p>
Full article ">Figure 7 Cont.
<p>Seasonal mean changes of climate factors in the QBM from 2000–2020: (<b>a</b>) <span class="html-italic">TEM</span>; (<b>b</b>) <span class="html-italic">PRE</span>; (<b>c</b>) <span class="html-italic">SSD</span>.</p>
Full article ">Figure 8
<p>The spatial pattern changes of climate factors in the QBM from 2000–2020: (<b>a</b>) <span class="html-italic">TEM</span>; (<b>b</b>) <span class="html-italic">PRE</span>; (<b>c</b>) <span class="html-italic">SSD</span>. (1. Annual average; 2. Change trend rate).</p>
Full article ">Figure 9
<p>Change of seasonal average <span class="html-italic">TEM</span> spatial pattern in the QBM from 2000–2020. (<b>a</b>) Seasonal average; (<b>b</b>) Seasonal change trend rate.</p>
Full article ">Figure 10
<p>Change of seasonal average <span class="html-italic">PRE</span> spatial pattern in the QBM from 2000–2020. (<b>a</b>) Seasonal average; (<b>b</b>) Seasonal change trend rate.</p>
Full article ">Figure 11
<p>Change of seasonal average <span class="html-italic">SSD</span> spatial pattern in the QBM from 2000–2020. (<b>a</b>) Seasonal average; (<b>b</b>) Seasonal change trend rate.</p>
Full article ">Figure 12
<p>Spatial distribution of the correlation between annual <span class="html-italic">FVC</span> and climatic factors in the QBM from 2000–2020: (<b>a</b>) <span class="html-italic">TEM</span>; (<b>b</b>) <span class="html-italic">PRE</span>; (<b>c</b>) <span class="html-italic">SSD</span>.</p>
Full article ">Figure 13
<p>Spatial distribution of the correlation between seasonal <span class="html-italic">FVC</span> and <span class="html-italic">TEM</span> in the QBM from 2000–2020.</p>
Full article ">Figure 14
<p>Spatial distribution of the correlation between seasonal <span class="html-italic">FVC</span> and <span class="html-italic">PRE</span> in the QBM from 2000–2020.</p>
Full article ">Figure 15
<p>Spatial distribution of the correlation between seasonal <span class="html-italic">FVC</span> and <span class="html-italic">SSD</span> in the QBM from 2000–2020.</p>
Full article ">Figure 16
<p>Main climate factors of average <span class="html-italic">FVC</span> in the QBM. (<b>a</b>) Year; (<b>b</b>) Spring; (<b>c</b>) Summer; (<b>d</b>) Autumn; (<b>e</b>) Winter.</p>
Full article ">Figure 17
<p>Proportion of the main control area of climate factors in the QBM. (<b>a</b>) Year; (<b>b</b>) Spring; (<b>c</b>) Summer; (<b>d</b>) Autumn; (<b>e</b>) Winter.</p>
Full article ">
16 pages, 5127 KiB  
Article
Hierarchical Task Analysis (HTA) for Application Research on Operator Work Practices and the Design of Training and Support Systems for Forestry Harvester
by Felix A. Dreger, Martin Englund, Florian Hartsch, Thilo Wagner, Dirk Jaeger, Rolf Björheden and Gerhard Rinkenauer
Forests 2023, 14(2), 424; https://doi.org/10.3390/f14020424 - 18 Feb 2023
Cited by 2 | Viewed by 3519
Abstract
Highly mechanized forestry operations are essential for efficient timber harvesting. Therefore, the skills of harvester operators appear to be key to productive and sustainable use of the machines. Recent research has revealed a knowledge deficit regarding the work practices of forest machine operators. [...] Read more.
Highly mechanized forestry operations are essential for efficient timber harvesting. Therefore, the skills of harvester operators appear to be key to productive and sustainable use of the machines. Recent research has revealed a knowledge deficit regarding the work practices of forest machine operators. This urges systematic research into forestry machine handling and a corresponding refinement of analytical methods. Current analyses of operator tasks in forestry are less formalized and focus predominantly on machine efficiency and overall performance, but not so much on the human-related conditions of work performance and workload. Therefore, the objective of this paper is to introduce hierarchical task analysis (HTA) into forestry science. HTA is a versatile, formalized human-factors method that can be used to describe the work objectives of forest machine operators. HTA is suitable, for example, for describing (in)efficient work practices and thus as a basis for designing machine operator training and for systematically evaluating assistive technologies. The task analyses in this paper draw on a recently published empirical approach to analyzing work practices, workflows, and machine operator behavior for optimal human–machine collaboration in forestry application research. Specifically, the main work methods of clearcutting and thinning stand in European forestry were considered, with examples from Scandinavian and German method application. The process of HTA is described and a prototypical approach to HTA for both working methods provided. As a result, this work could show that a single work practice affects operator goals within different work elements and sets out how inefficient work practices can be described in terms of operator goals. With the introduction and exemplary application of HTA, a structured task definition in human-centered approaches is encouraged to analyze work practices, workflows, and machine operator behavior for optimal human–machine collaboration in forestry application research. Full article
(This article belongs to the Special Issue Forest Harvesting, Operations and Management)
Show Figures

Figure 1

Figure 1
<p>Level 0–2 of the hierarchical task analyses of the harvester operators’ task in (<b>a</b>) <span class="html-italic">clear felling</span> and (<b>b</b>) <span class="html-italic">thinning stand</span> operations.</p>
Full article ">Figure 2
<p>Displayed subgoals: (<b>a</b>) goal 1.1: Plan route of goal 1.1, position harvester, (<b>b</b>) goal 2.1: Grab tree, and (<b>c</b>) goal 2.2: Fell-cut of harvester operators in <span class="html-italic">clear</span>-<span class="html-italic">felling</span> operation.</p>
Full article ">Figure 3
<p>Displayed subgoals: (<b>a)</b> 3.4: Position/adjust harvester head for delimbing/feeding in machine trail, (<b>b</b>) 3.9: Clear trees in machine trail that are different in stand thinning compared to clear felling of the goal 3: Process tree in <span class="html-italic">stand</span>-<span class="html-italic">thinning</span> operations.</p>
Full article ">Figure A1
<p>Displayed subgoals: goal 1.2: Drive harvester to target position (<b>a</b>) and goal 1.3: Decide trees to be removed (<b>b</b>) of goal 1.1: Position harvester of harvester operators in clear-felling operations.</p>
Full article ">Figure A2
<p>Displayed subgoals 3.1: Decide pile position (<b>a</b>), 3.3: Examine tree damage/rot (<b>b</b>), 3.4: Position/adjust harvester head for delimbing (<b>c</b>), 3.5: Monitor automated head travel and cross-cut (<b>d</b>), 3.6: Sort logs (<b>e</b>), 3.7: Define measurement baseline (<b>f</b>), and 3.8: Clear tree (<b>g</b>) of goal 3: Process tree in clear-felling operations.</p>
Full article ">Figure A2 Cont.
<p>Displayed subgoals 3.1: Decide pile position (<b>a</b>), 3.3: Examine tree damage/rot (<b>b</b>), 3.4: Position/adjust harvester head for delimbing (<b>c</b>), 3.5: Monitor automated head travel and cross-cut (<b>d</b>), 3.6: Sort logs (<b>e</b>), 3.7: Define measurement baseline (<b>f</b>), and 3.8: Clear tree (<b>g</b>) of goal 3: Process tree in clear-felling operations.</p>
Full article ">Figure A3
<p>Displayed subgoals 3.4: Position/adjust harvester head for delimbing/feeding in machine trail (<b>a</b>), 3.5: Monitor automated head travel (<b>b</b>), 3.8: Correct measurement baseline (<b>c</b>), 3.9: Clear tree (<b>d</b>) in machine trail that are different in stand thinning compared to clear felling of goal 3: Process tree in <span class="html-italic">stand</span>-<span class="html-italic">thinning</span> operations.</p>
Full article ">
14 pages, 1205 KiB  
Article
Urban Parks—A Catalyst for Activities! The Effect of the Perceived Characteristics of the Urban Park Environment on Children’s Physical Activity Levels
by Yu Bao, Ming Gao, Dan Luo and Xudan Zhou
Forests 2023, 14(2), 423; https://doi.org/10.3390/f14020423 - 18 Feb 2023
Cited by 14 | Viewed by 3632
Abstract
The potential of urban parks to enhance social welfare and deliver health benefits has been recognized. However, it is still unclear which landscape characteristics in urban green spaces best improve the physical activity levels of users. Little is known about the relationship between [...] Read more.
The potential of urban parks to enhance social welfare and deliver health benefits has been recognized. However, it is still unclear which landscape characteristics in urban green spaces best improve the physical activity levels of users. Little is known about the relationship between the microenvironment of urban green spaces and the physical activity of children, particularly in the context of high levels of childhood obesity. Using the self-report method, we extracted the perceived environmental characteristics of the landscape and combined this with behavior observation to obtain the level of children’s physical activity in green spaces and to explore the influence of the characteristics of green spaces on these activities. Our results show that the highest levels of activity were found in the semiopen spaces of urban parks, which mainly consist of dense vegetation and a diverse range of recreation facilities. Play facilities were most closely related to the level of intensity of children’s activities, and perceived safety was the primary social perception factor affecting their activities. In addition, perceptions of the social environment were found to play a significant intermediary role in the impact of green space on children’s physical activity. The study results are intended to promote green space planning and design updates, improve the public health level of children, and provide a basis for the construction of child-friendly cities. Full article
(This article belongs to the Special Issue Forest Bathing and Forests for Public Health)
Show Figures

Figure 1

Figure 1
<p>Map of the research site.</p>
Full article ">
13 pages, 1493 KiB  
Article
Ingestion of Species-Specific dsRNA Alters Gene Expression and Can Cause Mortality in the Forest Pest, Ips calligraphus
by Mary Wallace and Lynne K. Rieske
Forests 2023, 14(2), 422; https://doi.org/10.3390/f14020422 - 18 Feb 2023
Cited by 3 | Viewed by 2161
Abstract
Ips calligraphus (Germar) is a conifer pest that causes economically and ecologically significant tree mortality, particularly when forests are stressed. As forests become increasingly vulnerable to pest outbreaks due to habitat fragmentation, invasive species, or climate change, innovative management strategies are needed to [...] Read more.
Ips calligraphus (Germar) is a conifer pest that causes economically and ecologically significant tree mortality, particularly when forests are stressed. As forests become increasingly vulnerable to pest outbreaks due to habitat fragmentation, invasive species, or climate change, innovative management strategies are needed to augment traditional approaches. Manipulating the RNA interference (RNAi) pathway is emerging as a novel pest management technology that could serve as a means of managing I. calligraphus while minimizing non-target effects. Demonstrating effectiveness of exogenous double-stranded RNA (dsRNA) in inducing changes in gene expression and causing mortality is an essential step. In this study, oral ingestion of dsRNA caused significant changes in gene expression and increased mortality for two of the three target dsRNAs tested. Additionally, we sequenced 5 mRNA libraries from adult beetles to assemble a transcriptome, from which we identified sequences of target genes for dsRNAs, and 10 genes in the I. calligraphus transcriptome putatively involved in the RNAi pathway. We demonstrate that oral ingestion of exogenous dsRNA can trigger the RNAi pathway. This is the first published study to artificially trigger the RNAi pathway in an Ips spp. and the first step in evaluating the potential for pest management strategies utilizing RNAi against this pest. Full article
(This article belongs to the Section Forest Health)
Show Figures

Figure 1

Figure 1
<p>Relative mRNA levels of beetles treated with 10 μg target dsRNAs compared to the dsGFP negative control. (<b>a</b>) The <span class="html-italic">hsp</span> gene showed no changes in relative mRNA levels, (<b>b</b>) <span class="html-italic">iap</span> showed a significant decrease, and (<b>c</b>) <span class="html-italic">shi</span> showed a significant increase (one-tailed <span class="html-italic">t</span>-test). * Indicates significance.</p>
Full article ">Figure 2
<p>Beetle survival 10 days after exposure to 10 μg of target dsRNA (dsHSP, dsIAP, and dsSHI), and a negative control (dsGFP). The dsGFP treatment (<b>a</b>) differs significantly from dsIAP and dsSHI (<b>b</b>) but not from dsHSP.</p>
Full article ">Figure 3
<p>Histogram representing functional classification of adult <span class="html-italic">I. calligraphus</span> (Germar) unigenes into clusters of orthologous groups (COG).</p>
Full article ">
32 pages, 7102 KiB  
Review
Mapping the Link between Climate Change and Mangrove Forest: A Global Overview of the Literature
by Thirukanthan Chandra Segaran, Mohamad Nor Azra, Fathurrahman Lananan, Juris Burlakovs, Zane Vincevica-Gaile, Vita Rudovica, Inga Grinfelde, Nur Hannah Abd Rahim and Behara Satyanarayana
Forests 2023, 14(2), 421; https://doi.org/10.3390/f14020421 - 18 Feb 2023
Cited by 9 | Viewed by 5168
Abstract
Mangroves play a crucial role in maintaining the stability of coastal regions, particularly in the face of climate change. To gain insight into associations between climate change and mangroves, we conducted bibliometric research on the global indexed database of the Web of Knowledge, [...] Read more.
Mangroves play a crucial role in maintaining the stability of coastal regions, particularly in the face of climate change. To gain insight into associations between climate change and mangroves, we conducted bibliometric research on the global indexed database of the Web of Knowledge, Core Collection. A total of 4458 literature were analyzed based on bibliometric information and article metadata through a scientometric analysis of citation analysis as well as a cluster analysis. Results suggest that coastal countries such as the USA, Australia, China, India, and Brazil are showing the recent influential mangrove-related keywords such as blue carbon and carbon stock. Interestingly, the “carbon stock”, “Saudi Arabia”, “range expansion” and “nature-based flood risk mitigation” is among the top cluster networks in the field of climate change and mangrove forest. The present research is expected to attract potential leaders in research, government, civil society, and business to advance progress towards mangrove sustainability in the changing climate meaningfully. Full article
(This article belongs to the Special Issue Biodiversity, Health, and Ecosystem Services of Mangroves)
Show Figures

Figure 1

Figure 1
<p>The framework of the present study of climate change and mangrove forests.</p>
Full article ">Figure 2
<p>The number of original research articles on the impact of climate change on mangrove forest-related studies published between 1977 and 2021.</p>
Full article ">Figure 3
<p>The total number of research publications on the impact of climate change on mangroves per country on mangrove forest-related studies. The darker orange reflects the greater number of manuscripts, while lighter shades reflect a moderate number to fewer publications.</p>
Full article ">Figure 4
<p>An interactive illustration of the cooperation network among countries that have published research on the impact of climate change on mangroves from 1977–2021. The lines connecting the nodes represent the strength of connections between research fields, with thicker lines indicating a higher intensity of connections. The size of the nodes signifies the frequency of co-occurrence in the research fields. The nodes are color-coded to represent the year of publication, e.g., red representing 2021, yellow representing 2019, blue representing 2015, and purple representing 2012.</p>
Full article ">Figure 5
<p>Network links between research disciplines. The lines connecting the nodes represent the strength of connections between research fields, with thicker lines indicating a higher intensity of connections. The size of the nodes signifies the frequency of co-occurrence in the subject category. The nodes are color-coded to represent the year of publication, e.g., red representing 2021, yellow representing 2019, blue representing 2015, and purple representing 2012.</p>
Full article ">Figure 6
<p>The reference co-citation network of publications on mangroves and climate change from 1977 to 2021 was analyzed. The size of the nodes in the network reflects the frequency of citation, while the colors of the nodes, ranging from magenta (1977) to yellow (2021), indicate the progression of research over time. The colored connections represent co-citation relationships. The network was further divided into 42 clusters through network clustering analysis.</p>
Full article ">Figure 7
<p>Timeline co-citation cluster analysis. Nodes represent reference names, whereas lines represent connections between those references. The size of the nodes in the network reflects the frequency of citation, while the colors of the nodes, ranging from magenta (1977) to yellow (2021), indicate the progression of research over time. References with strong citation bursts are shown with red nodes.</p>
Full article ">Figure 8
<p>Document co-citation clustering analysis for mangrove and climate change publications.</p>
Full article ">Figure 9
<p>Keyword clustering analysis for mangrove and climate change publications (1977–2021).</p>
Full article ">Figure 10
<p>Keyword co-occurrence network from 1990 to 2000 for mangrove and climate change-related publications.</p>
Full article ">Figure 11
<p>Keyword co-occurrence network from 2000 to 2010 for mangrove and climate change-related publications.</p>
Full article ">Figure 12
<p>Keyword co-occurrence network from 2010 to 2021 for mangrove and climate change-related publications.</p>
Full article ">Figure 13
<p>Evolution of research topics in mangrove-climate change studies from 1977 to 2021.</p>
Full article ">Figure 14
<p>Domain-level citation patterns in mangrove and climate change-related research from 1977 to 2021.</p>
Full article ">
24 pages, 1902 KiB  
Article
Expert-Based Assessment of the Potential of Non-Wood Forest Products to Diversify Forest Bioeconomy in Six European Regions
by Patrick Huber, Mikko Kurttila, Teppo Hujala, Bernhard Wolfslehner, Mariola Sanchez-Gonzalez, Maria Pasalodos-Tato, Sergio de-Miguel, José Antonio Bonet, Marlene Marques, Jose G. Borges, Cristian Mihai Enescu, Lucian Dinca and Harald Vacik
Forests 2023, 14(2), 420; https://doi.org/10.3390/f14020420 - 17 Feb 2023
Cited by 8 | Viewed by 2879
Abstract
The forest-based sector plays a significant role in supporting Europe on its pathway towards a more integrated and bio-based circular economy. Beyond the supply of timber, forest ecosystems offer a wide range of products and services beneficial to human wellbeing. Non-wood forest products [...] Read more.
The forest-based sector plays a significant role in supporting Europe on its pathway towards a more integrated and bio-based circular economy. Beyond the supply of timber, forest ecosystems offer a wide range of products and services beneficial to human wellbeing. Non-wood forest products (NWFPs) play an integral role in provisioning forest ecosystem services and constitute a huge portfolio of species from various taxonomic kingdoms. As diverse as the resources themselves is the list of end-products that may be derived from raw non-wood materials. Multiple value-chains of NWFPs provide benefits to actors across all stages of the supply chain. Forest management has not yet directed full attention towards NWFPs, since timber production remains the main management objective, although multi-purpose management is recognised as a key principle of the sector’s sustainability paradigm. Lack of knowledge of the socio-economic relevance of NWFPs for European societies and diverse property rights frameworks increase the complexity in forest-based decision making additionally. In this study, the future potential of 38 NWFPs for diversifying the forest bioeconomy is investigated by means of multi-criteria analysis, including stakeholder interaction and expert involvement. The results for six case studies in different biogeographical zones in Europe indicate the latent opportunities NWFPs provide to forest owners who are willing to focus their management on the joint production of wood and non-wood resources as well as their value networks. This study intends to unravel perspectives for forest owners in particular, as they often represent principal decision makers in forest ecosystem management, act as main suppliers of NWFP raw materials, and thus can be understood as key stakeholders in a forest bioeconomy. Even though regional perspectives differ, due to varying socio-economic and ecological environments, there is huge potential to strengthen the economic viability of rural areas. Furthermore, sustainable co-production may foster the ecological integrity of forest ecosystems across Europe. Results show that wild mushrooms constitute the most widespread opportunity to increase additional income from forest management, but the most promising NWFPs can be found in the tree product, understorey plant and animal origin categories. Full article
Show Figures

Figure 1

Figure 1
<p>Overview of the case studies in Europe and related biogeographical zones.</p>
Full article ">Figure 2
<p>Cross-case study analysis of the overall performance (i.e., sum of global priorities) of the four NWFP categories under the “equal” weighting scenario.</p>
Full article ">Figure 3
<p>PCA results for NWFPs indicating factor scores of their principal components (i.e., performance on the dimensions of “market novelty” and “resource potential”). Frames indicate clusters of NWFP categories (i.e., bold frame = low-cost/low-value, grey frame = high-cost/high-value).</p>
Full article ">
19 pages, 2404 KiB  
Article
Net-Carbon Dioxide Surplus as an Environmental Indicator for Supporting Timber Markets: A Case Study in Italy
by Francesco Carbone, Piermaria Corona, Majid Hussain and Francesco Barbarese
Forests 2023, 14(2), 419; https://doi.org/10.3390/f14020419 - 17 Feb 2023
Cited by 1 | Viewed by 2045
Abstract
Using the Life Cycle Assessment (LCA) approach, environmental benefits in terms of CO2 stored in chestnut wood in Italy have been calculated. Using one of the methodologies proposed under the LCA umbrella, a physical and formal balance sheet of CO2 has [...] Read more.
Using the Life Cycle Assessment (LCA) approach, environmental benefits in terms of CO2 stored in chestnut wood in Italy have been calculated. Using one of the methodologies proposed under the LCA umbrella, a physical and formal balance sheet of CO2 has been built. Chestnut forests (Castanea sativa Mill.) are one of the most critical forest types in Europe. They cover an area of 800,000 hectares in Italy, most of which are managed as coppices. Chestnut wood’s high-quality physical-chemical and mechanical characteristics and medium-long durability explains its widespread uses. In this case study a section of a public forest in Central Italy (Lazio Region) has been considered. In the section, during the rotation, two types of intervention were carried out: thinning at 19 years of age, and final cutting at the age of 32. A production of 416 and 93 m3ha−1 for final cutting and thinning, respectively, was recorded. The global amount of 507 m3 is the functional unit, which has stored 547,875 kgCO2. The combination of forest management and sawmill processing produces semi-finished chestnut timber products for 125 m3, which have a physical storage of 135,210 kgCO2. Using the formal balance sheet of CO2, total emissions from processing were recorded for a total of 27,766 kgCO2. At the exit of sawmill, products stored 107,444 kgCO2, which is the amount of Net-Carbon Dioxide Surplus (Net-CDS). Transportation from sawmill to market reduces the sequestered CO2 by 0.77 kgCO2/km. The Net-CDS represents a competitive advantage in the timber market. If tree species have the same physical, chemical, mechanical and price parameters, the timber consumer would prefer to buy wood with the highest Net-CDS. Full article
(This article belongs to the Special Issue Sustainable Utilization and Life Cycle Analysis of Forest Products)
Show Figures

Figure 1

Figure 1
<p>Chestnut growth and yield and wood fellings in the forest section considered in the case study.</p>
Full article ">Figure 2
<p>The supply chain of chestnut wood to the market of timber products. Legend: WWM: Workable Wood Material; MWM: Minor Wood Material; SFCT: Semi-Finished Chestnut Timber.</p>
Full article ">Figure 3
<p>Functional unit and flow of raw chestnut wood material.</p>
Full article ">Figure 4
<p>CO<sub>2</sub> emissions by types of actions.</p>
Full article ">Figure 5
<p>CO<sub>2</sub> emissions by types of sources.</p>
Full article ">Figure 6
<p>Reduction of Net-CDS of chestnut wood by the distance to the markets (1 = forest; 2 = forest temporary repository; 3 = sawmill; 4 = market of Rome; 5 = market of Florence; 6 = market of Bologna; 7 = market of Trento).</p>
Full article ">
8 pages, 3457 KiB  
Communication
Estimating Summer Arctic Warming Amplitude Relative to Pre-Industrial Levels Using Tree Rings
by Cong Gao, Chunming Shi, Yuxin Lou, Ran An, Cheng Sun, Guocan Wu, Yuandong Zhang, Miaogen Shen and Deliang Chen
Forests 2023, 14(2), 418; https://doi.org/10.3390/f14020418 - 17 Feb 2023
Viewed by 1648
Abstract
Estimating long-term trends and short-term amplitudes requires reliable temperature (Temp) observations in the pre-industrial period when few in situ observations existed in the Arctic. Tree-ring materials are most available and used to reconstruct past Arctic Temp variations. However, most previous studies incorporated materials [...] Read more.
Estimating long-term trends and short-term amplitudes requires reliable temperature (Temp) observations in the pre-industrial period when few in situ observations existed in the Arctic. Tree-ring materials are most available and used to reconstruct past Arctic Temp variations. However, most previous studies incorporated materials that are insensitive to local Temp variabilities. The derived reconstruction qualities are low (indicated by low calibration R2), and the uncertainties inherent in the various detrending methodologies are unknown. To reconstruct Arctic (N60°–N90°) summer (June–August) Temp in 1850–1900 and variations over the past centuries, we screened 1116 tree-ring width and tree-ring density records and applied four detrending functions (sf-RCS, RCS, MOD, and spline). In total, 338–396 records show significant correlations (p < 0.05) with the Climate Research Unit (CRU) Temp of the corresponding grid point. These records were selected and combined into a proxy record. The achieved Arctic summer Temp reconstruction explained 45–57% of the instrumental summer Temp variance since 1950. The 2012–2021 summer Arctic warming amplitudes (1.42–1.74 °C) estimated by Temp anomaly datasets extending back to 1850 are within the range derived from our reconstructions, despite using various detrending methods. These findings could suggest the Berkeley and HadCRU5 datasets interpolating Temp from a few (6–73) meteorological stations could still represent the mean Arctic Temp variation in 1850–1900, and the updated reconstruction can be used as a reliable reference for 1550–2007 Arctic summer Temp history. Full article
(This article belongs to the Special Issue Forest Climate Change Revealed by Tree Rings and Remote Sensing)
Show Figures

Figure 1

Figure 1
<p>The green, blue, yellow, and purple squares show sites with tree-ring width and density records showing significant (<span class="html-italic">p</span> &lt; 0.05) correlations with the CRU summer Temp of the corresponding grid point with sf-RCS, RCS, MOD, and spline detrending methods, respectively. The red and blue circles indicate the meteorological stations with Temp between 1875 and 1900 and before 1874 in the Arctic, respectively. The insert at the right bottom shows the number of meteorological stations from 1800 to 1900 in the Arctic.</p>
Full article ">Figure 2
<p>(<b>a</b>) Instrumental (CRU TS 4.06, blue line) and reconstructed (thin black line) Arctic summer Temp using sf-RCS detrending. Green shading is the 95% confidence interval. The green line is the number of tree-ring records combined for reconstruction, and the thick black line is the 30-year LOESS smoothing. The red dotted and thick red horizontal lines represent the mean values of the 1850–1900 reconstruction and 2012–2021 CRU summer Temp; the difference between the two values, represented by the summer Arctic warming amplitude, is denoted with transparent red bars and arrows. (<b>b</b>–<b>d</b>) The same as a but for reconstructions using RCS, MOD, and spline detrending. (<b>e</b>) Summer Temp anomalies relative to 1850–1900 for our reconstruction and instrumental Temp datasets.</p>
Full article ">
18 pages, 6915 KiB  
Article
Integrative Analysis of the Identified Transcriptome and Proteome Major Metabolism Pathways Involved in the Development of Grafted Apricot Hybrids
by Xiying Sun, Li Tian, Wanyu Xu, Luying Feng, Wenqing Jia, Yiteng Liu, Zhuo Chen, Shulin Zhang, Xianliang Zhang and Guangxin Ru
Forests 2023, 14(2), 417; https://doi.org/10.3390/f14020417 - 17 Feb 2023
Cited by 1 | Viewed by 1691
Abstract
Plant distant grafting can produce stable genetic variation, which is a new method for germplasm innovation. Two chimeras, peach/apricot (PA) and apricot/peach (AP), were created through two-way grafting between peach and apricot. The leaves, flowers and fruit phenotypes of chimeras were significantly different [...] Read more.
Plant distant grafting can produce stable genetic variation, which is a new method for germplasm innovation. Two chimeras, peach/apricot (PA) and apricot/peach (AP), were created through two-way grafting between peach and apricot. The leaves, flowers and fruit phenotypes of chimeras were significantly different to self-rooted rootstock. In order to investigate the causes of such changes, transcriptome and proteome integrative analyses were conducted on apricots from these two chimeras. Many differentially expressed genes (DEGs) and differentially expressed proteins (DEPs) that may be connected to the development of grafted apricot hybrids were identified and explored based on function. Moreover, we found 76 genes in forward-grafted PA and 46 in reverse-grafted AP that overlapped both in DEGs and DEPs (DEGs/DEPs) via transcriptome–proteome integrative analysis. Mapping the Kyoto Encyclopedia of Genes and Genomes (KEGG) pathway database in PA and AP, the top significant enrichment pathways of DEGs/DEPs included lipid metabolism (fatty acid elongation, cutin, suberine and wax biosynthesis, fatty acid degradation and alpha-linolenic acid metabolism) and carbohydrate metabolism (glycolysis/gluconeogenesis, starch and sucrose metabolism and galactose metabolism), revealing that lipid metabolism and carbohydrate metabolism may play an irreplaceable role in the development of grafted apricot hybrids. Taken together, this work uncovered numerous candidate transcripts and proteins involved in the development of grafted apricot hybrids. The molecular mechanisms provide new insights into this important process in other heterografting hybrids. Full article
(This article belongs to the Special Issue Non-timber Forestry Breeding, Cultivation and Processing Technology)
Show Figures

Figure 1

Figure 1
<p>Statistics and Venn diagrams of differentially expressed genes (DEGs) in all samples. (<b>A</b>) Statistic diagrams of DEGs; (<b>B</b>) Venn diagrams of DEGs.</p>
Full article ">Figure 2
<p>KEGG enrichment pathway analysis of differentially expressed genes (DEGs) in grafted apricot hybrids. (<b>A</b>) DEGs enriched in KEGG pathways in peach/apricot (PA); (<b>B</b>) DEGs enriched in KEGG pathways in apricot/peach (AP); (<b>C</b>) common DEGs enriched in KEGG pathways in peach/apricot (PA) and apricot/peach (AP).</p>
Full article ">Figure 2 Cont.
<p>KEGG enrichment pathway analysis of differentially expressed genes (DEGs) in grafted apricot hybrids. (<b>A</b>) DEGs enriched in KEGG pathways in peach/apricot (PA); (<b>B</b>) DEGs enriched in KEGG pathways in apricot/peach (AP); (<b>C</b>) common DEGs enriched in KEGG pathways in peach/apricot (PA) and apricot/peach (AP).</p>
Full article ">Figure 3
<p>Statistics and Venn diagrams of differentially expressed proteins (DEPs) in all samples. (<b>A</b>) Statistics diagrams of DEPs; (<b>B</b>) Venn diagrams of DEPs.</p>
Full article ">Figure 4
<p>KEGG enrichment pathway analysis of differentially expressed proteins (DEPs) in grafted apricot hybrids. (<b>A</b>) DEPs enriched in KEGG pathways in peach/apricot (PA); (<b>B</b>) DEPs enriched in KEGG pathways in apricot/peach (AP); (<b>C</b>) common DEPs enriched in KEGG pathways in peach/apricot (PA) and apricot/peach (AP).</p>
Full article ">Figure 4 Cont.
<p>KEGG enrichment pathway analysis of differentially expressed proteins (DEPs) in grafted apricot hybrids. (<b>A</b>) DEPs enriched in KEGG pathways in peach/apricot (PA); (<b>B</b>) DEPs enriched in KEGG pathways in apricot/peach (AP); (<b>C</b>) common DEPs enriched in KEGG pathways in peach/apricot (PA) and apricot/peach (AP).</p>
Full article ">Figure 5
<p>Venn diagrams of the differentially expressed genes (DEGs) and differentially expressed proteins (DEPs) of all samples. (<b>A</b>) Venn diagrams of DEGs and DEPs common to peach/apricot (PA); (<b>B</b>) Venn diagrams of DEGs and DEPs common to apricot/peach (AP).</p>
Full article ">Figure 6
<p>GO term analysis of differentially expressed genes (DEGs) and differentially expressed proteins (DEPs) in grafted apricot hybrids. (<b>A</b>) DEGs/DEPs enriched in GO terms in peach/apricot (PA); (<b>B</b>) DEGs/DEPs enriched in GO terms in apricot/peach (AP).</p>
Full article ">Figure 7
<p>KEGG enrichment analysis of gene and protein association in grafted apricot hybrids. (<b>A</b>) Differentially expressed genes (DEGs) and differentially expressed proteins (DEPs) enriched in KEGG pathways in peach/apricot (PA); (<b>B</b>) DEGs/DEPs enriched in KEGG pathways in apricot/peach (AP).</p>
Full article ">Figure 8
<p>qRT-PCR analysis of peach/apricot (PA) and apricot/peach (AP). (<b>A</b>) qRT-PCR analysis of the relative expression levels of 11 DEGs in the PA; (<b>B</b>) qRT-PCR analysis of the relative expression levels of 12 DEGs in the AP.</p>
Full article ">Figure 9
<p>Transcriptome and proteome pathway maps for the grafted apricot hybrids based on KEGG enrichment. The blue box indicates the transcriptome, and the orange box indicates the proteome.</p>
Full article ">
15 pages, 3783 KiB  
Article
Transcriptome Analysis Reveals the Central Role of the Transcription Factor MYB in Regulating Anthocyanin Accumulation in Economic Grape Species (Vitis vinifera)
by Ling Su, Meng Qi, Dong Meng, Qing Yang, Yongmei Wang, Fengshan Ren, Liying Yang, Yingchun Chen, Liyuan Liu, Meiling Tang, Yangbo Song and Lei Gong
Forests 2023, 14(2), 416; https://doi.org/10.3390/f14020416 - 17 Feb 2023
Viewed by 1918
Abstract
To cultivate different grape varieties according to market needs, it is necessary to study the regulation mechanism of color changes in different development stages of grapes. In this study, RNA-sequencing (RNA-Seq) technology was used to compare and analyze the transcriptome data of four [...] Read more.
To cultivate different grape varieties according to market needs, it is necessary to study the regulation mechanism of color changes in different development stages of grapes. In this study, RNA-sequencing (RNA-Seq) technology was used to compare and analyze the transcriptome data of four grape varieties at the same development stage. Among the annotated differential genes, the anthocyanin synthesis pathway in the flavonoid pathway was mainly studied. Further RT-qPCR analysis of key enzyme genes, in the flavonoid synthesis pathway of the anthocyanin metabolism pathway, showed that the MYB transcription factor family had binding sites at the start of the four enzyme genes. The relative expression of the MYB transcription factor and enzyme gene in the transcriptome data was verified by reverse transcription polymerase chain reaction. Subcellular localization and gene function verification of the transcription factor MYB2 confirmed its regulatory role in anthocyanins. Full article
(This article belongs to the Section Genetics and Molecular Biology)
Show Figures

Figure 1

Figure 1
<p>Phenological and physiological indicators. (<b>A</b>) Single strings and single-tree forms of grape varieties. Bar = 1 cm. (<b>B</b>) Single fruit weight of grapes. (<b>C</b>) Anthocyanin content of grapes. Error bars show the standard error of the mean (SEM; n = three biological replicates). * <span class="html-italic">p</span> &lt; 0.05 (Student’s <span class="html-italic">t</span>-test).</p>
Full article ">Figure 2
<p>Summary statistics for grape transcription group data. (<b>A</b>) Venn graph shows the number of genes and relationships that differ in the comparisons. (<b>B</b>) MA plots for three comparisons. (<b>C</b>) GO enrichment regarding the biological processes, cellular components, and molecular functions. (<b>D</b>) Statistics of pathway enrichment.</p>
Full article ">Figure 3
<p>Expression trends and screening of enzyme genes in flavonoid synthesis pathway. Darker color represents higher expression. Heat maps show, from left to right, expressions of ‘Rose fragrance’, ‘Vineyard Queen’, ‘Princess rose’, and ‘Emerald rose’. Different rows represent homologous genes of genes.</p>
Full article ">Figure 4
<p>Related transcription factor filtering. (<b>A</b>) Individual quantities of differential transcription factors for four grape varieties. (<b>B</b>) Binding site of a transcription factor to pre-2000 bp in the enzyme gene promoter. (<b>C</b>) Heat map of differentially expressed genes.</p>
Full article ">Figure 5
<p>Relative expression of enzyme genes and transcription factors. (<b>A</b>) VvANS; (<b>B</b>) VvCYP75A; (<b>C</b>) VvCYP75B1; (<b>D</b>) VvHCT; (<b>E</b>) VvMYB86; (<b>F</b>) VvMYB2; (<b>G</b>) VvMYB4 (VIT_04s0023g03710); (<b>H</b>) VvGAMYB. Different lowercase letters indicate significant differences (<span class="html-italic">p</span> &lt; 0.05); n = 3.</p>
Full article ">Figure 6
<p>(<b>A</b>) Subcellular localization of VvMYB2. (<b>B</b>) Instantaneous transformation of VvMYB2 in grape callus and statistics of color change. Bar = 1 cm.</p>
Full article ">Figure 7
<p>General mechanism of anthocyanin biosynthesis. Solid lines between MYB2, GAMYB, and MYB86 and the start of the gene promoter indicate that these transcription factors may be able to bind to the three genes and affect gene function. The solid line on the right shows the order in which the genes influence each other; the ultimate goal is to influence the phenotype of grapes by affecting anthocyanin synthesis.</p>
Full article ">
18 pages, 3749 KiB  
Article
YOLO-Tea: A Tea Disease Detection Model Improved by YOLOv5
by Zhenyang Xue, Renjie Xu, Di Bai and Haifeng Lin
Forests 2023, 14(2), 415; https://doi.org/10.3390/f14020415 - 17 Feb 2023
Cited by 68 | Viewed by 8275
Abstract
Diseases and insect pests of tea leaves cause huge economic losses to the tea industry every year, so the accurate identification of them is significant. Convolutional neural networks (CNNs) can automatically extract features from images of tea leaves suffering from insect and disease [...] Read more.
Diseases and insect pests of tea leaves cause huge economic losses to the tea industry every year, so the accurate identification of them is significant. Convolutional neural networks (CNNs) can automatically extract features from images of tea leaves suffering from insect and disease infestation. However, photographs of tea tree leaves taken in a natural environment have problems such as leaf shading, illumination, and small-sized objects. Affected by these problems, traditional CNNs cannot have a satisfactory recognition performance. To address this challenge, we propose YOLO-Tea, an improved model based on You Only Look Once version 5 (YOLOv5). Firstly, we integrated self-attention and convolution (ACmix), and convolutional block attention module (CBAM) to YOLOv5 to allow our proposed model to better focus on tea tree leaf diseases and insect pests. Secondly, to enhance the feature extraction capability of our model, we replaced the spatial pyramid pooling fast (SPPF) module in the original YOLOv5 with the receptive field block (RFB) module. Finally, we reduced the resource consumption of our model by incorporating a global context network (GCNet). This is essential especially when the model operates on resource-constrained edge devices. When compared to YOLOv5s, our proposed YOLO-Tea improved by 0.3%–15.0% over all test data. YOLO-Tea’s AP0.5, APTLB, and APGMB outperformed Faster R-CNN and SSD by 5.5%, 1.8%, 7.0% and 7.7%, 7.8%, 5.2%. YOLO-Tea has shown its promising potential to be applied in real-world tree disease detection systems. Full article
Show Figures

Figure 1

Figure 1
<p>Some representative samples of our dataset. (<b>a</b>) Tea leaf blight; (<b>b</b>) tea leaf blight; (<b>c</b>) green mirid bug; (<b>d</b>) green mirid bug.</p>
Full article ">Figure 2
<p>Structure picture of YOLOv5s-6.1.</p>
Full article ">Figure 3
<p>The details of CBAM. (<b>a</b>) The structure of CAM. (<b>b</b>) The structure of SAM. (<b>c</b>) The structure of CBAM.</p>
Full article ">Figure 4
<p>The structure of ACmix.</p>
Full article ">Figure 5
<p>The structure of RFB.</p>
Full article ">Figure 6
<p>The methods for integrating GCNet. (<b>a</b>) The structure of GCNet. (<b>b</b>)The CSP1 structure of the fused GCNet.</p>
Full article ">Figure 7
<p>The structure of YOLO-Tea.</p>
Full article ">Figure 8
<p>The precision–recall curves of the results.</p>
Full article ">Figure 9
<p>Comparison of model detection results. (<b>a</b>) YOLOv5's detection results. (<b>b</b>) YOLOv5-Tea’s detection results. (<b>c</b>) YOLOv5's detection results. (<b>d</b>) YOLOv5-Tea’s detection results.</p>
Full article ">Figure 10
<p>Comparison of model detection results. (<b>a</b>) YOLOv5's detection results. (<b>b</b>) YOLOv5-Tea’s detection results. (<b>c</b>) YOLOv5's detection results. (<b>d</b>) YOLOv5-Tea’s detection results.</p>
Full article ">
14 pages, 17326 KiB  
Article
Design of Decorative Wooden Wall Panels from Sliced Pedunculate Slavonian Oak (Quercus robur L.) from Veneer Production Residue
by Domagoj Mamić and Danijela Domljan
Forests 2023, 14(2), 414; https://doi.org/10.3390/f14020414 - 17 Feb 2023
Cited by 3 | Viewed by 2107
Abstract
The growing awareness of nature conservation encourages producers, engineers, and designers to contribute to the rational and innovative use of raw materials. Sustainable development is imperative, symbolizing the balance between meeting the needs of the present generations without compromising the needs of future [...] Read more.
The growing awareness of nature conservation encourages producers, engineers, and designers to contribute to the rational and innovative use of raw materials. Sustainable development is imperative, symbolizing the balance between meeting the needs of the present generations without compromising the needs of future ones. The aim of this paper is to investigate the production process of cut veneer of Pedunculate Slavonian oak (Quercus robur L.) and which parts of the logs are lost or thrown in the production of cut veneer, to analyze the increase in the use of veneers that currently represent residue in processing, and to propose directions of designing a new product from the analyzed residue—decorative wall panels. The research was conducted in the company Spačva Ltd. in Vinkovci, Vukovar-Srijem County, Croatia, in 2021/2022. The findings emphasize that the vast majority of unused veneers, considered technologically unacceptable in the production process, can be decoratively and visually desirable due to their natural appearance in the design of a new product. By analyzing and applying the design principles and elements, natural phenomena were applied to the veneers that represent the basic motif of the new decorative wall panels. The initial solutions of the decorative wall coverings made of veneer with a natural appearance and the solution from other wood residues from production are shown. The results of this study have potentially far-reaching implications for wood product manufacturers and demonstrate the importance of applying design in wood technology to reduce residue, demonstrating that residue from standard production can be designed into an innovative, sustainable product that reduces environmental damage. Full article
(This article belongs to the Special Issue The Role of New Wood Products for Forest Industry)
Show Figures

Figure 1

Figure 1
<p>Veneer cutting methods (© Domagoj Mamić, 2022).</p>
Full article ">Figure 2
<p>Rift cut veneer production in Spačva Ltd. (© Domagoj Mamić, 2021).</p>
Full article ">Figure 3
<p>3D visualization example of decorative wall panel from veneer residue joined by sewing, type A (© Domagoj Mamić, 2022).</p>
Full article ">Figure 4
<p>Design of a decorative wall panel from veneer residue created by multi-layer pressing and gluing (© Domagoj Mamić, 2022).</p>
Full article ">Figure 5
<p>3D Visualization example of decorative wooden wall panel from veneer residue created by multi-layer pressing and gluing (© Domagoj Mamić, 2022).</p>
Full article ">Figure 6
<p>Back board from rift cut veneer production (© Domagoj Mamić, 2021).</p>
Full article ">Figure 7
<p>Back board factory residue (© Domagoj Mamić, 2022).</p>
Full article ">Figure 8
<p>Design of a decorative wooden wall panel from back board residue (© Domagoj Mamić, 2022).</p>
Full article ">Figure 9
<p>3D Visualization example of a decorative wooden wall panel created from back board residue (© Domagoj Mamić, 2022).</p>
Full article ">
25 pages, 5513 KiB  
Article
Assessing Phenological Shifts of Deciduous Forests in Turkey under Climate Change: An Assessment for Fagus orientalis with Daily MODIS Data for 19 Years
by Tuğçe Şenel, Oğuzhan Kanmaz, Filiz Bektas Balcik, Meral Avcı and H. Nüzhet Dalfes
Forests 2023, 14(2), 413; https://doi.org/10.3390/f14020413 - 17 Feb 2023
Cited by 1 | Viewed by 2762
Abstract
Understanding how natural ecosystems are and will be responding to climate change is one of the primary goals of ecological research. Plant phenology is accepted as one of the most sensitive bioindicators of climate change due to its strong interactions with climate dynamics, [...] Read more.
Understanding how natural ecosystems are and will be responding to climate change is one of the primary goals of ecological research. Plant phenology is accepted as one of the most sensitive bioindicators of climate change due to its strong interactions with climate dynamics, and a vast number of studies from all around the world present evidence considering phenological shifts as a response to climatic changes. Land surface phenology (LSP) is also a valuable tool in the absence of observational phenology data for monitoring the aforementioned shift responses. Our aim was to investigate the phenological shifts of Fagus orientalis forests in Turkey by means of daily MODIS surface reflectance data (MOD09GA) for the period between 2002 and 2020. The normalized difference vegetation index (NDVI) was calculated for the entire Turkey extent. This extent was then masked for F. orientalis. These “Fagus pixels” were then filtered by a minimum of 80% spatial and an annual 20% temporal coverage. A combination of two methods was applied to the time series for smoothing and reconstruction and the start of season (SOS), end of season, and length of season parameters were extracted. Trends in these parameters over the 19-year period were analyzed. The results were in concert with the commonly reported earlier SOS pattern, by a Sen’s slope of −0.8 days year−1. Lastly, the relationships between SOS and mean, maximum and minimum temperature, growing degree days (GDD), and chilling hours (CH) were investigated. Results showed that the most significant correlations were found between the mean SOS trend and accumulated CH and accumulated GDD with a base temperature of 2 °C, both for the February–March interval. The immediate need for a phenological observation network in Turkey and its region is discussed. Full article
(This article belongs to the Special Issue Mapping Forest Vegetation via Remote Sensing Tools)
Show Figures

Figure 1

Figure 1
<p>The flowchart of the study.</p>
Full article ">Figure 2
<p>Initial distribution of all pure <span class="html-italic">F. orientalis</span> stand pixels before temporal and spatial masking (shown in green).</p>
Full article ">Figure 3
<p>Mean raw NDVI time series (black lines), mean fitted curve (blue lines), and mean SOS dates of individual years (green lines) over the study period (2002–2020).</p>
Full article ">Figure 4
<p>SOS trend directions and significance of individual pixels over the study period (2002–2020).</p>
Full article ">Figure 5
<p>Distributions of multi-annual mean (<b>a</b>) SOS and (<b>b</b>) EOS dates, and (<b>c</b>) LOS over the study period (2002–2020).</p>
Full article ">Figure 6
<p>Correlations between multi-annual mean of SOS, EOS, and LOS of individual pixels and altitude (<b>a</b>, <b>b</b> and <b>c</b> respectively) and latitude (<b>d</b>, <b>e</b> and <b>f</b> respectively) and correlations between the shifts (Sen’s slope) in SOS, EOS and LOS of individual pixels and altitude (<b>g</b>, <b>h</b> and <b>i</b> respectively) and latitude (<b>j</b>, <b>k</b> and <b>l</b> respectively). Blue color in (<b>j</b>) remarks the correlation between SOS shift and latitude for the pixels between 39° N and 42° N while black color includes all pixels in study area.</p>
Full article ">Figure 7
<p>Respective altitudes of study pixels (<b>a</b>) and latitudinal distribution of respective altitudes of study pixels (<b>b</b>).</p>
Full article ">Figure 8
<p>Trends of individual pixels for (<b>a</b>) SOS, (<b>b</b>) EOS, and (<b>c</b>) LOS.</p>
Full article ">Figure 9
<p>Trends of annual mean (<b>a</b>) SOS and (<b>b</b>) EOS dates, and (<b>c</b>) LOS over the study period (2002–2020) and their Sen’s slope estimations.</p>
Full article ">Figure 10
<p>Significant correlations between the mean SOS trend and temperature-derived variables/intervals (*** <span class="html-italic">p</span> &lt; 0.01, ** <span class="html-italic">p</span> &lt; 0.05) ranked by correlation coefficients. CH = chill hours; GDD = growing degree days; D, J, F, M, and A stand for December, January, February, March, and April, respectively. Colored lines signify monthly intervals as line length shows the months included in the interval and colors show variable type as blue = CH, green = GDD, red = T<sub>mean</sub>.</p>
Full article ">Figure 11
<p>Plots of significant correlations between the mean SOS trend and temperature-derived variable/intervals (<b>a</b>–<b>j</b>). CH = chill hours; GDD = growing degree days; D, J, F, M, and A stand for December, January, February, March, and April, respectively.</p>
Full article ">Figure 12
<p>Superimposed plots of the mean SOS trend and significantly correlated climate variables/intervals over the study period (2002–2020). CH = chill hours; GDD = growing degree days; D, J, F, M, and A stand for December, January, February, March, and April, respectively.</p>
Full article ">
15 pages, 3239 KiB  
Article
Evidence for 40 Years of Treeline Shift in a Central Alpine Valley
by Esther R. Frei, Ignacio Barbeito, Lisa M. Erdle, Elisabeth Leibold and Peter Bebi
Forests 2023, 14(2), 412; https://doi.org/10.3390/f14020412 - 17 Feb 2023
Cited by 4 | Viewed by 2358
Abstract
Alpine treeline ecosystems are generally expected to advance with increasing temperatures and after land-use abandonment. Multiple interacting factors modify this trend. Understanding the long-term processes underlying treeline advance is essential to predict future changes in structure and function of mountain ecosystems. In a [...] Read more.
Alpine treeline ecosystems are generally expected to advance with increasing temperatures and after land-use abandonment. Multiple interacting factors modify this trend. Understanding the long-term processes underlying treeline advance is essential to predict future changes in structure and function of mountain ecosystems. In a valley in the Central Swiss Alps, we re-assessed a 40-year-old survey of all treeline trees (>0.5 m height) and disentangled climate, topographical, biotic, and disturbance (land use and avalanche risk) factors that have led to treeline advance with a combination of ground-based mapping, decision tree, and dendroecological analyses. Between the first ground survey in 1972/73 and the resurvey in 2012, treeline advanced on average by 10 meters per decade with a maximum local advance of 42 meters per decade. Larch consistently advanced more on south-facing slopes, while pine advance was greater on north-facing slopes. Newly established spruce mostly represented infilling below the previous treeline. The forefront of treeline advance above 2330 m a.s.l. occurred mainly on favorable microsites without competing dwarf shrub vegetation. At slightly lower elevations, treeline advanced mainly on sites that were used for agriculture at the beginning of the 20th century. This study indicates that although treeline advances under the effect of climate warming, a combination of additional ecological factors controls this advance at regional and local scales. Full article
Show Figures

Figure 1

Figure 1
<p>Upper panel: forest change in the study region derived from terrestrial mapping of trees and tree groups at treeline. A moving window analysis was used to discriminate between treeline advance and infilling below treeline. Light green circles represent trees or tree groups that were already present in the treeline ecotone in the 1972 survey. Red triangles represent individual trees and tree groups classified as advance, and dark green circles are trees and tree groups classified as infilling. Classification was calculated at a 50 m pixel resolution using a neighborhood elevation analysis comparing position of trees and tree groups in 2012 (dark green and red symbols) to 1972 (light green circles). Lower panel: classification of the trees and tree groups that established in the time interval between the two surveys (1972–2012). Bars represent the number of raster cells with trees classified as advance or infilling on the two valley slopes separated by species.</p>
Full article ">Figure 2
<p>Mean annual air temperature at 2 m height (1900–2022) at the MeteoSwiss weather station in Davos at 1594 m a.s.l. The dashed horizontal line represents the corresponding value for the climate norm period 1981–2010 (source: MeteoSwiss).</p>
Full article ">Figure 3
<p>Distance of treeline advance (1972–2012) for north- and south-facing aspects (left and right panels, respectively) separated by the three study species. Distances were computed as the elevational difference between trees classified as tree advance (2012) and the nearest raster cell (1972) of trees recorded in the first field survey. No confidence intervals have been plotted for <span class="html-italic">Picea</span> advance on the north-facing slope due to the extremely small sample size.</p>
Full article ">Figure 4
<p>Tree age above (<b>upper panel</b>) and below (<b>lower panel</b>) the 1972 treeline based on dendrochronological analysis of a subsample of trees on both south- and north-facing valley slopes. Number of sampled trees above treeline: <span class="html-italic">Picea</span> (N = 9), <span class="html-italic">Larix</span> (N = 56), <span class="html-italic">Pinus</span> (N = 15) and below treeline: <span class="html-italic">Picea</span> (N = 29), <span class="html-italic">Larix</span> (N = 16), <span class="html-italic">Pinus</span> (N = 31).</p>
Full article ">Figure 5
<p>Decision tree showing the ecological factors that significantly influenced treeline advance between 1972 and 2012. The analysis was based on 164 raster cells classified as advance and 164 randomly chosen raster cells without advancing trees.</p>
Full article ">
17 pages, 2492 KiB  
Article
Forest Structure and Fine Root Biomass Influence Soil CO2 Efflux in Temperate Forests under Drought
by Antonios Apostolakis, Ingo Schöning, Beate Michalzik, Christian Ammer, Peter Schall, Falk Hänsel, Thomas Nauss, Susan Trumbore and Marion Schrumpf
Forests 2023, 14(2), 411; https://doi.org/10.3390/f14020411 - 17 Feb 2023
Cited by 1 | Viewed by 2059
Abstract
Soil respiration is rarely studied at the landscape scale where forest and soil properties can be important drivers. We performed forest and soil inventories in 150 temperate forest sites in three German landscapes and measured in situ soil CO2 efflux with the [...] Read more.
Soil respiration is rarely studied at the landscape scale where forest and soil properties can be important drivers. We performed forest and soil inventories in 150 temperate forest sites in three German landscapes and measured in situ soil CO2 efflux with the soda-lime method in early summer 2018 and 2019. Both years were affected by naturally occurring summer droughts. Our aim was to investigate the impact of forest structural and compositional properties, soil properties and climate on soil CO2 efflux at the landscape. Forest properties explained a large portion of soil CO2 efflux variance (i.e., 14% in 2018 and 20% in 2019), which was comparable or larger than the portion explained by soil properties (i.e., 15% in 2018 and 6% in 2019), and much larger than that of climate. Using Structural Equation Modeling, we found that forest structural properties, i.e., tree density and basal area, were negatively linked to soil CO2 efflux, while forest composition, i.e., conifer share and tree species richness, was not important. Forest structure effects on soil CO2 efflux were either direct or mediated by fine root biomass under dry summer conditions. Summer soil CO2 efflux was positively linked to fine root biomass but not related to total soil organic carbon stocks or climate. Forest structural properties influence soil CO2 efflux under drought events and should be considered when predicting soil respiration at the landscape scale. Full article
(This article belongs to the Section Forest Soil)
Show Figures

Figure 1

Figure 1
<p>Sketch of the soda-lime method with an open and static chamber (after Apostolakis et al. [<a href="#B33-forests-14-00411" class="html-bibr">33</a>]). A PVC ring (1) of 12 cm is inserted to the soil down to 2 cm. A PVC lid (2) is placed over the PVC ring and a plastic O-ring (3) ensures the airtightness of the chamber. The color of the PVC ring and lid was orange brown. A plastic tube (4), which is glued on the PVC lid with CO<sub>2</sub>-impermeable silicon, passes through the PVC lid. This tube provides a flow-channel between the headspace of the chamber and ambient atmosphere and, thus, pressure equilibrium between the two. In line with the plastic tube, a syringe (5) with 4 holes of a diameter of 1 mm is placed out of the chamber. This syringe contains soda-lime granules to prevent atmospheric CO<sub>2</sub> from entering the headspace of the chamber. Inside the chamber, a syringe (6) with 64 holes (1 mm diameter) is held from a hook and contains soda-lime granules for the determination of soil CO<sub>2</sub> efflux.</p>
Full article ">Figure 2
<p>(<b>a</b>) Soil temperature, (<b>b</b>) volumetric water content and (<b>c</b>) in situ soil CO<sub>2</sub> efflux from the forest sites of the Biodiversity Exploratories project (i.e., 50 forest sites in ALB, 50 in SCH and 49 in HAI) in 2018 and 2019. Bars represent mean values, and the error bars represent standard deviations. Upper case letters indicate differences among the study regions in 2018 and lower case letters indicate differences in 2019. Asterisks indicate differences between the years for a given study region.</p>
Full article ">Figure 3
<p>Total and mineral in situ soil CO<sub>2</sub> efflux for a subset of 29 forest sites out of the 150 forest sites of the Biodiversity Exploratories project. Bars represent mean values, and the error bars represent standard deviations. Lower case letters indicate differences between total and mineral soil CO<sub>2</sub> efflux for a given study region in 2019. Asterisks indicate significant differences between the years for a given study region.</p>
Full article ">Figure 4
<p>Soil CO<sub>2</sub> efflux variance partitioning among forest properties (stand age, basal area, mean breast height diameter, tree density, conifer share, tree species diversity and fine root biomass), soil properties (organic layer and mineral soil OC stock, soil C:N ratio, silt content and pH) and soil climate (soil temperature and volumetric water content) for the two sampling campaigns in 2018 and in 2019.</p>
Full article ">Figure 5
<p>Structural equation models of soil CO<sub>2</sub> efflux measured (<b>a</b>) in 2018 and (<b>b</b>) in 2019 and (<b>c</b>) net effects. Mediation variables include fine root biomass, volumetric water content and total soil organic carbon stocks (mineral soil OC and organic layer stocks). Number of observations (n), degrees of freedom (df), fitness statistics (<span class="html-italic">p</span>-value, RMSEA) and standardized path coefficients and their significance level are given. Single-headed arrows represent direct paths and double-headed arrows represent covariances. Solid blue arrows represent positive associations, and dashed red arrows represent negative associations. Thin arrows represent associations with <span class="html-italic">p</span> &lt; 0.050 (*), medium-width arrows represent <span class="html-italic">p</span> &lt; 0.010 (**) and thick arrows represent <span class="html-italic">p</span> &lt; 0.001 (***). Coefficients of determination are given for soil CO<sub>2</sub> efflux.</p>
Full article ">
16 pages, 7407 KiB  
Article
Transcriptome Identification of R2R3-MYB Gene Family Members in Pinus massoniana and PmMYB4 Response to Drought Stress
by Xuan Lou, Sheng Yao, Peizhen Chen, Dengbao Wang, Romaric Hippolyte Agassin, Yanqing Hou, Chi Zhang and Kongshu Ji
Forests 2023, 14(2), 410; https://doi.org/10.3390/f14020410 - 16 Feb 2023
Cited by 7 | Viewed by 2864
Abstract
One of the largest families of transcription factors in plants, the MYB transcription factors family (Myeloblastosis, MYB TF), plays a vital role in regulating plant biochemical and physiological processes. The role of MYB TF in coping with stresses, such as drought, salt and [...] Read more.
One of the largest families of transcription factors in plants, the MYB transcription factors family (Myeloblastosis, MYB TF), plays a vital role in regulating plant biochemical and physiological processes. The role of MYB TF in coping with stresses, such as drought, salt and cold, has been reported. Unfortunately, a comprehensive identification of R2R3-MYB TF in Masson pine (Pinus massoniana) has not been achieved. In this study, a total of 49 sequences were identified as R2R3-MYB TF. The structure, function and phylogenetic relationships of the conserved structural domains of Masson pine R2R3-MYB TF and Populus trichocarpa Torr. & A.Gray ex Hook. TFs were compared using bioinformatics tools. The results showed that Masson pine R2R3-MYB TF was divided into 24 groups, mainly located in the nucleus, and mostly lacking signal peptides and transmembrane structural domains with multiple phosphorylation sites. The drought stress-responsive R2R3-MYB gene, PmMYB4, was selected from the drought stress transcriptome based on analysis of the expression pattern and tissue specificity of PmMYB4 gene under abiotic stress using qPCR. The results showed that PmMYB4 can be involved in drought stress treatment through ABA signaling, as well as in multiple stress responses such as salt stress, and there were significant differences in the expression of PmMYB4 in the eight tissues. These results provide a reference scheme for the functional identification of R2R3-MYB transcription factors, which may be involved in plant responses to multiple stresses such as drought, and enrich our understanding of the functions of R2R3-MYB transcription factors in plants. Full article
(This article belongs to the Section Genetics and Molecular Biology)
Show Figures

Figure 1

Figure 1
<p>Protein domain analysis of R2R3-MYB in Masson pine. The red lines are the R2 domain, and the green lines are the R3 domain.</p>
Full article ">Figure 2
<p>Analysis of conserved motif elements of Masson pine R2R3-MYB TFs.</p>
Full article ">Figure 3
<p>Phylogenetic analysis of the R2R3-MYB TF family in Masson pine and <span class="html-italic">Populus trichocarpa</span>. Different background colors and strips are used to distinguish groups. The red asterisks represent Masson pine R2R3-MYB TFs, and the white background refers to hairy poplar R2R3-MYB only, without Masson pine R2R3-MYB is included; blue dots represent unclassified Masson pine R2R3-MYB TFs.</p>
Full article ">Figure 4
<p>Heat map of differential expressions of Masson pine <span class="html-italic">MYB</span>s in drought stress. The horizontal coordinates T1, T2, T3, T4 indicated the water supply strength, which were 80% (±5%), 65% (±5%), 50% (±5%), and 35% (±5%), and the ordinate was gene ID. Yellow indicates positive expressions; darker yellow circles indicate higher expression levels. Blue is negative; darker blue circles indicate lower expression.</p>
Full article ">Figure 5
<p>Expression profiles of <span class="html-italic">PmMYB4</span> under 15% PEG<sub>6000</sub> mimicing drought stress. Gene expression at 0 h was set to the control value 1. <span class="html-italic">X</span>-axis: 0 h, 3 h, 6 h, 12 h and 24 h are stress durations; <span class="html-italic">Y</span>-axis: relative expression. Data in the figure are presented as mean ± standard deviation (<span class="html-italic">n</span> = 3). The different letters above the bars represent significant differences (<span class="html-italic">p</span> &lt; 0.05).</p>
Full article ">Figure 6
<p>The subcellular localization of <span class="html-italic">PmMYB4.</span> (<b>a</b>) GFP, green represents the nucleus of the cell; (<b>b</b>) DAPI, blue represents the nucleus of the cell; (<b>c</b>) bright field; (<b>d</b>) merged, the overlap point is the nucleus.</p>
Full article ">Figure 7
<p>Growth of recombinant bacteria (TransB/pET28a-<span class="html-italic">PmMYB4</span>) and control bacteria (TransB/pET28a) on solid LB medium.</p>
Full article ">Figure 8
<p>Gene expression patterns of <span class="html-italic">PmMYB4</span>. The expression level in the flower was set to the value 1. <span class="html-italic">X</span>-axis: F, flower; R, root; P, phloem; X, xylem; OL, old leaves; YS, young leaves; OS, old stems; YS, young stem. <span class="html-italic">Y</span>-axis: relative expression. Data in the figure are presented as mean ± standard deviation (<span class="html-italic">n</span> = 3). The different letters above the bars represent significant differences (<span class="html-italic">p</span> &lt; 0.05).</p>
Full article ">Figure 9
<p>Cis-acting element analysis of <span class="html-italic">PmMYB4</span>.</p>
Full article ">Figure 10
<p>Analysis of <span class="html-italic">PmMYB4</span> gene expression under different stress. Gene expression at 0 h was set to the control value 1. <span class="html-italic">X</span>-axis: 0 h, 3 h, 6 h, 12 h and 24 h are stress durations; <span class="html-italic">Y</span>-axis: relative expression. Data in the figure are presented as mean ± standard deviation (<span class="html-italic">n</span> = 3). The different letters above the bars represent significant differences (<span class="html-italic">p</span> &lt; 0.05).</p>
Full article ">
14 pages, 12407 KiB  
Article
Reinforcement of Timber Dowel-Type Connections Using Self-Tapping Screws and the Influence of Thread Configurations
by Cong Zhang, Hao-Yu Huang, Xiong-Yan Li, Su-Duo Xue, Wen-Shao Chang and Guo-Jun Sun
Forests 2023, 14(2), 409; https://doi.org/10.3390/f14020409 - 16 Feb 2023
Cited by 1 | Viewed by 1984
Abstract
The application of self-tapping screws as reinforcement on glulam connections has been proven effective. However, the implication of different thread configurations on the effectiveness of reinforcement remains unknown. This paper conducted experiments using screws with various thread configurations in embedment-strength tests and tensile [...] Read more.
The application of self-tapping screws as reinforcement on glulam connections has been proven effective. However, the implication of different thread configurations on the effectiveness of reinforcement remains unknown. This paper conducted experiments using screws with various thread configurations in embedment-strength tests and tensile connection tests. Results show that self-tapping screws with one third of thread achieved similar improvement in the embedment strength and mechanical properties of connections as fully threaded screws. This implies that properly reducing the thread length on self-tapping screws ensures easier screw installation than using fully threaded screws. The influence of screw-to-dowel distance was also investigated and two distances (0.5 d and 1 d) were adopted, with ‘d’ being the diameter of the dowel. The difference in embedment strength due to different screw-to-dowel distances was insignificant. The group with screws placed in contact (0.5 d) with the dowel achieved 5% higher embedment strength than the group with screws placed at a 1 d distance. The connection tests showed good agreement with the embedment-strength tests. This confirms that self-tapping screws with reduced thread can enhance the load-carrying capacity and ductility of connections to a level similar to connections reinforced by fully threaded screws. Full article
(This article belongs to the Special Issue Application of Glulam Beams in Wood Building Industry)
Show Figures

Figure 1

Figure 1
<p>Flange-head partially threaded self-tapping screw used in this study.</p>
Full article ">Figure 2
<p>Embedment-strength test set-up.</p>
Full article ">Figure 3
<p>Screws with different thread lengths.</p>
Full article ">Figure 4
<p>Specimen set-up (<b>left</b>) and dimensions for the specimen (<b>right</b>).</p>
Full article ">Figure 5
<p>Screw types and corresponding group assignment.</p>
Full article ">Figure 6
<p>Camera captured the crack propagation on the surface of a reinforced specimen.</p>
Full article ">Figure 7
<p>Embedment of screw head of a part of specimens from each group.</p>
Full article ">Figure 8
<p>Specimens from each reinforced group after the embedment-strength test: high level of deformation of screw and embedment of screw head can be seen in groups S, BS, ES and TTS [<a href="#B31-forests-14-00409" class="html-bibr">31</a>].</p>
Full article ">Figure 9
<p>Load-displacement curves for embedment-strength tests.</p>
Full article ">Figure 10
<p>Load-displacement curves for each group in this study.</p>
Full article ">Figure 11
<p>Timber members of connection specimens after failure showing deformation of screws. Top: connections reinforced by screws with complete thread (SFC). Bottom: connections reinforced by screws with 33% thread on the point end (SPC) [<a href="#B31-forests-14-00409" class="html-bibr">31</a>].</p>
Full article ">Figure 12
<p>Demonstration of specimen failures in each group.</p>
Full article ">
Previous Issue
Next Issue
Back to TopTop