[go: up one dir, main page]

Next Issue
Volume 24, September-1
Previous Issue
Volume 24, August-1
 
 
ijms-logo

Journal Browser

Journal Browser

Int. J. Mol. Sci., Volume 24, Issue 16 (August-2 2023) – 493 articles

Cover Story (view full-size image): 
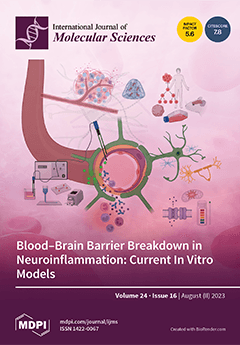
The blood–brain barrier separates the brain from the peripheral circulation. Upon neuroinflammation, this barrier becomes permeable, allowing potentially harmful molecules and cells to enter the central nervous system tissue. Research requires human models, as animal models may not reflect human pathophysiology accurately. However, not every blood-brain barrier in vitro model is suitable for each research approach. Key considerations must be taken into account, such as the type of setup (2D or 3D), extracellular matrix compositions, and cell types and sources. Additionally, barrier integrity must be attained and verified. The setup and investigation of the model may require additional devices, and modeling neuroinflammation can vary depending on the disease. View this paper
  • Issues are regarded as officially published after their release is announced to the table of contents alert mailing list.
  • You may sign up for e-mail alerts to receive table of contents of newly released issues.
  • PDF is the official format for papers published in both, html and pdf forms. To view the papers in pdf format, click on the "PDF Full-text" link, and use the free Adobe Reader to open them.
Order results
Result details
Section
Select all
Export citation of selected articles as:
13 pages, 1323 KiB  
Article
Cyclosporine A Decreases Dryness-Induced Hyperexcitability of Corneal Cold-Sensitive Nerve Terminals
by Andrea Gyenes, Zsófia Tapasztó, Susana Quirce, Carolina Luna, Laura Frutos-Rincón, Juana Gallar, M. Carmen Acosta and Illés Kovács
Int. J. Mol. Sci. 2023, 24(16), 13025; https://doi.org/10.3390/ijms241613025 - 21 Aug 2023
Cited by 1 | Viewed by 1680
Abstract
Cyclosporine A (CsA) is used for the treatment of dry eye (DE) with good clinical results, improving tear secretion and decreasing subjective symptoms. These effects are attributed to the improved tear film dynamics, but there are no data on the effect of CsA [...] Read more.
Cyclosporine A (CsA) is used for the treatment of dry eye (DE) with good clinical results, improving tear secretion and decreasing subjective symptoms. These effects are attributed to the improved tear film dynamics, but there are no data on the effect of CsA on the abnormal sensory nerve activity characteristic in DE. Our purpose was to evaluate the CsA effect on the enhanced activity of corneal cold thermoreceptors in a tear-deficient DE animal model using in vitro extracellular recording of cold thermoreceptors nerve terminal impulses (NTIs) before and in the presence of CsA. NTI shape was also analyzed. Blinking frequency and tearing rate were also measured in awake animals before and after topical CsA. CsA increased the tearing and blinking of treated animals. CsA significantly decreased the peak response to cold of cold thermoreceptors. Neither their spontaneous NTIs discharge rate nor their cooling threshold were modified. CsA also seemed to reverse some of the changes in NTI shape induced by tear deficiency. These data suggest that, at least in part, the beneficial clinical effects of CsA in DE can be attributed to a direct effect on sensory nerve endings, although the precise mechanisms underlying this effect need further studies to be fully clarified. Full article
(This article belongs to the Section Molecular Pharmacology)
Show Figures

Figure 1

Figure 1
<p>Effects of cyclosporine A (CsA) on the spontaneous and cold-evoked activity of a single cold thermoreceptor nerve terminal recorded from a tear-deficient cornea. The discharge rate at 34 °C and during the cooling ramp from 34 °C to 15 °C performed before, during perfusion with solution containing CsA at 50 µM, and 15 min after washing with control solution is shown. Upper trace: temperature of the bath solution. Lower traces: frequency histogram of the impulse discharge in imp/s.</p>
Full article ">Figure 2
<p>Correlation between the peak frequency in response to cold before CsA application and the decrease in the peak response to cold during the perfusion with CsA in tear-deficient corneas. Notice that in nerve terminals with a high peak frequency in response to cooling, the effect of CsA was greater than in terminals with low peak frequencies, the correlation between both parameters being statistically significant (<span class="html-italic">p</span> &lt; 0.001).</p>
Full article ">Figure 3
<p>Recording experimental protocol and parameters measured. (<b>a</b>) Example of the change in NTI activity evoked by cold in a corneal nerve terminal. Upper trace: histogram of the firing frequency in imp/s. Lower trace: recording of the temperature of the perfusion solution in °C; (i) Spontaneous activity at basal temperature; (ii) Cooling threshold; (iii) Peak response to cold, that is, the maximum frequency per second during the cooling ramp reached at the time indicated by the asterisk. The blue band has been added to help visualizing the terminal discharge rate during the cooling ramp. (<b>b</b>) NTI shape parameters measured during the spontaneous activity (see <a href="#sec4dot5-ijms-24-13025" class="html-sec">Section 4.5</a>).</p>
Full article ">
19 pages, 7588 KiB  
Article
Synthesis, Structure, and Magnetic and Biological Properties of Copper(II) Complexes with 1,3,4-Thiadiazole Derivatives
by Lyudmila G. Lavrenova, Taisiya S. Sukhikh, Lyudmila A. Glinskaya, Svetlana V. Trubina, Valentina V. Zvereva, Alexander N. Lavrov, Lyubov S. Klyushova and Alexander V. Artem’ev
Int. J. Mol. Sci. 2023, 24(16), 13024; https://doi.org/10.3390/ijms241613024 - 21 Aug 2023
Cited by 4 | Viewed by 1644
Abstract
New coordination compounds of copper(II) with 2,5-bis(ethylthio)-1,3,4-thiadiazole (L1) and 2,5-bis(pyridylmethylthio)-1,3,4-thiadiazole (L2) with compositions Cu(L1)2Br2, Cu(L1)(C2N3)2, Cu(L2)Cl2, and Cu(L2)Br2 [...] Read more.
New coordination compounds of copper(II) with 2,5-bis(ethylthio)-1,3,4-thiadiazole (L1) and 2,5-bis(pyridylmethylthio)-1,3,4-thiadiazole (L2) with compositions Cu(L1)2Br2, Cu(L1)(C2N3)2, Cu(L2)Cl2, and Cu(L2)Br2 were prepared. The complexes were identified and studied by CHN analysis, infrared (IR) spectroscopy, powder X-Ray diffraction (XRD), and static magnetic susceptibility. The crystal structures of Cu(II) complexes with L1 were determined. The structures of the coordination core of complexes Cu(L2)Cl2 and Cu(L2)Br2 were determined by Extended X-ray absorption fine structure (EXAFS) spectroscopy. Magnetization measurements have revealed various magnetic states in the studied complexes, ranging from an almost ideal paramagnet in Cu(L1)2Br2 to alternating-exchange antiferromagnetic chains in Cu(L1)(C2N3)2, where double dicyanamide bridges provide an unusually strong exchange interaction (J1/kB ≈ −23.5 K; J2/kB ≈ −20.2 K) between Cu(II) ions. The cytotoxic activity of copper(II) complexes with L2 was estimated on the human cell lines of breast adenocarcinoma (MCF-7) and hepatocellular carcinoma (HepG2). Full article
(This article belongs to the Special Issue The Design, Synthesis and Study of Metal Complexes)
Show Figures

Figure 1

Figure 1
<p>Structure of the molecule of complex <b>1</b> (<b>a</b>). Fragment of the packing of <b>1</b> with the minimal S⋯Br distance (<b>b</b>).</p>
Full article ">Figure 2
<p>Structure of the chain of the Cu(L<sup>2</sup>)(C<sub>2</sub>N<sub>3</sub>)<sub>2</sub> 1D coordination polymer (<b>2</b>).</p>
Full article ">Figure 3
<p>(<b>a</b>) Packing of 1D polymer chains in <b>2</b>. The S…N contacts between the sulphur atoms of the thiadiazole rings and the nitrogen atoms of dicyanamide are shown by dashed lines. (<b>b</b>) View along the chains in <b>2</b>. The S-N, Cu-Cu, and S-S distances are shown by grey, green, and yellow dashed lines, respectively (the green dashed lines of 7.84 Å indicate the translation between identical chains along the <span class="html-italic">a</span> axis).</p>
Full article ">Figure 4
<p>(<b>a</b>) Experimental normalized Cu<span class="html-italic">K</span> edge XANES spectra of complexes <b>3</b> (solid line) and <b>4</b> (dashed line). (<b>b</b>) Experimental χ(k)k<sup>2</sup> EXAFS spectra of complexes <b>3</b> (solid line) and <b>4</b> (dashed line) in the Cu<span class="html-italic">K</span> edge region.</p>
Full article ">Figure 5
<p>Comparison of experimental (black line) and simulated (red line) EXAFS spectra (<b>a</b>) and “radial distribution functions” (<b>b</b>) for complex <b>3</b>.</p>
Full article ">Figure 6
<p>Comparison of experimental (black line) and simulated (red line) EXAFS spectra (<b>a</b>) and “radial distribution functions” (<b>b</b>) for complex <b>4</b>.</p>
Full article ">Figure 7
<p>Temperature dependencies of the effective magnetic moment μ<sub>eff</sub> and inversed magnetic susceptibility 1/χ<sub>p</sub>, measured for complex <b>1</b> at magnetic fields H = 1; 10 kOe.</p>
Full article ">Figure 8
<p>Temperature dependencies of the effective magnetic moment μ<sub>eff</sub> (calculated for the θ = 0 case) and inversed magnetic susceptibility 1/χ<sub>p</sub> measured for complexes <b>3</b> (<b>a</b>) and <b>4</b> (<b>b</b>) at magnetic fields H = 1; 10 kOe. Dashed lines show the Curie–Weiss fits.</p>
Full article ">Figure 9
<p>Temperature dependencies of the magnetic susceptibility χ (<b>a</b>), effective magnetic moment μ<sub>eff</sub> (calculated for the θ = 0 case) and inversed magnetic susceptibility 1/χ<sub>p</sub> (<b>b</b>) measured for complex <b>2</b> at magnetic fields H = 1; 10 kOe. The inset in (<b>a</b>) presents the low-temperature χ(T) data on an enlarged scale. The dashed blue line in (<b>b</b>) shows the Curie–Weiss fit to the high-temperature χ<sub>p</sub>(T) data.</p>
Full article ">Figure 10
<p>Influence of complexes <b>3</b> and <b>4</b> on the viability of <span class="html-italic">HepG2</span> (<b>a</b>,<b>b</b>) and <span class="html-italic">MCF-7</span> (<b>c</b>,<b>d</b>) human cells.</p>
Full article ">Figure 11
<p>Schematic comparison of the geometry of complexes <b>1</b> and Cu(tda)<sub>2</sub>Hal<sub>2</sub> [<a href="#B30-ijms-24-13024" class="html-bibr">30</a>].</p>
Full article ">Figure 12
<p>Structure of complexes <b>3</b> (<b>a</b>) and <b>4</b> (<b>b</b>) according to the EXAFS data.</p>
Full article ">Figure 13
<p>Temperature dependencies of the effective magnetic moment μ<sub>eff</sub> of Cu(pymettda)Cl<sub>2</sub> (<b>3</b>) (red open circles) and Cu(pymettda)Br<sub>2</sub> (<b>4</b>) (blue solid circles) measured at the magnetic field H = 10 kOe. To compare the curves, the μ<sub>eff</sub> data for <b>4</b> are multiplied by 1.132. The inset shows the magnetic-field dependences of the normalized magnetic susceptibility χ(H)/χ(0) measured for <b>3</b> (red open circles) and <b>4</b> (blue solid circles) at T = 1.77 K. The green dashed line demonstrates a theoretical dependence based on the Brillouin function that takes into account an isotropic AF exchange interaction (θ ≈ −0.70 K) and the g-factor of Cu<sup>2+</sup> ions g ≈ 2.20.</p>
Full article ">Figure 14
<p>(<b>a</b>) Magnetic field dependences of the magnetization M and normalized magnetic susceptibility χ(H)/χ(0) measured for Cu(ettda)(C<sub>2</sub>N<sub>3</sub>)<sub>2</sub> (<b>2</b>) at T = 1.77 K. The blue dashed line illustrates the susceptibility behaviour of non-interacting magnetic moments (S = 1/2; g = 2). (<b>b</b>) Temperature dependencies of the magnetic susceptibility χ<sub>p</sub> measured for <b>2</b> at magnetic fields H = 1; 10 kOe are shown by the open and solid green circles, respectively. The magnetic susceptibility of AF chains (open and solid red circles) is determined by subtracting from the measured χ<sub>p</sub> data of the Curie–Weiss contribution χ<sub>CW</sub> associated with isolated paramagnetic centres (solid brown line). The dashed blue line presents a fit to the data of the alternating-exchange AF Heisenberg chain model with the alternation parameter δ = 0.86 and the largest exchange integral J/k<sub>B</sub> = −23.5 K. The inset in (<b>b</b>) shows the low-temperature data on an enlarged scale. In addition to the alternating-exchange AF chain fit, χ<sub>alt</sub>, a simple asymptotic low-T fit, χ<sub>Δ</sub>, related to a chain model with a spin gap Δ/k<sub>B</sub> = 7 K is shown by the dash-dotted line.</p>
Full article ">Scheme 1
<p>Structural formula of L<sup>1</sup> and L<sup>2</sup>.</p>
Full article ">Scheme 2
<p>Reaction scheme for complexes <b>1</b>–<b>4</b>.</p>
Full article ">
14 pages, 3328 KiB  
Article
PON-Fold: Prediction of Substitutions Affecting Protein Folding Rate
by Yang Yang, Zhang Chong and Mauno Vihinen
Int. J. Mol. Sci. 2023, 24(16), 13023; https://doi.org/10.3390/ijms241613023 - 21 Aug 2023
Cited by 1 | Viewed by 1148
Abstract
Most proteins fold into characteristic three-dimensional structures. The rate of folding and unfolding varies widely and can be affected by variations in proteins. We developed a novel machine-learning-based method for the prediction of the folding rate effects of amino acid substitutions in two-state [...] Read more.
Most proteins fold into characteristic three-dimensional structures. The rate of folding and unfolding varies widely and can be affected by variations in proteins. We developed a novel machine-learning-based method for the prediction of the folding rate effects of amino acid substitutions in two-state folding proteins. We collected a data set of experimentally defined folding rates for variants and used them to train a gradient boosting algorithm starting with 1161 features. Two predictors were designed. The three-class classifier had, in blind tests, specificity and sensitivity ranging from 0.324 to 0.419 and from 0.256 to 0.451, respectively. The other tool was a regression predictor that showed a Pearson correlation coefficient of 0.525. The error measures, mean absolute error and mean squared error, were 0.581 and 0.603, respectively. One of the previously presented tools could be used for comparison with the blind test data set, our method called PON-Fold showed superior performance on all used measures. The applicability of the tool was tested by predicting all possible substitutions in a protein domain. Predictions for different conformations of proteins, open and closed forms of a protein kinase, and apo and holo forms of an enzyme indicated that the choice of the structure had a large impact on the outcome. PON-Fold is freely available. Full article
(This article belongs to the Section Biochemistry)
Show Figures

Figure 1

Figure 1
<p>Distribution of folding rate changes for variants.</p>
Full article ">Figure 2
<p>Flowchart of a classification model.</p>
Full article ">Figure 3
<p>Flowchart of feature selection.</p>
Full article ">Figure 4
<p>Correlation of true and predicted values. The shaded areas represent 95% confidence intervals.</p>
Full article ">Figure 5
<p>Predicted folding effects indicated on BTK kinase domain in closed (PDB code 3gen) and open (3k54) structures. The range of (<b>A</b>) folding decreasing, (<b>B</b>) no effect, and (<b>C</b>) folding increasing variants are color-coded. The scales below the structures show the numbers of each predicted effect due to the variations. The differences in the numbers of (<b>D</b>) folding decreasing, (<b>E</b>) no effect, and (<b>F</b>) folding increasing variants between the open and closed conformations. The scales below the structures show the differences in numbers of each predicted effect due to the variations, closed enzyme vs. open enzyme. (<b>G</b>) Variants predicted to cause disease, X-linked agammaglobulinemia, in BTK kinase domain (3gen). Predictions were made with PON-P2 program. The scale below the structure shows the number of predicted pathogenic variants in each position. Inhibitor ibrutinib is shown in cyan. (<b>H</b>) Superimposition of the closed (3gen, in gray) and open (3k54, cyan) shows differences in the location of the upper domain. The structures were superimposed based on the lower lobe backbone atoms.</p>
Full article ">Figure 6
<p>Comparison of the effect of different conformations on folding rate predictions for apo and holo forms of myo-inositol monophosphatase. The predictions were based on holo enzyme structure (1awb) and apo form (2 hhm) [<a href="#B32-ijms-24-13023" class="html-bibr">32</a>]. Differences in the predicted (<b>A</b>) folding decreasing, (<b>B</b>) no effect, and (<b>C</b>) folding increasing variants, holo form vs. apo form. (<b>D</b>) Superimposition of the holo (gray) and apo (cyan) forms of the enzyme. Ca<sup>2+</sup> ions are in green, Cl<sup>−</sup> in cyan, and D-myo-inositol-1-phosphate in yellow. The scales below the structures show the differences in numbers of each predicted effect due to the variations, holo enzyme vs. apo enzyme.</p>
Full article ">
33 pages, 2916 KiB  
Review
Deciphering the Functional Status of Breast Cancers through the Analysis of Their Extracellular Vesicles
by Alexis Germán Murillo Carrasco, Andreia Hanada Otake, Janaina Macedo-da-Silva, Veronica Feijoli Santiago, Giuseppe Palmisano, Luciana Nogueira de Sousa Andrade and Roger Chammas
Int. J. Mol. Sci. 2023, 24(16), 13022; https://doi.org/10.3390/ijms241613022 - 21 Aug 2023
Cited by 2 | Viewed by 2388
Abstract
Breast cancer (BC) accounts for the highest incidence of tumor-related mortality among women worldwide, justifying the growing search for molecular tools for the early diagnosis and follow-up of BC patients under treatment. Circulating extracellular vesicles (EVs) are membranous nanocompartments produced by all human [...] Read more.
Breast cancer (BC) accounts for the highest incidence of tumor-related mortality among women worldwide, justifying the growing search for molecular tools for the early diagnosis and follow-up of BC patients under treatment. Circulating extracellular vesicles (EVs) are membranous nanocompartments produced by all human cells, including tumor cells. Since minimally invasive methods collect EVs, which represent reservoirs of signals for cell communication, these particles have attracted the interest of many researchers aiming to improve BC screening and treatment. Here, we analyzed the cargoes of BC-derived EVs, both proteins and nucleic acids, which yielded a comprehensive list of potential markers divided into four distinct categories, namely, (i) modulation of aggressiveness and growth; (ii) preparation of the pre-metastatic niche; (iii) epithelial-to-mesenchymal transition; and (iv) drug resistance phenotype, further classified according to their specificity and sensitivity as vesicular BC biomarkers. We discuss the therapeutic potential of and barriers to the clinical implementation of EV-based tests, including the heterogeneity of EVs and the available technologies for analyzing their content, to present a consistent, reproducible, and affordable set of markers for further evaluation. Full article
(This article belongs to the Special Issue State-of-the-Art Molecular Oncology in Brazil 2.0)
Show Figures

Figure 1

Figure 1
<p>Challenges and perspectives regarding omics research on BC-derived EVs. This review presents the current state of the art of the most-studied omics topics on EVs from BC, namely, transcriptomics and proteomics. However, we must fill omics-related gaps before proposing reliable EV-based tools for this disease. Here, we cited some challenges for future research. As vesicles are heterogeneous in terms of size, biogenesis, and cargo, authors must standardize the reporting of methods for the isolation, quantification, characterization, and profiling of EVs. Furthermore, consistent findings in relation to EVs are characterized by their ability to be replicated. Nevertheless, many studies use targeted analysis approaches, which can bias observations. In addition, such replicability must be related to characterizing different individuals of the same subgroup or cell lines of the same subtype. To evaluate this correctly, it is necessary to increase the number of studies comparing less-studied BC cell lines and include a translational approach between tumor cell markers and their vesicular pairs. Regarding associations with the subtype of BC patients, there are gaps produced by the lack of available information about the molecular or clinical profiles of these patients, which can complicate future secondary analysis. After conquering this challenge, we can promisingly combine data from different omics studies of BC-derived EVs and select potentially tumor-derived EVs via liquid biopsies from patients to debug or edit these vesicles and induce a beneficial effect in BC patients. Image created on BioRender.com.</p>
Full article ">Figure 2
<p>Extracellular vesicle (EV) miRNAs in breast-cancer-related studies. Sankey plots show the number of studies mentioning each relevant vesicular miRNA from cell supernatant (<b>A</b>) or human bodily fluids (<b>B</b>). The cell lines in which the EV cargo was analyzed are classified into the main BC subtypes following the criteria given in Dai et al.’s (2017) study [<a href="#B124-ijms-24-13022" class="html-bibr">124</a>]. For studies on EVs collected from BC patients, the subtype information was retrieved from each study. H: Her2, TNA: Triple-Negative A, TNB: Triple-Negative B, LA: Luminal A, and LB: Luminal B.</p>
Full article ">Figure 3
<p>Relevant putative markers in BC-derived EVs. Breast cancer cells produce a great diversity of EVs. These EVs can be classified into subpopulations based on their proteomic and transcriptomic cargo. In this review, we associate some BC-derived EV subpopulations with tumor-related functions. In addition, we include putative markers related to their types (miRNA, lncRNA, mRNA, circRNA, or protein) for each subpopulation. Image created on <a href="http://BioRender.com" target="_blank">BioRender.com</a>.</p>
Full article ">Figure 4
<p>Extracellular vesicle (EVs) proteins in breast cancer proteome studies. (<b>A</b>) The most frequently identified proteins in the evaluated studies. The donut graph shows the corresponding subcellular locations. (<b>B</b>) Subcellular localization of proteins identified in EVs in at least two studies. (<b>C</b>) Cell-cycle-related and p53 pathways in which EV proteins participate.</p>
Full article ">
46 pages, 3157 KiB  
Review
From Pathogenesis to Therapeutics: A Review of 150 Years of Huntington’s Disease Research
by Andrew Jiang, Renee R. Handley, Klaus Lehnert and Russell G. Snell
Int. J. Mol. Sci. 2023, 24(16), 13021; https://doi.org/10.3390/ijms241613021 - 21 Aug 2023
Cited by 20 | Viewed by 9570
Abstract
Huntington’s disease (HD) is a debilitating neurodegenerative genetic disorder caused by an expanded polyglutamine-coding (CAG) trinucleotide repeat in the huntingtin (HTT) gene. HD behaves as a highly penetrant dominant disorder likely acting through a toxic gain of function by the mutant [...] Read more.
Huntington’s disease (HD) is a debilitating neurodegenerative genetic disorder caused by an expanded polyglutamine-coding (CAG) trinucleotide repeat in the huntingtin (HTT) gene. HD behaves as a highly penetrant dominant disorder likely acting through a toxic gain of function by the mutant huntingtin protein. Widespread cellular degeneration of the medium spiny neurons of the caudate nucleus and putamen are responsible for the onset of symptomology that encompasses motor, cognitive, and behavioural abnormalities. Over the past 150 years of HD research since George Huntington published his description, a plethora of pathogenic mechanisms have been proposed with key themes including excitotoxicity, dopaminergic imbalance, mitochondrial dysfunction, metabolic defects, disruption of proteostasis, transcriptional dysregulation, and neuroinflammation. Despite the identification and characterisation of the causative gene and mutation and significant advances in our understanding of the cellular pathology in recent years, a disease-modifying intervention has not yet been clinically approved. This review includes an overview of Huntington’s disease, from its genetic aetiology to clinical presentation and its pathogenic manifestation. An updated view of molecular mechanisms and the latest therapeutic developments will also be discussed. Full article
(This article belongs to the Special Issue Huntington’s Disease: Molecular Advances in Therapeutics)
Show Figures

Figure 1

Figure 1
<p>Coronal section of the human brain outlining the basal ganglia. Major signalling pathways of the basal ganglia include the direct, indirect, and hyperdirect pathways. The direct and hyperdirect pathways coordinate excitation of the cerebral cortex. The indirect pathway inhibits cortical excitation. In HD, the medium spiny neurons of the striatum projecting into the globus pallidus are degenerated. GPe, globus pallidus externa; GPi, globus pallidus interna; SN, substantia nigra; STN, subthalamic nucleus. Created with <a href="http://BioRender.com" target="_blank">BioRender.com</a> (accessed on 14 January 2023).</p>
Full article ">Figure 2
<p>Huntingtin structure and processing. The huntingtin gene (<span class="html-italic">HTT</span>) contains 67 exons that are processed to form two mRNA transcripts of 10,366 bp and 13,711 bp that differ in an additional 3′UTR sequence of 3360 bp. Alternative splicing generates several <span class="html-italic">HTT</span> isoforms and transcripts lacking exons 10, 12, 29, and 46 or retaining a 57 bp portion of intron 28. Huntingtin protein is comprised of an N-terminal region that encompasses a 17 amino acid huntingtin nuclear export signal, the polyglutamine repeat (polyQ), and a proline rich domain. The remainder of the protein is organised into clusters of anti-parallel alpha-helical HEAT repeats. Proteolytic cleavage of N-terminal fragments by endoproteases, caspases and calpains occurs more frequently in HD, and it has been proposed that these N-terminal fragments are involved in disease pathogenesis.</p>
Full article ">Figure 3
<p>Proposed HD pathogenic mechanisms This figure shows possible Huntington disease mechanisms and the cellular location of the aberrant activity including excitotoxicity, dopamine imbalance, mitochondrial dysfunction, disruption of proteostasis, initiation of apoptotic pathways, transcriptional dysregulation, and neuroinflammation. Created with <a href="http://BioRender.com" target="_blank">BioRender.com</a> (accessed on 17 August 2023).</p>
Full article ">Figure 4
<p>150 years of Huntington’s disease research showcasing research milestones.</p>
Full article ">
37 pages, 13144 KiB  
Review
Organically Templated Uranyl Sulfates and Selenates: Structural Complexity and Crystal Chemical Restrictions for Isotypic Compounds Formation
by Elizaveta V. Durova, Ivan V. Kuporev and Vladislav V. Gurzhiy
Int. J. Mol. Sci. 2023, 24(16), 13020; https://doi.org/10.3390/ijms241613020 - 21 Aug 2023
Cited by 1 | Viewed by 1356
Abstract
This paper reviews the state of the art in the structural chemistry of organically templated uranyl sulfates and selenates, which are considered as the most representative groups of U-bearing synthetic compounds. In total, there are 194 compounds known for both groups, the crystal [...] Read more.
This paper reviews the state of the art in the structural chemistry of organically templated uranyl sulfates and selenates, which are considered as the most representative groups of U-bearing synthetic compounds. In total, there are 194 compounds known for both groups, the crystal structures of which include 84 various organic molecules. Structural studies and topological analysis clearly indicate complex crystal chemical limitations in terms of the isomorphic substitution implementation, since the existence of isotypic phases has to date been confirmed only for 24 compounds out of 194, which is slightly above 12%. The structural architecture of the entire compound depends on the combination of the organic and oxyanion parts, changes in which are sometimes realized even while maintaining the topology of the U-bearing complex. An increase in the size of the hydrocarbon part and number of charge functional groups of the organic cation leads to the formation of rare and more complex topologies. In addition, the crystal structures of two novel uranyl sulfates and one uranyl selenate, templated by isopropylammonium cations, are reported. Full article
Show Figures

Figure 1

Figure 1
<p>The crystal structure of <b>1</b>: (<b>a</b>) polyhedral representation of layers in the structures of <b>2</b>–<b>4</b> (<b>b</b>), and topology of its interpolyhedral linkage (<b>c</b>). Legend: U polyhedra = yellow, <span class="html-italic">T</span>O<sub>4</sub> (<span class="html-italic">T</span> = S, Se) tetrahedra = orange; O atoms = red, N atoms = blue, C atoms = white, H atoms = gray; black nodes = U atoms, white nodes = <span class="html-italic">T</span> atoms.</p>
Full article ">Figure 2
<p>The crystal structures of <b>2</b> (<b>a</b>) and <b>4</b> (<b>b</b>): location of the interlayer species in the structures of <b>2</b> (<b>c</b>) and <b>4</b> (<b>d</b>) relative to the black-and-white graph of the inorganic layer. Legend: see <a href="#ijms-24-13020-f001" class="html-fig">Figure 1</a>.</p>
Full article ">Figure 3
<p>The most common topologies of the U-bearing substructural units among organically templated uranyl sulfate and selenate compounds: chains of <span class="html-italic">cc</span>1–1:2–1 (<b>a</b>) and <span class="html-italic">cc</span>1–1:2–12 (<b>c</b>,<b>d</b>) types and their black-and-white graphs ((<b>b</b>,<b>e</b>), respectively); layers of <span class="html-italic">cc</span>2–1:2–2 (<b>f</b>), <span class="html-italic">cc</span>2–2:3–10 (<b>h</b>), and <span class="html-italic">cc</span>2–2:3–4 (<b>j</b>) topologies and their respective graphs (<b>g</b>,<b>i</b>,<b>k</b>). Legend: see <a href="#ijms-24-13020-f001" class="html-fig">Figure 1</a>; blue triangles = NO<sub>3</sub> groups; gray nodes and double line = edge-shared <span class="html-italic">T</span>O<sub>4</sub> tetrahedra or NO<sub>3</sub> group.</p>
Full article ">Figure 4
<p>Correlation graphs of structural complexity parameters: complexity of U-bearing structural unit vs. complexity of the entire structure (<b>a</b>); complexity of organic molecule vs. complexity of U-bearing structural unit and of the entire structure per unit cell (<b>b,c</b>) and per atom (<b>d</b>,<b>e</b>).</p>
Full article ">Figure 5
<p>Correlation graphs of chained amine (<b>a</b>,<b>b</b>) and diamine molecule (<b>c</b>,<b>d</b>) complexity vs. complexity of U-bearing structural unit (<b>a</b>,<b>c</b>) and of the entire structure (<b>b,d</b>), per atom.</p>
Full article ">Figure 6
<p>Correlation graphs of amino acid molecule complexity vs. complexity of U-bearing structural unit (<b>a</b>) and of the entire structure (<b>b</b>), per atom.</p>
Full article ">Figure 7
<p>Correlation graphs of cyclic organic molecule complexity vs. complexity of U-bearing structural unit (<b>a</b>,<b>c</b>) and of the entire structure (<b>b</b>,<b>d</b>), per atom.</p>
Full article ">Figure 8
<p>Crystals of <b>1</b>–<b>4</b> (<b>a</b>–<b>d</b>, respectively) formed in the described synthetic experiments.</p>
Full article ">
11 pages, 2026 KiB  
Article
Non-Invasive Intranasal Delivery of pApoE2: Effect of Multiple Dosing on the ApoE2 Expression in Mice Brain
by Avinash Gothwal, Richard Nii Lante Lamptey, Riddhi Trivedi, Bivek Chaulagain and Jagdish Singh
Int. J. Mol. Sci. 2023, 24(16), 13019; https://doi.org/10.3390/ijms241613019 - 21 Aug 2023
Cited by 1 | Viewed by 1241
Abstract
Chitosan-based polymeric micelles are promising non-viral nanocarriers for safe and targeted gene delivery. Multi-functionalized chitosan polymeric micelles were prepared by grafting fatty acid, cell-penetrating peptide, and mannose on the chitosan backbone. The polymeric micelles were subjected to surface morphology and surface topography using [...] Read more.
Chitosan-based polymeric micelles are promising non-viral nanocarriers for safe and targeted gene delivery. Multi-functionalized chitosan polymeric micelles were prepared by grafting fatty acid, cell-penetrating peptide, and mannose on the chitosan backbone. The polymeric micelles were subjected to surface morphology and surface topography using scanning electron microscopy and atomic force microscopy, respectively. The hemotoxic profile of the prepared polymeric micelles was established against erythrocytes and was found to be <5% hemotoxic up to the concentration of 600 µg/mL. In vitro ApoE2 expression in primary astrocytes and neurons was analyzed. Multi-functionalized polymeric micelles produced greater (p < 0.05) transfection in astrocytes and neurons in comparison to mono-functionalized micelles. Intranasal administration of polymeric micelles/pApoE2 polyplex led to significantly higher (p < 0.05) in vivo pApoE2 expression than chitosan and unfunctionalized polymeric micelles-treated mice groups. The outcomes of this study predict that the developed multi-functionalized polymeric micelles could be an effective and safe gene delivery platform to the brain through the intranasal route. Full article
Show Figures

Figure 1

Figure 1
<p>(<b>A</b>) Scanning electron microscopic (SEM) image of OA-g-CS-PEN-MAN polymeric micelles; (<b>B</b>,<b>C</b>) Atomic force microscopic (AFM) images of OA-g-CS-PEN-MAN polymeric micelles.</p>
Full article ">Figure 2
<p>(<b>A</b>–<b>D</b>) Selected Area Electron Diffraction (SAED) patterns of OA-g-CS-PEN-MAN polymeric micelles; (<b>E</b>): X-ray diffraction (X-RD) pattern of OA-g-CS-PEN-MAN polymeric micelles.</p>
Full article ">Figure 3
<p>Represents hemolysis activity of CS, OA-g-CS, OA-g-CS-PEN, OA-g-CS-MAN, and OA-g-CS-PEN-MAN conjugates at different concentrations.</p>
Full article ">Figure 4
<p>(<b>A</b>) Represents ApoE expression levels in primary astrocytes and; (<b>B</b>) in primary neurons after treatment with saline, <span class="html-italic">pApoE2</span>, CS/<span class="html-italic">pApoE2</span>, OA-g-CS/ <span class="html-italic">pApoE2</span>, OA-g-CS-PEN/ <span class="html-italic">pApoE2</span>, OA-g-CS-MAN/ <span class="html-italic">pApoE2</span>, OA-g-CS-PEN-MAN/<span class="html-italic">pApoE2</span> polyplexes. Data represented as mean ± SEM, n = 6. One-way ANOVA was used for statistical analysis.</p>
Full article ">Figure 5
<p>In vivo ApoE expressions in <span class="html-italic">C57BL6/J</span> mice after treatment saline, <span class="html-italic">pApoE2</span>, CS/<span class="html-italic">pApoE2</span>, OA-g-CS/<span class="html-italic">pApoE2</span>, OA-g-CS-PEN-MAN/<span class="html-italic">pApoE2</span> polyplexes. Data represented as mean ± SEM, n = 6. One-way ANOVA was used for statistical analysis.</p>
Full article ">
17 pages, 2367 KiB  
Article
Why Does the Antioxidant Complex Twendee X® Prevent Dementia?
by Fukka You, Yoshiaki Harakawa, Toshikazu Yoshikawa and Haruhiko Inufusa
Int. J. Mol. Sci. 2023, 24(16), 13018; https://doi.org/10.3390/ijms241613018 - 21 Aug 2023
Cited by 4 | Viewed by 2264
Abstract
Alzheimer’s disease (AD) is a complex neurodegenerative disease characterized by cognitive and short-term memory impairments. The disease involves multiple pathological factors such as amyloid plaque formation, mitochondrial dysfunction, and telomere shortening; however, oxidative stress and diabetes mellitus are significant risk factors. The onset [...] Read more.
Alzheimer’s disease (AD) is a complex neurodegenerative disease characterized by cognitive and short-term memory impairments. The disease involves multiple pathological factors such as amyloid plaque formation, mitochondrial dysfunction, and telomere shortening; however, oxidative stress and diabetes mellitus are significant risk factors. The onset of AD begins approximately 20 years before clinical symptoms manifest; therefore, treating AD after symptoms become evident is possibly too late to have a significant effect. As such, preventing AD or using an effective treatment at an early stage is important. Twendee X® (TwX) is an antioxidant formulation consisting of eight ingredients. TwX has been proven to prevent the progression to dementia in patients with mild cognitive impairment (MCI) in a multicenter, randomized, double-blind, placebo-controlled, prospective intervention trial. As well, positive data has already been obtained in several studies using AD model mice. Since both diabetes and aging are risk factors for AD, we examined the mechanisms behind the effects of TwX on AD using the spontaneous hyperglycemia model and the senescence model of aged C57BL/6 mice in this study. TwX was administered daily, and its effects on diabetes, autophagy in the brain, neurogenesis, and telomere length were examined. We observed that TwX protected the mitochondria from oxidative stress better than a single antioxidant. TwX not only lowered blood glucose levels but also suppressed brain neurogenesis and autophagy. Telomeres in TWX-treated mice were significantly longer than those in non-treated mice. There are many factors that can be implicated in the development and progression of dementia; however, multiple studies on TwX suggest that it may offer protection against dementia, not only through the effects of its antioxidants but also by targeting multiple mechanisms involved in its development and progression, such as diabetes, brain neurogenesis, telomere deficiency, and energy production. Full article
(This article belongs to the Special Issue Cognitive Dysfunction: Molecular Research and Novel Therapy)
Show Figures

Figure 1

Figure 1
<p>In vitro antioxidant capacity of Twendee X<sup>®</sup> (TwX) and vitamin C (VC) alone in TwX solution. The antioxidant capacity of TwX (60 mg/mL, n = 6) and VC alone (20.5 mg/mL, n = 6) in the same concentration as is present in TwX was measured by the OXY adsorbent test (Diacron International Srl, Grosseto, Italy). Values in the graph represent the mean ± SD. **: <span class="html-italic">p</span> &lt; 0.01 (Student’s <span class="html-italic">t</span>-test).</p>
Full article ">Figure 2
<p>Results of hierarchical cluster analysis (HCA) of HepG2 metabolites. Twendee X<sup>®</sup> (TwX) at 60 µg/mL was added to the human liver cancer cell line HepG2, and metabolites were sampled after one hour. Unstimulated (Cont1-3) and TwX-stimulated cells (TwX1-3) were compared. The horizontal axis and vertical axis indicate the sample name and the peaks, respectively. HCA was performed on the peaks, and the distance between peaks is shown in the tree diagram in the figure. Darker green or red indicates smaller or larger than average, respectively. The analysis was performed by HMT’s proprietary MATLAB program.</p>
Full article ">Figure 3
<p>HepG2 metabolite levels near the glycolytic and TCA circuits. Metabolites detected in this study are plotted in the metabolic pathway using VANTED software version 2.6.3. The graph shows relative area values for Control (blue) and Twendee X<sup>®</sup> (red). Values in the graph represent the mean ± SD. N.D.: not detected. 1,3-DPG, 1,3-Diphospoglycerate; 2-OG, 2-Oxoglutaric acid; 2-PG, 2-Phosphoglyceric acid; 3-HBA, 3-Hydroxybutyric acid; 3-PG, 3-Phosphoglyceric acid; 6-PG, 6-Phosphogluconic acid; AcCoA, Acetyl coenzyme A_divalent; ADP, Adenosine diphosphate; ADP-Rib, ADP-ribose; Ala, Alanine; Arg, Arginine; Asp, Aspartic acid; ATP, Adenosine triphosphate; CMP-NeuNAc, Cytidine-5′-monophosphate--N-acetylneuraminate; CoA, Coenzyme A_divalent; DHAP, Dihydroxyacetone phosphate; E4P, Erythrose 4-phosphate; F1,6P, Fructose 1,6-diphosphate; D-F1P, Fructose 1-phosphate; F6P, Fructose 6-phosphate; Gal1P, Galactose 1-phosphate; GDP-fucose, Guanosine diphosphate-fucose; GDP-Man, Guanosine diphosphate-mannose; Glu, Glucose; Glc-6P, Glucosamine 6-phosphate; G1P, Glucose 1-phosphate; G6P, Glucose 6-phosphate; GAP, Glyceraldehyde 3-phosphate; G3P, Glycerol 3-phosphate; Man1P, Mannose 1-phosphate; Man6P, Mannose 6-phosphate; Malonyl-CoA, Malonyl coenzyme A_divalent; GlcNAc, N-Acetylglucosamine; GlcNAc-P, N-Acetylglucosamine 1-phosphate; NAcGlcNP, N-Acetylglucosamine 6-phosphate; ManNAc, N-Acetylmannosamine; NeuNAc, N-Acetylneuraminic acid; NAD, Nicotinamide adenine dinucleotide; NADH, Reduced nicotinamide adenine dinucleotide; NADP, Nicotinamide adenine dinucleotide phosphate; NADPH, Reduced nicotinamide adenine dinucleotide phosphate_divalent; PEP, Phosphoenolpyruvic acid; PRPP, Phosphoribosyl pyrophosphate; R5P, Ribose 5-phosphate; Ru5P, Ribulose 5-phosphate; S7P, Sedoheptulose 7-phosphate; SucCoA, Succinyl coenzyme A_divalent; UDP-Glc, Uridine diphosphate-glucose; UDP-GlcA, Uridine diphosphate-glucuronic acid; UDP-GlcNAc, Uridine diphosphate-N-acetylglucosamine; X5P, Xylulose 5-phosphate.</p>
Full article ">Figure 4
<p>Fasting blood oxidative stress in a mouse model of spontaneous diabetes mellitus. C57BL/6J spontaneous diabetic mice were administered sterile water (Control, n = 10) or Twendee X<sup>®</sup> (TwX, n = 8) orally at 40 mg/kg/day. Untreated mice of the same age were kept as negative controls (NC, n = 2). After fasting for 16 h, the blood oxidative stress level was measured by the d-ROMs test (Diacron International Srl, Grosseto, Italy). Values in the graph represent the mean ± SD. **: <span class="html-italic">p</span> &lt; 0.01 (Student’s <span class="html-italic">t</span>-test, NC vs. Control).</p>
Full article ">Figure 5
<p>Blood glucose level on the glucose tolerance test in hyperglycemic mice. C57BL/6J spontaneous diabetic mice were administered sterile water (Control) or Twendee X<sup>®</sup> (TwX) orally at 40 mg/kg/day. Untreated mice of the same age were kept as negative controls (NC). After fasting for 16 h, mice were given glucose, and their blood glucose levels were measured at set intervals. Values in the graph represent the mean ± SD. Student’s <span class="html-italic">t</span>-test was used for all statistical analysis. †: <span class="html-italic">p</span> &lt; 0.05 (Control vs. NC), ††: <span class="html-italic">p</span> &lt; 0.01 (Control vs. NC), ‡: <span class="html-italic">p</span> &lt; 0.05 (TwX vs. NC), *: <span class="html-italic">p</span> &lt; 0.05 (TwX vs. Control).</p>
Full article ">Figure 6
<p>Retention of autophagy in an aged mouse model of spontaneous diabetes mellitus. C57BL/6J spontaneous diabetic mice were administered sterile water (Control) or Twendee X<sup>®</sup> (TwX) orally at 40 mg/kg/day. At 70 weeks old, total protein from the mouse hippocampus was extracted, and western blot was used to evaluate the protein levels of LC3-I and LC3-II. Control: n = 4, TwX: n = 4. All lanes were loaded with 200 ug of sample. Values in the graph represent the mean ± SD. *: <span class="html-italic">p</span> &lt; 0.05 (Student’s <span class="html-italic">t</span>-test). Band intensity was evaluated using ImageJ version 1.53k (National Institutes of Health, Bethesda, MD, USA).</p>
Full article ">Figure 7
<p>Effect of Twendee X<sup>®</sup> (TwX) on mouse telomeres. Spontaneous diabetic model C57BL/6J mice were orally administered sterile water (Control, n = 10) or TwX (40 mg/kg/day, n = 10) for 33 weeks, after which telomere length in the tail tissue was measured. Values in the graph represent the mean ± SD. *: <span class="html-italic">p</span> = 0.038 (Student’s <span class="html-italic">t</span>-test).</p>
Full article ">Figure 8
<p>Changes in the number of newborn neurons in the hippocampal dentate gyrus. C57BL/6J mice in the control (sterile water, n = 5) and Twendee X<sup>®</sup> group (TwX, 40 mg/kg/day, n = 5, administered from 26 weeks old) were dissected at 56 weeks old. Six-week-old C57BL/6J mice were dissected as a control (n = 5). The number of Tuj-1 cells in the hippocampal dentate gyrus was measured. Values in the graph represent the mean ± SD. *: <span class="html-italic">p</span> = 0.029 (Student’s <span class="html-italic">t</span>-test, 56 weeks vs. 56 weeks (with TwX)).</p>
Full article ">
22 pages, 6080 KiB  
Review
Research Progress of Macromolecules in the Prevention and Treatment of Sepsis
by Jingqian Su, Shun Wu, Fen Zhou and Zhiyong Tong
Int. J. Mol. Sci. 2023, 24(16), 13017; https://doi.org/10.3390/ijms241613017 - 21 Aug 2023
Cited by 3 | Viewed by 2015
Abstract
Sepsis is associated with high rates of mortality in the intensive care unit and accompanied by systemic inflammatory reactions, secondary infections, and multiple organ failure. Biological macromolecules are drugs produced using modern biotechnology to prevent or treat diseases. Indeed, antithrombin, antimicrobial peptides, interleukins, [...] Read more.
Sepsis is associated with high rates of mortality in the intensive care unit and accompanied by systemic inflammatory reactions, secondary infections, and multiple organ failure. Biological macromolecules are drugs produced using modern biotechnology to prevent or treat diseases. Indeed, antithrombin, antimicrobial peptides, interleukins, antibodies, nucleic acids, and lentinan have been used to prevent and treat sepsis. In vitro, biological macromolecules can significantly ameliorate the inflammatory response, apoptosis, and multiple organ failure caused by sepsis. Several biological macromolecules have entered clinical trials. This review summarizes the sources, efficacy, mechanism of action, and research progress of macromolecular drugs used in the prevention and treatment of sepsis. Full article
Show Figures

Figure 1

Figure 1
<p>Anticoagulation mechanism of rhTM, ART-123, Annexin, and FGF-2. AKT: protein kinase B; APC: activated protein C; ART-123: Recombinant hu-man soluble thrombomodulin; FGF-2: fibroblast growth factor 2; HMGB1: high-mobility group box protein 1; IL-6: interleukin-6; LPS: lipopolysaccharide; mTOR: mammalian target of rapamycin; PAI-1: plasminogen activator inhibitor-1; rhTM: Recombinant human soluble thrombomodulin; S6K1: p70 ribosomal protein subunit 6 kinase 1; TF: tissue factor; TLR4: Toll-like receptor 4; TNF-α: tumor necrosis factor; VIIIa: activated factor seven; Va: activated factor five.</p>
Full article ">Figure 2
<p>Antibacterial mechanism of WIKE-14, PS1-2, and Pep19-2.5. LPS: lipopolysaccharide; NF-κB: nuclear factor kappa-light-chain-enhancer of activated B cells; Pep19-2.5: aspidasept; TLR2: Toll-like receptor 2; TLR4: Toll-like receptor 4; TNF-α: tumor necrosis factor.</p>
Full article ">Figure 3
<p>Antioxidant mechanism of α-ch, FGF-19, MFG-E8, MG53, and GDF7. AMPK: adenosine 5′-monophosphate (AMP)-activated protein kinase; Bax: BCL2-associated X; FGF-19: fibroblast growth factor 19; GDF7: growth differentiation factor 7; GLA: gamma linolenic acid; GPX4: glutathione peroxidase 4; GSH: glutathione; HO-1: heme oxygenase-1; iNOS: inducible nitric oxide synthase; Keap1: Kelch-like ECH-associated protein 1; LA: linoleic acid; MDA: malondialdehyde; MFG-E8: milk fat globule epidermal growth factor 8; MG53: mitsugumin-53; MPO: myeloperoxidase; NF-κB: nuclear factor kappa-light-chain-enhancer of activated B cells; NOx: nitrite/nitrate; NRF2: nuclear factor erythroid 2-related factor 2; PPARα: peroxisome proliferator-activated receptor-alpha; ROS: reactive oxygen species; SOD: superoxide dismutase; STING: stimulator of interferon genes; TLR4: Toll-like receptor 4; α-ch: alpha-chymotrypsin.</p>
Full article ">Figure 4
<p>Anti-apoptotic mechanism of HGF, IL-7, IL-15, IL-22, Ac2-26, Vaspin, Hsp22, and APN. AKT: protein kinase B; AMPK: adenosine 5′-monophosphate (AMP)-activated protein kinase; APN: adiponectin; ATF4: activating transcription factor 4; ATG7: autophagy related protein 7; Bax: BCL2-associated X; bcl-2: B-cell lymphoma-2; Bim: Bcl-2-like protein 11; c-Met: cellular mesenchymal–epithelial transition factor; HGF: hepatocyte growth factor; Hsp22: heat shock protein 22; IFN-γ: interferon-γ; IL-15: interleukin-15; IL-22: interleukin-22; IL-7: interleukin-7; JAK: Janus Kinase; KLK7: kallikrein 7; mTOR: mammalian target of rapamycin; NF-κB: nuclear factor kappa-light-chain-enhancer of activated B cells; PI3K: phosphoinositide 3-Kinase; PUMA: p53 upregulated modulator of apoptosis; ROS: Reactive oxygen species; S100A9: S100 calcium-binding protein A9; STAT3/5: signal transducer and activator of transcription 3/5; Vaspin: Serpin A12.</p>
Full article ">Figure 5
<p>Anti-inflammatory mechanism of S100A8, CXT, Apelin-13, and SLPI. APJR: apelin receptor; CTX: crotoxin; IKK-α/β: inhibitor of kappa B kinase-α/β; IL-10: interleukin-10; IL-6: interleukin-6; Iκb-α: inhibitor kappa B alpha; LPS: lipopolysaccharide; LXA4: lipoxin A4; MAPK: mitogen-activated protein kinase; NF-κB: nuclear factor kappa-light-chain-enhancer of activated B cells; NOX4: NADPH oxidase 4; p38 MAPK: P38 mitogen-activated protein kinases; PFKFB3: 6-Phosphofructo-2-kinase/fructose-2,6-bisphosphatase; PGE2: prostaglandin E2; ROS: reactive oxygen species; S1000A8: S100 calcium-binding protein A8; SLPI: secretory leukocyte protease inhibitor; SMAD2/3: drosophila mothers against decapentaplegic protein 2/3; TGF-β: transforming growth factor beta; TLR4: Toll-like receptor 4; TNF-α: tumor necrosis factor.</p>
Full article ">Figure 6
<p>Therapeutic mechanism of anti-HMGB1pAb, atezolizumab, secukinumab, adrecizumab, and tocilizumab. HMGB1: high-mobility group box chromosomal protein 1; IL-10: interleukin-10; IL-1β: interleukin-1β; IL-4: interleukin-4; IL-6: interleukin-6; IRF3: interferon regulatory factor 3; IκBα: inhibitor kappa B alpha; JNK: Jun N-terminal Kinase; NF-κB: nuclear factor kappa-light-chain-enhancer of activated B cells; NLRP3: NOD-like receptor thermal-protein-domain-associated protein 3; PD-L1: programmed cell death-ligand 1; S100A12: S100 calcium-binding protein A12; TLR4: Toll-like receptor 4; TNF-α: tumor necrosis factor.</p>
Full article ">Figure 7
<p>Therapeutic mechanism of miR-25-5p, miR-214-3p, miR-142-5p, miR-340-5p, miR-26a-5p, and miR-490-3p. Bax: BCL2-associated X; bcl-2: B-cell lymphoma-2; CTGF: connective tissue growth factor; CTSB: cathepsin B; GSH: glutathione; IL-6: interleukin-6; IRAK1: interleukin 1 receptor-associated kinase 1; MAPK: mitogen-activated protein kinase; MDA: malondialdehyde; miR: microRNA; MyD88: myeloid differentiation factor 88; NF-κB: nuclear factor kappa-light-chain-enhancer of activated B cells; NLRP3: NOD-like receptor thermal-protein-domain-associated protein 3; ROS: reactive oxygen species; SOD: superoxide dismutase; TNF-α: tumor necrosis factor; TRAF6: TNF receptor-associated factor 6; TXNIP: thioredoxin-interacting protein.</p>
Full article ">Figure 8
<p>Treatment mechanism of UFH, NAH, lentinan, LBP, and PCP. Bax: BCL2-associated X; Gnb2: G protein subunit β2; GSDMD: Gasdermin D; GSH: glutathione; HMGB1: high-mobility group box protein 1; HPA: heparinase; IL-1β: interleukin-1β; IL-6: interleukin-6; LBP: Lycium barbarum polysaccharide; LPS: lipopolysaccharide; MDA: malondialdehyde; MPO: myeloperoxidase; NAH: N-acetyl heparin; Nedd4: neural precursor cell expressed developmentally downregulated protein 4; Nedd4L: NEDD4-like E3 ubiquitin protein ligase; NF-κB: nuclear factor kappa-light-chain-enhancer of activated B cells; PCPs:Poria cocos polysaccharides; PKM2: Pyruvate kinase muscle isoform 2; SOD: superoxide dismutase; TLR4: Toll-like receptor 4; TNF-α: tumor necrosis factor; UFH: unfractionated heparin; Xa: factor Xa.</p>
Full article ">
14 pages, 6980 KiB  
Article
Expression of EMP 1, 2, and 3 in Adrenal Cortical Neoplasm and Pheochromocytoma
by Yoon Jin Cha and Ja Seung Koo
Int. J. Mol. Sci. 2023, 24(16), 13016; https://doi.org/10.3390/ijms241613016 - 21 Aug 2023
Viewed by 1306
Abstract
The purpose of this study is to investigate the expression of the epithelial membrane proteins (EMP) 1, 2, and 3 in adrenal gland neoplasm and to explore the broader implications of this. Tissue microarrays were constructed for 132 cases of adrenal cortical neoplasms [...] Read more.
The purpose of this study is to investigate the expression of the epithelial membrane proteins (EMP) 1, 2, and 3 in adrenal gland neoplasm and to explore the broader implications of this. Tissue microarrays were constructed for 132 cases of adrenal cortical neoplasms (ACN) (adrenal cortical adenoma (115 cases), and carcinoma (17 cases)) and 189 cases of pheochromocytoma. Immunohistochemical staining was performed to identify EMP 1, 2, and 3, and was compared with clinicopathological parameters. The H-score of EMP 3 (p < 0.001) was higher in pheochromocytoma when compared to that of ACN, and the H-score of EMP 1 (p < 0.001) and EMP 3 (p < 0.001) was higher in adrenal cortical carcinomas when compared to that of adrenal cortical adenomas. A higher EMP 1 H-score was observed in pheochromocytomas with a GAPP score ≥3 (p = 0.018). In univariate analysis, high levels of EMP 1 and EMP 3 expression in ACN were associated with shorter overall survival (p = 0.001). Differences were observed in the expression of EMPs between ACN and pheochromocytoma. EMPs are associated with malignant tumor biology in adrenal cortical neoplasm and pheochromocytoma, suggesting the role of a prognostic and/or predictive factor for EMPs in adrenal tumor. Full article
(This article belongs to the Special Issue Inflammatory Response in Endocrine Disorders)
Show Figures

Figure 1

Figure 1
<p>Expression of epithelial membrane proteins (EMPs) 1, 2, and 3 in adrenal neoplasm. Pheochromocytomas (PCC) show higher expression of EMP 3 than that of adrenal cortical neoplasm (ACN) [X400, scale bar: 20 μm].</p>
Full article ">Figure 2
<p>Expression of EMP 1, 2, and 3 in adrenal cortical neoplasm. Adrenal cortical carcinomas (ACC) show higher expression of EMP 1 and 3 than that of adrenal cortical adenomas (ACA) [X400, scale bar: 20 μm].</p>
Full article ">Figure 3
<p>Correlations between EMP 1, 2, and 3 expressions and the clinicopathological factors of adrenal neoplasm.</p>
Full article ">Figure 4
<p>The impact of EMP 1 and 3 expressions in ACN on patient prognosis. EMP 1 and 3 were found to be significantly associated with overall survival (OS), with high EMP 1 and 3 expression levels being associated with shorter OS in adrenal cortical neoplasm (<span class="html-italic">p</span> = 0.001).</p>
Full article ">
16 pages, 4422 KiB  
Article
Inhibitory Effects of Simvastatin on IL-33-Induced MCP-1 via the Suppression of the JNK Pathway in Human Vascular Endothelial Cells
by Katsuyuki Umebashi, Masayoshi Yamamoto, Akinori Tokito, Ku Sudou, Yoko Takenoshita and Michihisa Jougasaki
Int. J. Mol. Sci. 2023, 24(16), 13015; https://doi.org/10.3390/ijms241613015 - 21 Aug 2023
Cited by 2 | Viewed by 1454
Abstract
An alarmin, interleukin (IL)-33 is a danger signal that causes inflammation, inducing chemotactic proteins such as monocyte chemoattractant protein (MCP)-1 in various cells. As statins have pleiotropic actions including anti-inflammatory properties, we investigated the effects of simvastatin on IL-33-induced MCP-1 expression in human [...] Read more.
An alarmin, interleukin (IL)-33 is a danger signal that causes inflammation, inducing chemotactic proteins such as monocyte chemoattractant protein (MCP)-1 in various cells. As statins have pleiotropic actions including anti-inflammatory properties, we investigated the effects of simvastatin on IL-33-induced MCP-1 expression in human umbilical vein endothelial cells (HUVECs). HUVECs were stimulated with IL-33 in the presence or absence of simvastatin. Gene expression and protein secretion of MCP-1, phosphorylation of mitogen-activated protein kinase (MAPK), nuclear translocation of phosphorylated c-Jun, and human monocyte migration were investigated. Immunocytochemical staining and Western immunoblot analysis revealed that IL-33 augmented MCP-1 protein expression in HUVECs. Real-time reverse transcription–polymerase chain reaction (RT-PCR) and enzyme-linked immunosorbent assay (ELISA) showed that IL-33 significantly increased MCP-1 mRNA and protein secretion, which were suppressed by c-jun N-terminal kinase (JNK) inhibitor SP600125 and p38 MAPK inhibitor SB203580. Simvastatin inhibited IL-33-induced MCP-1 mRNA, protein secretion, phosphorylation of JNK and c-Jun. Additionally, the IL-33-induced nuclear translocation of phosphorylated c-Jun and THP-1 monocyte migration were also blocked by simvastatin. This study demonstrated that IL-33 induces MCP-1 expression via the JNK and p38 MAPK pathways in HUVECs, and that simvastatin inhibits MCP-1 production by selectively suppressing JNK. Simvastatin may inhibit the progression of IL-33-induced inflammation via suppressing JNK to prevent MCP-1 production. Full article
(This article belongs to the Section Molecular Immunology)
Show Figures

Figure 1

Figure 1
<p>Interleukin (IL)-33-stimulated monocyte chemoattractant protein (MCP)-1 protein expression in human umbilical vein endothelial cells (HUVECs). (<b>A</b>) Representative immunocytochemical staining showing the localization of MCP-1 in HUVECs with or without exposure to 10<sup>−9</sup> mol/L of IL-33 for 24 h. Intensity of immunoreactivity for MCP-1 was increased in HUVECs treated with IL-33 compared with the untreated cells. Original magnification: ×400. Scale bar = 50 μm. (<b>B</b>) Semiquantitative analysis of staining intensity of immunoreactivity for MCP-1. * <span class="html-italic">p</span> &lt; 0.05 vs. untreated cells.</p>
Full article ">Figure 2
<p>(<b>A</b>) Western immunoblot analysis of the whole-cell lysates using anti-MCP-1 antibody in HUVECs with or without exposure to 10<sup>−9</sup> mol/L of IL-33 for 24 h. (<b>B</b>) Bars represent densitometric data of each expression signal after normalization to β-actin and relative to the untreated cells. MCP-1 protein expression was increased in HUVECs treated with IL-33 compared with the untreated cells. * <span class="html-italic">p</span> &lt; 0.05 vs. untreated cells.</p>
Full article ">Figure 3
<p>IL-33-stimulated gene expression and protein secretion of MCP-1 in HUVECs. (<b>A</b>) MCP-1 mRNA expression in HUVECs after treatment with the indicated concentrations of IL-33 for 8 h (<span class="html-italic">n</span> = 3), as evaluated by real-time reverse transcription–polymerase chain reaction (RT-PCR). (<b>B</b>) Time course of MCP-1 mRNA after treatment with 10<sup>−9</sup> mol/L of IL-33 (<span class="html-italic">n</span> = 3), as evaluated by real-time RT-PCR. Bars represent MCP-1 mRNA after normalization to glyceraldehyde-3-phosphate dehydrogenase (GAPDH) mRNA and relative to the untreated control (cont) in (<b>A</b>) and 0 h in (<b>B</b>). (<b>C</b>) MCP-1 concentrations in the supernatant after treatment with the indicated concentrations of IL-33 for 24 h (<span class="html-italic">n</span> = 6), as analyzed by enzyme-linked immunosorbent assay (ELISA). Bars represent MCP-1 protein secretion per 10<sup>5</sup> cells. (<b>D</b>) Time course of MCP-1 concentrations in the supernatant after treatment with 10<sup>−9</sup> mol/L of IL-33 (closed circles, <span class="html-italic">n</span> = 6), as analyzed by ELISA. Spontaneous secretion of MCP-1 without IL-33 treatment is shown in open circles (<span class="html-italic">n</span> = 6), as analyzed by ELISA. * <span class="html-italic">p</span> &lt; 0.05 vs. cont in (<b>A</b>,<b>C</b>), vs. 0 h in (<b>B</b>), and vs. each control at the same time in (<b>D</b>).</p>
Full article ">Figure 4
<p>IL-33-activated mitogen-activated protein kinase (MAPK) pathway in HUVECs. (<b>A</b>–<b>C</b>) Western immunoblot analysis showed that IL-33 stimulated the phosphorylation of c-jun N-terminal kinase (JNK) (<b>A</b>), p38 MAPK (<b>B</b>), and extracellular signal-regulated kinase (ERK) 1/2 (<b>C</b>). HUVECs were treated with 10<sup>−9</sup> mol/L of IL-33 for 5, 15, 30, 60, and 120 min. Bars represent results from densitometric analyses of each phosphorylation signal after normalization to total protein and relative to the untreated control (0 min). Blots are representative of three independent experiments. * <span class="html-italic">p</span> &lt; 0.05 vs. 0 min.</p>
Full article ">Figure 5
<p>Effects of pharmacological inhibitors of MAPK pathway on IL-33-induced gene expression and protein secretion of MCP-1 in HUVECs. (<b>A</b>,<b>B</b>) HUVECs were pre-incubated with SP600125 (30 μmol/L), SB203580 (10 μmol/L), and PD98059 (30 μmol/L) for 2 h, followed by stimulation with IL-33 (10<sup>−9</sup> mol/L) for 8 h ((<b>A</b>), MCP-1 mRNA) or with IL-33 (10<sup>−9</sup> mol/L) for 24 h ((<b>B</b>), MCP-1 secretion). MCP-1 mRNA was evaluated by real-time RT-PCR ((<b>A</b>), <span class="html-italic">n</span> = 3), and MCP-1 concentration was examined by ELISA ((<b>B</b>), <span class="html-italic">n</span> = 6). * <span class="html-italic">p</span> &lt; 0.05 vs. untreated control. † <span class="html-italic">p</span> &lt; 0.05 vs. IL-33.</p>
Full article ">Figure 6
<p>Effects of simvastatin on cell viability. HUVECs were treated with different concentrations of simvastatin for 24 h. Cell viability was measured by MTT assay. The results are expressed as percentage of the untreated control, and each value represents five independent experiments (<span class="html-italic">n</span> = 5). * <span class="html-italic">p</span> &lt; 0.05 vs. untreated control (cont).</p>
Full article ">Figure 7
<p>Effects of simvastatin on gene expression and protein secretion MCP-1 in HUVECs. IL-33-induced MCP-1 gene expression (<b>A</b>) and MCP-1 protein secretion (<b>B</b>) were suppressed by simvastatin. HUVECs were treated with IL-33 (10<sup>−9</sup> mol/L) for 8 h (<b>A</b>) or 24 h (<b>B</b>) with or without pretreatment with simvastatin (0.1 to 10 μmol/L). Bars represent MCP-1 mRNA after normalization to GAPDH mRNA and relative to the untreated control in (<b>A</b>). Bars represent MCP-1 protein secretion per 10<sup>5</sup> cells in (<b>B</b>). * <span class="html-italic">p</span> &lt; 0.05 vs. untreated control. † <span class="html-italic">p</span> &lt; 0.05 vs. IL-33.</p>
Full article ">Figure 8
<p>Effects of simvastatin on IL-33-induced phosphorylation of JNK, p38 MAPK, and c-Jun. (<b>A</b>,<b>B</b>) Simvastatin dose-dependently suppressed phosphorylation of JNK (<b>A</b>) but did not inhibit phosphorylation of p38 MAPK (<b>B</b>). HUVECs were pretreated with simvastatin and then incubated with IL-33 (10<sup>−9</sup> mol/L) for 15 min. Bars represent results from densitometric analyses of each phosphorylation signal after normalization to total protein and relative to the untreated control. Blots are representative of three independent experiments. * <span class="html-italic">p</span> &lt; 0.05 vs. untreated control. † <span class="html-italic">p</span> &lt; 0.05 vs. IL-33. (<b>C</b>) Time course of IL-33-induced phosphorylation of c-Jun as evaluated by Western immunoblot analysis. HUVECs were treated with IL-33 (10<sup>−9</sup> mol/L) for the indicated time periods. Bars represent results from densitometric analyses of each phosphorylation signal after normalization to total protein and relative to the untreated control (0 min). Blots are representative of three independent experiments. * <span class="html-italic">p</span> &lt; 0.05 vs. 0 min. † <span class="html-italic">p</span> &lt; 0.05 vs. IL-33. (<b>D</b>) Simvastatin dose-dependently suppressed phosphorylation of c-Jun. HUVECs were pretreated with simvastatin and then incubated with IL-33 (10<sup>−9</sup> mol/L) for 30 min. Bars represent results from densitometric analyses of each phosphorylation signal after normalization to total protein and relative to the untreated control. Blots are representative of three independent experiments. * <span class="html-italic">p</span> &lt; 0.05 vs. untreated control. † <span class="html-italic">p</span> &lt; 0.05 vs. IL-33.</p>
Full article ">Figure 9
<p>Effects of simvastatin on IL-33-induced translocation of phospho-c-Jun to the nucleus as determined by immunofluorescence staining. HUVECs were pretreated with simvastatin (10 μmol/L) or simvastatin plus mevalonate (100 μmol/L), followed by additional incubation with IL-33 (10<sup>−9</sup> mol/L) for 30 min. (<b>A</b>) Representative immunofluorescence images showing the localization of phospho-c-Jun in HUVECs. Red staining indicates the specific Alexa staining for phospho-c-Jun, and blue staining indicates the nuclei (Hoechst 33342). Original magnification: ×400. Scale bar = 50 μm. (<b>B</b>) Percentages of phospho-c-Jun-positive cells relative to total cell numbers. * <span class="html-italic">p</span> &lt; 0.05 vs. untreated control. † <span class="html-italic">p</span> &lt; 0.05 vs. IL-33.</p>
Full article ">Figure 10
<p>Effects of simvastatin on THP-1 monocyte migration as determined by chemotaxis assay. Relative migration indicates the ratio of migrating THP-1 cells towards the culture medium from HUVECs treated with various reagents relative to those from the untreated cells. THP-1 monocyte chemotaxis was promoted in response to the culture medium treated with 10<sup>−9</sup> mol/L of IL-33. Pre-incubation of the culture medium with polyclonal anti-MCP-1 antibody (80 μg/mL), but not with goat IgG, resulted in an inhibition of chemotaxis. Simvastatin (10 μmol/L) inhibited IL-33-induced THP-1 monocyte chemotaxis, which was reversed by the addition of mevalonate. Recombinant human MCP-1 (100 nmol/L) served as a positive control. Bars represent mean ± SD of three independent experiments. * <span class="html-italic">p</span> &lt; 0.05 vs. untreated control. † <span class="html-italic">p</span> &lt; 0.05 vs. IL-33.</p>
Full article ">
14 pages, 2326 KiB  
Review
Giant Arachnoid Granulations: A Systematic Literature Review
by Rupal I. Mehta and Rashi I. Mehta
Int. J. Mol. Sci. 2023, 24(16), 13014; https://doi.org/10.3390/ijms241613014 - 21 Aug 2023
Cited by 1 | Viewed by 2706
Abstract
Giant arachnoid granulations (GAGs) are minimally investigated. Here, we systematically review the available data in published reports to better understand their etiologies, nomenclature, and clinical significance. In the literature, 195 GAGs have been documented in 169 persons of varied ages (range, 0.33 to [...] Read more.
Giant arachnoid granulations (GAGs) are minimally investigated. Here, we systematically review the available data in published reports to better understand their etiologies, nomenclature, and clinical significance. In the literature, 195 GAGs have been documented in 169 persons of varied ages (range, 0.33 to 91 years; mean, 43 ± 20 years; 54% female). Prior reports depict intrasinus (i.e., dural venous sinus, DVS) (84%), extrasinus (i.e., diploic or calvarial) (15%), and mixed (1%) GAG types that exhibit pedunculated, sessile, or vermiform morphologies. GAG size ranged from 0.4 to 6 cm in maximum dimension (mean, 1.9 ± 1.1 cm) and encompassed symptomatic or non-symptomatic enlarged arachnoid granulations (≥1 cm) as well as symptomatic subcentimeter arachnoid granulations. A significant difference was identified in mean GAG size between sex (females, 1.78 cm; males, 3.39 cm; p < 0.05). The signs and symptoms associated with GAGs varied and include headache (19%), sensory change(s) (11%), and intracranial hypertension (2%), among diverse and potentially serious sequelae. Notably, brain herniation was present within 38 GAGs (22%). Among treated individuals, subsets were managed medically (19 persons, 11%), surgically (15 persons, 9%), and/or by endovascular DVS stenting (7 persons, 4%). Histologic workup of 53 (27%) GAG cases depicted internal inflammation (3%), cystic change consistent with fluid accumulation (2%), venous thrombosis (1%), hemorrhage (1%), meningothelial hyperplasia (1%), lymphatic vascular proliferation (1%), and lymphatic vessel obliteration (1%). This review emphasizes heterogeneity in GAG subtypes, morphology, composite, location, symptomatology, and imaging presentations. Additional systematic investigations are needed to better elucidate the pathobiology, clinical effects, and optimal diagnostic and management strategies for enlarged and symptomatic arachnoid granulation subtypes, as different strategies and size thresholds are likely applicable for medical, interventional, and/or surgical treatment of these structures in distinct brain locations. Full article
(This article belongs to the Special Issue Microanatomical and Molecular Updates on Brain Aging)
Show Figures

Figure 1

Figure 1
<p>PRISMA flow diagram.</p>
Full article ">Figure 2
<p>(<b>A</b>) Summary of the age distribution of persons with GAGs, according to decade of life. (<b>B</b>) GAG size distribution according to age. (<b>C</b>) Summary of GAG distribution by location.</p>
Full article ">Figure 3
<p>Anatomy of GAG. H&amp;E-stained section of a GAG dome that was resected from an adult patient with post-traumatic headache revealed a multilaminar structure composed of a capsule, subcapsular space, and core (<b>A</b>). The subcapsular space contained blood and cells. On a high-power exam, a thrombosed vein (<b>B</b>) and foam cells (<b>C</b>) were present within the structure. Immunohistochemistry for CD68 highlighted a prominent number of cells, consistent with macrophages (<b>D</b>). Scale bars = (<b>A</b>,<b>B</b>), 100 µm; (<b>C</b>,<b>D</b>), 10 µm. Copped areas (black boxes in (<b>A</b>)) are shown in (<b>B</b>–<b>D</b>). Images reproduced from <span class="html-italic">Int. J. Mol. Sci.</span> <b>2023</b>, <span class="html-italic">24</span>, 11410 [<a href="#B45-ijms-24-13014" class="html-bibr">45</a>].</p>
Full article ">Figure 4
<p>Imaging of an individual with multiple intrasinus-type GAGs. (<b>A</b>) Post-contrast T1-weighted brain MRI axial image shows two GAGs along the right and left lateral transverse sinuses, with severe sinus narrowing on the left (arrow). (<b>B</b>) CT venogram axial image further depicts the two GAGs with severe left lateral transverse sinus luminal narrowing (arrow). Images reproduced from <span class="html-italic">Int. J. Mol. Sci.</span> <b>2023</b>, <span class="html-italic">24</span>, 11410 [<a href="#B45-ijms-24-13014" class="html-bibr">45</a>].</p>
Full article ">
15 pages, 5116 KiB  
Article
Determination of Kinetic Parameters and Identification of the Rate-Determining Steps in the Oxygen Exchange Process for LaNi0.6Fe0.4O3−δ
by Natalia Porotnikova, Dmitriy Zakharov, Anna Khodimchuk, Edhem Kurumchin and Denis Osinkin
Int. J. Mol. Sci. 2023, 24(16), 13013; https://doi.org/10.3390/ijms241613013 - 21 Aug 2023
Cited by 3 | Viewed by 1134
Abstract
The mixed ionic and electronic oxide LaNi0.6Fe0.4O3−δ (LNF) is a promising ceramic cathode material for solid oxide fuel cells. Since the reaction rate of oxygen interaction with the cathode material is extremely important, the present work considers [...] Read more.
The mixed ionic and electronic oxide LaNi0.6Fe0.4O3−δ (LNF) is a promising ceramic cathode material for solid oxide fuel cells. Since the reaction rate of oxygen interaction with the cathode material is extremely important, the present work considers the oxygen exchange mechanism between O2 and LNF oxide. The kinetic dependence of the oxygen/oxide interaction has been determined by two isotopic methods using 18O-labelled oxygen. The application of the isotope exchange with the gas phase equilibrium (IE-GPE) and the pulsed isotope exchange (PIE) has provided information over a wide range of temperatures (350–800 °C) and oxygen pressures (10–200 mbar), as each method has different applicability limits. Applying mathematical models to treat the kinetic relationships, the oxygen exchange rate (rH, atom × cm−2 × s−1) and the diffusion coefficient (D, cm2/s) were calculated. The values of rH and D depend on both temperature and oxygen pressure. The activation energy of the surface exchange rate is 0.73 ± 0.05 eV for the PIE method at 200 mbar, and 0.48 ± 0.02 eV for the IE-GPE method at 10–20 mbar; for the diffusion coefficient, the activation energy equals 0.62 ± 0.01 eV at 10–20 mbar for the IE-GPE method. Differences in the mechanism of oxygen exchange and diffusion on dense and powder samples are observed due to the different microstructure and surface morphology of the samples. The influence of oxygen pressure on the ratio of contributions of different exchange types to the total oxygen exchange rate is demonstrated. For the first time, the rate-determining step in the oxygen exchange process for LNF material has been identified. This paper discusses the reasons for the difference in the mechanisms of oxygen exchange and diffusion. Full article
(This article belongs to the Special Issue State-of-the-Art Materials Science in Russia—2nd Edition)
Show Figures

Figure 1

Figure 1
<p>X-ray diffraction pattern (dots and line), where the vertical bars are the Bragg positions for the LaNi<sub>0.6</sub>Fe<sub>0.4</sub>O<sub>3−<span class="html-italic">δ</span></sub> crystal structure. The insertion corresponds to the structure LaNi<sub>0.6</sub>Fe<sub>0.4</sub>O<sub>3−<span class="html-italic">δ</span></sub>: <a href="https://materials.springer.com/isp/crystallographic/docs/sd_1044291" target="_blank">https://materials.springer.com/isp/crystallographic/docs/sd_1044291</a>, 17 July 2023. (<b>a</b>) and volume particle size distribution (<b>b</b>) of LNF powder.</p>
Full article ">Figure 2
<p>SEM image with EDX mapping analysis (<b>a</b>) and BSE image (<b>b</b>) of LNF plate.</p>
Full article ">Figure 3
<p>Temperature dependence of the oxygen isotopologue fractions (<span class="html-italic">x</span><sub>32</sub>, <span class="html-italic">x</span><sub>34</sub>, <span class="html-italic">x</span><sub>36</sub>) and the <sup>18</sup>O fraction (<span class="html-italic">α</span>) in the gas phase at 3.6 L/h gas carrier flow (<b>a</b>), in the insert is a schematic mechanism of oxygen exchange between O<sub>2</sub> and surface; interaction time dependencies of the <sup>18</sup>O fraction and the <span class="html-italic">Y</span> variable at 350–550 °C (<b>b</b>) obtained in the PIE experiments.</p>
Full article ">Figure 4
<p>The time dependencies of the oxygen isotopologues fraction at 800 °C (<b>a</b>) and the <sup>18</sup>O fraction (<span class="html-italic">α</span>) at 600–800 °C (<b>b</b>) obtained in the IE-GPE experiments at 10 mbar.</p>
Full article ">Figure 5
<p>Arrhenius-type plot of the oxygen diffusion coefficient of LNF oxide measuring by different isotopic methods [<a href="#B34-ijms-24-13013" class="html-bibr">34</a>,<a href="#B35-ijms-24-13013" class="html-bibr">35</a>].</p>
Full article ">Figure 6
<p>Arrhenius-type plot (<b>a</b>) and <span class="html-italic">P</span><sub>O<sub>2</sub></sub>-type plot at 800 °C (<b>b</b>) of the surface exchange coefficient of LNF oxide measured by different isotopic methods [<a href="#B34-ijms-24-13013" class="html-bibr">34</a>,<a href="#B35-ijms-24-13013" class="html-bibr">35</a>].</p>
Full article ">Figure 7
<p>Contributions of the three types of oxygen exchange from pressure at 600 °C (<b>a</b>); temperature dependencies of dissociative adsorption and incorporation rates at different oxygen pressures (<b>b</b>).</p>
Full article ">
26 pages, 5688 KiB  
Article
Unveiling the Link: Exploring Mitochondrial Dysfunction as a Probable Mechanism of Hepatic Damage in Post-Traumatic Stress Syndrome
by Marina V. Kondashevskaya, Lyudmila M. Mikhaleva, Kseniya A. Artem’yeva, Valentina V. Aleksankina, David A. Areshidze, Maria A. Kozlova, Anton A. Pashkov, Eugenia B. Manukhina, H. Fred Downey, Olga B. Tseilikman, Oleg N. Yegorov, Maxim S. Zhukov, Julia O. Fedotova, Marina N. Karpenko and Vadim E. Tseilikman
Int. J. Mol. Sci. 2023, 24(16), 13012; https://doi.org/10.3390/ijms241613012 - 21 Aug 2023
Cited by 2 | Viewed by 1388
Abstract
PTSD is associated with disturbed hepatic morphology and metabolism. Neuronal mitochondrial dysfunction is considered a subcellular determinant of PTSD, but a link between hepatic mitochondrial dysfunction and hepatic damage in PTSD has not been demonstrated. Thus, the effects of experimental PTSD on the [...] Read more.
PTSD is associated with disturbed hepatic morphology and metabolism. Neuronal mitochondrial dysfunction is considered a subcellular determinant of PTSD, but a link between hepatic mitochondrial dysfunction and hepatic damage in PTSD has not been demonstrated. Thus, the effects of experimental PTSD on the livers of high anxiety (HA) and low anxiety (LA) rats were compared, and mitochondrial determinants underlying the difference in their hepatic damage were investigated. Rats were exposed to predator stress for 10 days. Then, 14 days post-stress, the rats were evaluated with an elevated plus maze and assigned to HA and LA groups according to their anxiety index. Experimental PTSD caused dystrophic changes in hepatocytes of HA rats and hepatocellular damage evident by increased plasma ALT and AST activities. Mitochondrial dysfunction was evident as a predominance of small-size mitochondria in HA rats, which was positively correlated with anxiety index, activities of plasma transaminases, hepatic lipids, and negatively correlated with hepatic glycogen. In contrast, LA rats had a predominance of medium-sized mitochondria. Thus, we show links between mitochondrial dysfunction, hepatic damage, and heightened anxiety in PTSD rats. These results will provide a foundation for future research on the role of hepatic dysfunction in PTSD pathogenesis. Full article
(This article belongs to the Special Issue Liver Damage and Repair 2.0)
Show Figures

Graphical abstract

Graphical abstract
Full article ">Figure 1
<p>Differences in plasma corticosterone concentrations between the control, low anxiety, and high anxiety groups of rats. In this and in similar figures, the boxes include the middle 50% of the data, i.e., from the 25th to the 75th percentile, with the median value shown by the horizontal line. The whiskers include data that fall within 1.5 times the interquartile range. <span class="html-italic">p</span>-values were determined by non-parametric analysis. Control n = 10; High Anxiety n = 9; Low Anxiety n = 10. * <span class="html-italic">p</span> &lt; 0.05, *** <span class="html-italic">p</span> &lt; 0.001.</p>
Full article ">Figure 2
<p>Effects of PS on cytokine concentrations in plasma and liver. * <span class="html-italic">p</span> &lt; 0.05, ** <span class="html-italic">p</span> &lt; 0.01, *** <span class="html-italic">p</span> &lt; 0.001, NS, not significant. (<b>A</b>) plasma IL-6; (<b>B</b>) liver IL-6; (<b>C</b>) plasma IL-4; (<b>D</b>) liver IL-4; (<b>E</b>) plasma IL-1; (<b>F</b>) liver, IL-1; (<b>G</b>) plasma IL-2; (<b>H</b>) liver IL-2; (<b>I</b>) plasma IL-10; (<b>J</b>) liver IL-10.</p>
Full article ">Figure 3
<p>Oxidative stress in the liver as reflected by hepatic superoxide dismutase (SOD), ketodienes, and conjugated trienes. * <span class="html-italic">p</span> &lt; 0.05, ** <span class="html-italic">p</span> &lt; 0.01, *** <span class="html-italic">p</span> &lt; 0.001, NS, not significant. (<b>A</b>) Hepatic SOD activity; (<b>B</b>) Hepatic concentrations of ketodienes and conjugated trienes; (<b>C</b>) Mitochondrial concntrations of ketodienes and conjugated trienes. SOD activity is expressed in units min<sup>−1</sup> mg protein; ketodienes and conjugated trienes are expressed as oxidation indices E278/220.</p>
Full article ">Figure 4
<p>AST and ALT activity in plasma and liver. * <span class="html-italic">p</span> &lt; 0.05, ** <span class="html-italic">p</span> &lt; 0.01, *** <span class="html-italic">p</span> &lt; 0.001, NS, not significant. (<b>A</b>) AST activity in liver; (<b>B</b>) ALT activity in liver; (<b>C</b>) AST activity in plasma; (<b>D</b>) ALT activity in plasma.</p>
Full article ">Figure 5
<p>Liver weight and weight index values in control and stress-exposed rats. * <span class="html-italic">p</span> &lt; 0.05, *** <span class="html-italic">p</span> &lt; 0.001, NS, not significant. (<b>A</b>) Liver weight; (<b>B</b>) Liver index.</p>
Full article ">Figure 6
<p>Ultrastructure of liver cells of control rats (<b>A</b>), LA rats (<b>B</b>), and HA (<b>C</b>) rats. N, nucleus; Sm, small mitochondria; Mm, medium mitochondria; Bm, big mitochondria; ER, endoplasmic reticulum; LD, lipid droplets. Bar = 5 µm.</p>
Full article ">Figure 7
<p>Liver sections stained with Schiff reagent for glycogen (PAS reaction). (<b>A</b>) Control rat; (<b>B</b>) LA rat; (<b>C</b>) HA rat.</p>
Full article ">Figure 8
<p>Liver sections stained with Sudan III for lipids. (<b>A</b>) Control rat; (<b>B</b>) LA rat; (<b>C</b>) HA rat. Reddish-orange spots in hepatocytes are neutral lipids.</p>
Full article ">Figure 9
<p>Liver sections stained with bromophenol blue for protein content. (<b>A</b>) Control rat; (<b>B</b>) LA rat; (<b>C</b>) HA rat.</p>
Full article ">Figure 10
<p>Optical density (optical density units, ODU) of liver sections stained for (<b>A</b>) neutral fats, Sudan III, (<b>B</b>) glycogen, periodic acid-Schiff (PAS) reaction, (<b>C</b>) protein, bromophenol blue. * <span class="html-italic">p</span> &lt; 0.05, ** <span class="html-italic">p</span> &lt; 0.01, *** <span class="html-italic">p</span> &lt; 0.001, NS, not significant.</p>
Full article ">Figure 11
<p>Glucose (<b>A</b>), triglycerides (<b>B</b>), cholesterol (<b>C</b>), and low-density (<b>D</b>) and high-density (<b>E</b>) lipoprotein concentrations in blood of control, HA, and LA rats. * <span class="html-italic">p</span> &lt; 0.05, ** <span class="html-italic">p</span> &lt; 0.01, *** <span class="html-italic">p</span> &lt; 0.001, NS, not significant.</p>
Full article ">Figure 12
<p>Ceruloplasmin in control and stress-exposed rats. * <span class="html-italic">p</span> &lt; 0.05, NS, not significant.</p>
Full article ">Figure 13
<p>A positive feedback loop explains the interrelations between liver damage and anxiety in HA rats exposed to experimental PS.</p>
Full article ">Figure 14
<p>Correlation matrix showing the relationship between measured variables in PS-exposed rats. Respective r values are indicated by the color bar below the matrix. <span class="html-italic">p</span> &lt; 0.05 for all colored correlations. Details are shown in the <a href="#app1-ijms-24-13012" class="html-app">Supplementary File</a>.</p>
Full article ">
31 pages, 2213 KiB  
Review
Periodontal Disease and Its Association with Metabolic Syndrome—A Comprehensive Review
by Itay Aizenbud, Asaf Wilensky and Galit Almoznino
Int. J. Mol. Sci. 2023, 24(16), 13011; https://doi.org/10.3390/ijms241613011 - 21 Aug 2023
Cited by 14 | Viewed by 3378
Abstract
Periodontal disease is a complex and progressive chronic inflammatory condition that leads to the loss of alveolar bone and teeth. It has been associated with various systemic diseases, including diabetes mellitus and obesity, among others. Some of these conditions are part of the [...] Read more.
Periodontal disease is a complex and progressive chronic inflammatory condition that leads to the loss of alveolar bone and teeth. It has been associated with various systemic diseases, including diabetes mellitus and obesity, among others. Some of these conditions are part of the metabolic syndrome cluster, a group of interconnected systemic diseases that significantly raise the risk of cardiovascular diseases, diabetes mellitus, and stroke. The metabolic syndrome cluster encompasses central obesity, dyslipidemia, insulin resistance, and hypertension. In this review, our objective is to investigate the correlation between periodontal disease and the components and outcomes of the metabolic syndrome cluster. By doing so, we aim to gain insights into the fundamental mechanisms that link each systemic condition with the metabolic syndrome. This deeper understanding of the interplay between these conditions and periodontal disease can pave the way for more effective treatments that take into account the broader impact of managing periodontal disease on the comprehensive treatment of systemic diseases, and vice versa. Full article
Show Figures

Scheme 1

Scheme 1
<p>The selection method for publications included in this review.</p>
Full article ">Scheme A1
<p>The selection method for publication assessing the association between periodontal disease and metabolic syndrome.</p>
Full article ">Scheme A2
<p>The selection method for publication assessing the association between periodontal disease and obesity.</p>
Full article ">Scheme A3
<p>The selection method for publications assessing the association between periodontal disease and insulin resistance.</p>
Full article ">Scheme A4
<p>The selection method for publications assessing the association between periodontal disease and Diabetes mellitus.</p>
Full article ">Scheme A5
<p>The selection method for publication assessing the association between periodontal disease and hyperlipidemia.</p>
Full article ">Scheme A6
<p>The selection method for publication assessing the association between periodontal disease and hypertension.</p>
Full article ">Figure A1
<p>The mechanism of inflammation, including systemic inflammation, which in turn may lead to gingival inflammation and later on to periodontal disease. The gingival inflammatory state releases pro-inflammatory mediators (mainly cytokines and ROS) to the general bloodstream, which later on may cause a systemic inflammatory state which may initiate or worsen already established components of the metabolic syndrome. The components are known to increase the inflammatory state of the body by releasing pro-inflammatory mediators which in turn may cause gingival inflammation.</p>
Full article ">Figure A2
<p>The mechanism of microbiology includes systemic inflammation caused by metabolic syndrome components which in turn may lead to gingival inflammation. The gingival inflammation causes the gingiva to become more permeable, which may later end in periodontal disease. In periodontal disease, there is an increase in perio-pathogens which may invade systemically through the bloodstream, which may initiate or worsen already established components of the metabolic syndrome. The components are known to increase the inflammatory state of the body by releasing pro-inflammatory mediators which in turn may cause gingival inflammation.</p>
Full article ">
16 pages, 2522 KiB  
Article
Depressive-like Behaviors Induced by mGluR5 Reduction in 6xTg in Mouse Model of Alzheimer’s Disease
by Youngkyo Kim, Jinho Kim, Shinwoo Kang and Keun-A Chang
Int. J. Mol. Sci. 2023, 24(16), 13010; https://doi.org/10.3390/ijms241613010 - 21 Aug 2023
Cited by 1 | Viewed by 1768
Abstract
Alzheimer’s disease (AD) is one representative dementia characterized by the accumulation of amyloid beta (Aβ) plaques and neurofibrillary tangles (NFTs) in the brain, resulting in cognitive decline and memory loss. AD is associated with neuropsychiatric symptoms, including major depressive disorder (MDD). Recent studies [...] Read more.
Alzheimer’s disease (AD) is one representative dementia characterized by the accumulation of amyloid beta (Aβ) plaques and neurofibrillary tangles (NFTs) in the brain, resulting in cognitive decline and memory loss. AD is associated with neuropsychiatric symptoms, including major depressive disorder (MDD). Recent studies showed a reduction in mGluR5 expression in the brains of stress-induced mice models and individuals with MDD compared to controls. In our study, we identified depressive-like behavior and memory impairment in a mouse model of AD, specifically in the 6xTg model with tau and Aβ pathologies. In addition, we investigated the expression of mGluR5 in the brains of 6xTg mice using micro-positron emission tomography (micro-PET) imaging, histological analysis, and Western blot analysis, and we observed a decrease in mGluR5 levels in the brains of 6xTg mice compared to wild-type (WT) mice. Additionally, we identified alterations in the ERK/AKT/GSK-3β signaling pathway in the brains of 6xTg mice. Notably, we identified a significant negative correlation between depressive-like behavior and the protein level of mGluR5 in 6xTg mice. Additionally, we also found a significant positive correlation between depressive-like behavior and AD pathologies, including phosphorylated tau and Aβ. These findings suggested that abnormal mGluR5 expression and AD-related pathologies were involved in depressive-like behavior in the 6xTg mouse model. Further research is warranted to elucidate the underlying mechanisms and explore potential therapeutic targets in the intersection of AD and depressive-like symptoms. Full article
(This article belongs to the Collection Feature Papers in Molecular Neurobiology)
Show Figures

Figure 1

Figure 1
<p>Formation of Aβ and p-tau and cognitive impairment in 6xTg mice. (<b>A</b>) Memory deficits in 4-month-old 6xTg mice. The human APP and tau were measured in the cortex of mice (<span class="html-italic">n</span> = 3 per group). (<b>B</b>) The immunohistochemistry (IHC) image showed the Aβ and p-tau staining using 4G8 and AT8 antibodies in the brain of mice (<span class="html-italic">n</span> = 3 per group 100 μm). Cognitive impairment was observed using (<b>C</b>) Y-maze test (<span class="html-italic">n</span> = 6–7 per group), (<b>D</b>) Passive avoidance test (<span class="html-italic">n</span> = 6–7 per group), and (<b>E</b>) Morris water maze (<span class="html-italic">n</span> = 6–7 per group) in 6xTg mice. Data are presented as means ± SEM. ns = non significant, *** <span class="html-italic">p</span> &lt; 0.001 vs. WT. Statistical significance between the two groups was determined using the Student’s <span class="html-italic">t</span>-test and for MWM, a two-way repeated-measures ANOVA followed by a Bonferroni multiple comparisons correction was used to compare the escape latency in 4 days of continuous hidden platform trials.</p>
Full article ">Figure 2
<p>Depressive-like behaviors in 6xTg mice. (<b>A</b>) Depressive-like behavior experiments, including forced swimming test and novelty suppressed feeding test, were conducted on WT and 6xTg mice aged 6 and 8 months. (<b>B</b>) The forced swimming test (FST) and (<b>C</b>) novelty-suppressed feeding test (NSF) were carried out to assess and confirm the presence of depressive-like behaviors. Data are presented as means ± SEM (<span class="html-italic">n</span> = 6–7 per group). * <span class="html-italic">p</span> &lt; 0.05 and ** <span class="html-italic">p</span> &lt; 0.01 vs. WT. Statistical significance between the two groups was determined using the Student’s <span class="html-italic">t</span>-test.</p>
Full article ">Figure 3
<p>Reduction in mGluR5 density in the brains of 6xTg mice. (<b>A</b>,<b>C</b>) Representative images of [11C]-ABP688 in the brain of 4- and 6-month-old WT and 6xTg mice using micro-PET. (<b>B</b>,<b>D</b>) Quantitative analysis of ROI including cortex and hippocampus (<span class="html-italic">n</span> = 3 per group each month). (<b>E</b>) Representative Western blot images of mGluR5 protein levels in cortex and hippocampus of 4- and 6-month-old WT and 6xTg mice. (<b>F</b>) Quantitative analysis of mGluR5 expressions in the cortex and hippocampus (<span class="html-italic">n</span> = 6 per group each month). Data are presented as means ± SEM. ** <span class="html-italic">p</span> &lt; 0.01, *** <span class="html-italic">p</span> &lt; 0.001 and **** <span class="html-italic">p</span> &lt; 0.0001 vs. WT. Statistical significance between the two groups was determined using the Student’s <span class="html-italic">t</span>-test.</p>
Full article ">Figure 4
<p>Alteration of ERK/AKT/GSK-3β signaling pathway in the brains of 6xTg mice. (<b>A</b>) Representative Western blot images of p-ERK/t-ERK/p-AKT/t-ERK/p-GSK-3β/t-GSK-3β protein levels in the cortex of 8-month-old WT and 6xTg brains. (<b>B</b>) Quantitative analysis of p-ERK/t-ERK/p-AKT/t-ERK/p-GSK-3β/t-GSK-3β expressions in the cortex. (<b>C</b>) Representative Western blot images of p-ERK/t-ERK/p-AKT/t-ERK/p-GSK-3β/t-GSK-3β protein levels in the hippocampus. (<b>D</b>) Quantitative analysis of p-ERK/t-ERK/p-AKT/t-ERK/p-GSK-3β/t-GSK-3β expressions in the hippocampus. (<b>E</b>) Representative Western blot images of phosphorylated tau proteins in the cortex using AT8/AT180/pS396 antibodies. (<b>F</b>) Quantitative analysis of phosphorylated tau proteins in the cortex. (<b>G</b>) Representative Western blot images of phosphorylated tau proteins in the hippocampus using AT8/AT180/pS396 antibodies. (<b>H</b>) Quantitative analysis of phosphorylated tau proteins in the hippocampus. (<b>I</b>,<b>J</b>) Aβ42 protein levels in the cortex and hippocampus of mice were quantified using ELISA. All data are given as means ± SEM (<span class="html-italic">n</span> = 6 per group). * <span class="html-italic">p</span> &lt; 0.05, ** <span class="html-italic">p</span> &lt; 0.01, *** <span class="html-italic">p</span> &lt; 0.001, and **** <span class="html-italic">p</span> &lt; 0.0001 vs. WT. Statistical significance between the two groups was determined using the Student’s <span class="html-italic">t</span>-test.</p>
Full article ">Figure 5
<p>Correlations between depressive-like behavior and AD pathology in 6xTg mice. (<b>A</b>) The correlation between FST (depressive-like behavior) scores mGluR5, Aβ42, and p-tau (AD pathology) levels in the cortex of both WT and 6xTg mice. (<b>B</b>) The correlation between FST scores mGluR5, Aβ42, and p-tau levels in the hippocampus of both WT and 6xTg. Data are presented as means ± SEM (<span class="html-italic">n</span> = 5 per group). <span class="html-italic">p</span> &lt; 0.05 compared to the WT group with one-way ANOVA and post hoc Dunn’s multiple comparison test. Correlations were assessed using the nonparametric Spearman’s rank correlation test. Graphs show regression lines with 95% confidence intervals.</p>
Full article ">Figure 6
<p>Summary picture. Depression-like behavior correlated with mGlur5 expression or AD pathologies such as Aβ and tau pathologies. p-ERK causes Aβ deposition, and p-AKT increases pGSK-3B by inhibiting p-tau and increasing it. As a result, it affects depression-like behavior in 6xTg mice, which show increased levels of Aβ and p-tau compared to WT mice.</p>
Full article ">
14 pages, 4392 KiB  
Article
Establishment of RNA Interference Genetic Transformation System and Functional Analysis of FlbA Gene in Leptographium qinlingensis
by Tian Gan, Huanli An, Ming Tang and Hui Chen
Int. J. Mol. Sci. 2023, 24(16), 13009; https://doi.org/10.3390/ijms241613009 - 21 Aug 2023
Cited by 1 | Viewed by 1292
Abstract
Leptographium qinlingensis is a pathogenic fungus of Pinus armandii that is epidemic in the Qinling Mountains. However, an effective gene interference strategy is needed to characterize the pathogenic genes in this fungus on a functional level. Using the RNA silencing vector pSilent-1 as [...] Read more.
Leptographium qinlingensis is a pathogenic fungus of Pinus armandii that is epidemic in the Qinling Mountains. However, an effective gene interference strategy is needed to characterize the pathogenic genes in this fungus on a functional level. Using the RNA silencing vector pSilent-1 as a template, we established an RNA interference genetic transformation system mediated by Agrobacterium tumefaciens GV3101, which is suitable for the gene study for Leptographium qinlingensis by homologous recombination and strain interference system screening. The LqFlbA gene was silenced using the RNA interference approach described above, and the resulting transformants displayed various levels of silencing with a gene silencing effectiveness ranging from 41.8% to 91.4%. The LqFlbA-RNAi mutant displayed altered colony morphology, sluggish mycelium growth, and diminished pathogenicity toward the host P. armandii in comparison to the wild type. The results indicate that this method provides a useful reverse genetic system for studying the gene function of L. qinlingensis, and that LqFlbA plays a crucial role in the growth, development, and pathogenicity of L. qinlingensis. Full article
(This article belongs to the Special Issue Molecular Plant-Microbe Interactions 2.0)
Show Figures

Figure 1

Figure 1
<p>Antibiotic sensitivity of experimental strains. (<b>A</b>) Hygromycin B sensitivity of <span class="html-italic">L. qinlingensis</span>; (<b>B</b>) Cefotaxime sensitivity of <span class="html-italic">A. tumefaciens</span> GV3101; (<b>C</b>) Timentin sensitivity of <span class="html-italic">A. tumefaciens</span> GV3101.</p>
Full article ">Figure 2
<p>The effects of different cocultivation parameters on ATMT of <span class="html-italic">L. qinlingensis</span>. (<b>A</b>) Cocultivation temperature; (<b>B</b>) Cocultivation duration; (<b>C</b>) pH of the cocultivation medium; (<b>D</b>) Acetosyringone concentration; (<b>E</b>) The concentration of <span class="html-italic">A. tumefaciens</span> GV3101; (<b>F</b>) The conidia concentration of <span class="html-italic">L. qinlingensis</span>. The values are the means ± SE of three independent experiments. Error bars represent standard deviation from repeats. Different letters indicate a significant difference between different treatments (<span class="html-italic">p</span> &lt; 0.05).</p>
Full article ">Figure 3
<p>Molecular characterization of <span class="html-italic">FlbA</span> gene silencing transformants. (<b>A</b>) PCR amplification of recombinant fragment (484 bp), Hyg (1040 bp) using primers indicated in a from WT, LqFlbA-EV, and LqFlbA-RNAi transformants. (<b>B</b>) Transcriptional levels of LqFlbA in WT, LqFlbA-EV, and LqFlbA-RNAi transformants by real-time qRT-PCR analysis. Different letters indicate a significant difference between different treatments (<span class="html-italic">p</span> &lt; 0.05).</p>
Full article ">Figure 4
<p>Effect of <span class="html-italic">LqFlbA</span> silencing on the growth and reproduction of <span class="html-italic">L. qinlingensis</span>. (<b>A</b>) Growth rate of LqFlbA-EV and 3 RNAi transformants. The growth condition was obtained by calculating the area of the colony. The results represent the mean ± SE of three independent experiments. Different letters indicate a significant difference between different strains (<span class="html-italic">p</span> &lt; 0.05). (<b>B</b>) Phenotypes of LqFlbA-EV and 3 RNAi transformants on PDA plates (added 50 µg/mL hygromycin B).</p>
Full article ">Figure 5
<p>Effect of the <span class="html-italic">LqFlbA</span> on the pathogenicity of <span class="html-italic">L. qinlingensis</span>. (<b>A</b>) Disease spot length on <span class="html-italic">P. armandii</span> seedlings inoculated with WT and RNAi transformants. The wild type successfully colonized and grew on pine seedlings, while the LqFlbA-RNAi-3 and agar control did not produce a significant reaction. Each treatment was repeated three times with new sapling and fungal for each replicate. Different letters indicate a significant difference between different strains (<span class="html-italic">p</span> &lt; 0.05). (<b>B</b>) The wild type induced a brown lesion in the phloem and sapwood. (<b>C</b>) Hyphe of <span class="html-italic">L. qinlingensis</span> growing near the diseased spot tissue.</p>
Full article ">Figure 6
<p>Schematic diagram for constructing silencing vectors. Double-enzyme digestion was performed at the XhoI and ApaI sites to obtain the pSlient-1 vector linearized fragment. A fragment containing one pair of reverse complementary silencing targets was obtained by PCR amplification using pSlient-1 vector as template and P1 and P2 as primers. The RNA silencing vector pSilent-1: LqFlbA was obtained by homologous recombination of the two fragments obtained as described above using the recombinant enzyme Exnase II.</p>
Full article ">
14 pages, 1388 KiB  
Review
Diagnosis- and Prognosis-Related Gene Alterations in BCR::ABL1-Negative Myeloproliferative Neoplasms
by Soji Morishita and Norio Komatsu
Int. J. Mol. Sci. 2023, 24(16), 13008; https://doi.org/10.3390/ijms241613008 - 21 Aug 2023
Viewed by 1765
Abstract
BCR::ABL1-negative myeloproliferative neoplasms (MPNs) are a group of hematopoietic malignancies in which somatic mutations are acquired in hematopoietic stem/progenitor cells, resulting in an abnormal increase in blood cells in peripheral blood and fibrosis in bone marrow. Mutations in JAK2, MPL, [...] Read more.
BCR::ABL1-negative myeloproliferative neoplasms (MPNs) are a group of hematopoietic malignancies in which somatic mutations are acquired in hematopoietic stem/progenitor cells, resulting in an abnormal increase in blood cells in peripheral blood and fibrosis in bone marrow. Mutations in JAK2, MPL, and CALR are frequently found in BCR::ABL1-negative MPNs, and detecting typical mutations in these three genes has become essential for the diagnosis of BCR::ABL1-negative MPNs. Furthermore, comprehensive gene mutation and expression analyses performed using massively parallel sequencing have identified gene mutations associated with the prognosis of BCR::ABL1-negative MPNs such as ASXL1, EZH2, IDH1/2, SRSF2, and U2AF1. Furthermore, single-cell analyses have partially elucidated the effect of the order of mutation acquisition on the phenotype of BCR::ABL1-negative MPNs and the mechanism of the pathogenesis of BCR::ABL1-negative MPNs. Recently, specific CREB3L1 overexpression has been identified in megakaryocytes and platelets in BCR::ABL1-negative MPNs, which may be promising for the development of diagnostic applications. In this review, we describe the genetic mutations found in BCR::ABL1-negative MPNs, including the results of analyses conducted by our group. Full article
(This article belongs to the Special Issue Molecular Research on Myeloproliferative Disorders)
Show Figures

Figure 1

Figure 1
<p>Schematical illustration describing the subtypes of myeloproliferative neoplasms (MPNs). Cell types are depicted as light gray squares. MPP: multipotent progenitor; CMP: common myeloid progenitor; GMP: granulocyte-monocyte progenitor; MEP: megakaryocyte–erythrocyte progenitor. Subtypes of MPNs are depicted as white rounded rectangles. Chronic myeloid leukemia (CML) exhibits <span class="html-italic">BCR::ABL1</span> gene (<span class="html-italic">BCR::ABL1</span>(+)). Other subtypes are stratified as <span class="html-italic">BCR::ABL1</span>-negative (−) MPNs. CNL: chronic neutrophilic leukemia; CEL: chronic eosinophilic leukemia; PV: polycythemia vera; ET: essential thrombocythemia; PMF: primary myelofibrosis.</p>
Full article ">Figure 2
<p>(<b>A</b>): Distribution of driver gene mutations for <span class="html-italic">BCR::ABL1</span>-negative MPNs in our Japanese cohort. Triple-negative: TN. (<b>B</b>): Driver gene mutations in <span class="html-italic">BCR::ABL1</span>-negative MPNs. Cell proliferation signal is regulated through the binding of cytokines (erythropoietin: EPO or thrombopoietin: TPO) to the receptors (erythropoietin receptor: EPOR or thrombopoietin receptor: MPL, left panel). However, in the driver gene-mutated <span class="html-italic">BCR::ABL1</span>-negative MPNs, downstream signal cascades constitutively activate owing to the mutant proteins without the binding of cytokines. JAK2 exon 12 mutations activate strong signals, especially for erythrocytosis, whereas JAK2V617F activates trilineage signals (erythrocytosis, leukocytosis, and thrombocytosis). MPLW515L/K and mutant CALR activate MPL signaling and trigger thrombocytosis (right panels). (<b>C</b>): Typical nondriver gene transcripts identified in <span class="html-italic">BCR::ABL1</span>-negative MPNs. Mutations that occur in these genes disrupt the gene regulations and my affect the prognosis of <span class="html-italic">BCR::ABL1</span>-negative MPNs. IDH1/2 generates a-ketoglutaric acids (a-KG) from isocitrate. Mutant IDH1/2 generates 2-hydroxyglutaric acid (2HG) from a-KG, resulting in the suppression of TET2. DNMT3A and TET2 act as DNA methylation and demethylation enzymes by methylating cytosine to 5-methylcytosine (5mC) and oxidizing 5mC to 5-hydroxymethylcytosine (5hmC), respectively. ASXL1 and EZH2 regulate the transcription through the trimethylation of histone 3 lysine 27. SF3B1, SRSF2, and U2AF1 function as splicing factors. TP53 is a well-known guardian gene of carcinogenesis.</p>
Full article ">Figure 3
<p>(<b>A</b>): Scatter plot showing the relationship between <span class="html-italic">JAK2</span>V617F allele burden measured using massively parallel sequencing (MiSeq, <span class="html-italic">x</span>-axis) and those measured using ABC-PCR (<span class="html-italic">y</span>-axis). The correlation coefficient of R<sup>2</sup> was calculated as 0.991; (<b>B</b>): box plot showing the <span class="html-italic">JAK2</span>V617F allele burden among patients with PV (red), ET (green), prefibrotic PMF (blue), and overt PMF (purple) harboring the <span class="html-italic">JAK2</span>V617F mutation (&gt;1.0%). The median/mean <span class="html-italic">JAK2</span>V617F allele burden is 72.3/66.8% in PV, 27.3/30.2% in ET, 46.3/50.2% in prefibrotic PMF, and 43.7/49.3% in overt PMF.</p>
Full article ">Figure 4
<p>Distribution of <span class="html-italic">CALR</span> frameshift mutations analyzed in our data. ET (<b>left</b>, <span class="html-italic">n</span> = 179), prefibrotic PMF (<b>middle</b>, <span class="html-italic">n</span> = 13), and overt PMF (<b>right</b>, <span class="html-italic">n</span> = 31).</p>
Full article ">Figure 5
<p>Violin plot showing the expression levels of <span class="html-italic">CREB3L1</span> measured using reverse transcription quantitative PCR. Dots represent the <span class="html-italic">CREB3L1</span> levels of the individuals, which are expressed as the value relative to the mean expression levels among healthy volunteers. <span class="html-italic">B2M</span> was used as an internal control.</p>
Full article ">
11 pages, 4253 KiB  
Article
Validation of 16S rRNA and Complete rpoB Gene Sequence Analysis for the Identification of Elizabethkingia Species
by Jiun-Nong Lin, Chung-Hsu Lai, Chih-Hui Yang and Yi-Han Huang
Int. J. Mol. Sci. 2023, 24(16), 13007; https://doi.org/10.3390/ijms241613007 - 21 Aug 2023
Cited by 1 | Viewed by 1456
Abstract
Bacteria in the genus Elizabethkingia have emerged as a cause of life-threatening infections in humans. However, accurate species identification of these pathogens relies on molecular techniques. We aimed to evaluate the accuracy of 16S rRNA and complete RNA polymerase β-subunit (rpoB) [...] Read more.
Bacteria in the genus Elizabethkingia have emerged as a cause of life-threatening infections in humans. However, accurate species identification of these pathogens relies on molecular techniques. We aimed to evaluate the accuracy of 16S rRNA and complete RNA polymerase β-subunit (rpoB) gene sequences in identifying Elizabethkingia species. A total of 173 Elizabethkingia strains with whole-genome sequences in GenBank were included. The 16S rRNA gene and rpoB gene sequences from the same Elizabethkingia strains were examined. Of the 41 E. meningoseptica strains, all exhibited >99.5% 16S rRNA similarity to its type strain. Only 83% of the 99 E. anophelis strains shared >99.5% 16S rRNA gene similarity with its type strain. All strains of E. meningoseptica and E. anophelis formed a cluster distinct from the other Elizabethkingia species in the 16S rRNA and rpoB gene phylogenetic trees. The polymorphisms of 16S rRNA gene sequences are not sufficient for constructing a phylogenetic tree to discriminate species in the E. miricola cluster (E. miricola, E. bruuniana, E. occulta, and E. ursingii). The complete rpoB gene phylogenetic tree clearly delineates all strains of Elizabethkingia species. The complete rpoB gene sequencing could be a useful complementary phylogenetic marker for the accurate identification of Elizabethkingia species. Full article
(This article belongs to the Section Molecular Genetics and Genomics)
Show Figures

Figure 1

Figure 1
<p>Nucleotide polymorphisms in the 16S rRNA gene sequences (blue line) and <span class="html-italic">rpoB</span> gene sequences (red line) of 173 <span class="html-italic">Elizabethkingia</span> strains included in this study. The x-axis indicates the positions of nucleotides, and the y-axis indicates the nucleotide diversity (Pi) in windows of 100 nucleotides.</p>
Full article ">Figure 2
<p>Scatter plot of the relationship between in silico DNA–DNA hybridization (iDDH) values and sequence similarities of the 16S rRNA gene (<b>left</b> parts) and sequence similarities of the complete <span class="html-italic">rpoB</span> gene (<b>right</b> parts) in 173 <span class="html-italic">Elizabethkingia</span> strains. (<b>A</b>,<b>B</b>) 99 <span class="html-italic">E. anophelis</span> strains. (<b>C</b>,<b>D</b>) 41 <span class="html-italic">E. meningoseptica</span> strains. (<b>E</b>,<b>F</b>) 16 <span class="html-italic">E. miricola</span> strains, 10 <span class="html-italic">E. bruuniana</span> strains, 4 <span class="html-italic">E. ursingii</span> strains, 2 <span class="html-italic">E. occulta</span> strains, and 1 <span class="html-italic">E. argenteiflava</span> strain.</p>
Full article ">Figure 3
<p>Phylogenetic analysis derived from the 16S rRNA gene sequences (<b>A</b>) and complete <span class="html-italic">rpoB</span> gene sequences (<b>B</b>) in <span class="html-italic">E. miricola</span> cluster strains (<span class="html-italic">E. miricola</span>, <span class="html-italic">E. bruuniana</span>, <span class="html-italic">E. occulta</span>, and <span class="html-italic">E. ursingii</span>) using the maximum-likelihood method based on the Jukes–Cantor model (JC69). The percentage of replicate trees in which the associated taxa clustered together in the bootstrap test of 1000 replicates and branch lengths of the evolutionary distances are shown. The asterisk represents the strain with unexpected positioning in the tree. Type strains are marked in red windows.</p>
Full article ">Figure 4
<p>Phylogenetic analysis derived from the 16S rRNA gene sequences (<b>A</b>) and complete <span class="html-italic">rpoB</span> gene sequences (<b>B</b>) in <span class="html-italic">E. miricola</span> cluster strains (<span class="html-italic">E. miricola</span>, <span class="html-italic">E. bruuniana</span>, <span class="html-italic">E. occulta</span>, and <span class="html-italic">E. ursingii</span>) using the approximate likelihood-ratio test with Bayes branch support based on the Jukes–Cantor model (JC69). The percentages of replicate trees are computed along PhyML on the original data set. The branch support is significant if it is &gt;0.90. The asterisk represents the strain with unexpected positioning in the tree. Type strains are marked in red windows.</p>
Full article ">
36 pages, 1713 KiB  
Review
Decoding Neurodegeneration: A Comprehensive Review of Molecular Mechanisms, Genetic Influences, and Therapeutic Innovations
by Victor Voicu, Calin Petre Tataru, Corneliu Toader, Razvan-Adrian Covache-Busuioc, Luca Andrei Glavan, Bogdan-Gabriel Bratu, Horia Petre Costin, Antonio Daniel Corlatescu and Alexandru Vlad Ciurea
Int. J. Mol. Sci. 2023, 24(16), 13006; https://doi.org/10.3390/ijms241613006 - 21 Aug 2023
Cited by 2 | Viewed by 2771
Abstract
Neurodegenerative disorders often acquire due to genetic predispositions and genomic alterations after exposure to multiple risk factors. The most commonly found pathologies are variations of dementia, such as frontotemporal dementia and Lewy body dementia, as well as rare subtypes of cerebral and cerebellar [...] Read more.
Neurodegenerative disorders often acquire due to genetic predispositions and genomic alterations after exposure to multiple risk factors. The most commonly found pathologies are variations of dementia, such as frontotemporal dementia and Lewy body dementia, as well as rare subtypes of cerebral and cerebellar atrophy-based syndromes. In an emerging era of biomedical advances, molecular–cellular studies offer an essential avenue for a thorough recognition of the underlying mechanisms and their possible implications in the patient’s symptomatology. This comprehensive review is focused on deciphering molecular mechanisms and the implications regarding those pathologies’ clinical advancement and provides an analytical overview of genetic mutations in the case of neurodegenerative disorders. With the help of well-developed modern genetic investigations, these clinically complex disturbances are highly understood nowadays, being an important step in establishing molecularly targeted therapies and implementing those approaches in the physician’s practice. Full article
(This article belongs to the Special Issue The Molecular and Cellular Mechanisms of Neurodegenerative Diseases)
Show Figures

Figure 1

Figure 1
<p>The proposed model depicts various potential molecular mechanisms responsible for the disturbed copper homeostasis observed in hepatocytes expressing Wilson’s disease ATPase mutations. Under normal circumstances, this ATPase normally resides in the trans-Golgi network, but when exposed to high copper levels, it relocates into a vesicular compartment of its cell’s cytoplasm, where it accumulates copper before returning to its trans-Golgi network and eventually excreting copper into its bile.</p>
Full article ">Figure 2
<p>NPC1 disease is a neurodegenerative disorder caused by genetic mutations of the lysosomal cholesterol transporter NPC1. Cholesterol accumulates in these organelles and begins its pathological process, ultimately resulting in greater excitability of neurons affected.</p>
Full article ">Figure 3
<p>This diagram depicts the complex cellular model of Tay–Sachs disease. After alpha subunit undergoes glycosylation into the ER and structural stabilization from calreticulin/calnexin cycle, it can properly fold, forming the beta subunit, and both will be exported to the Golgi. If alpha subunit undergoes improper folding, glycans are removed before proteasomal degradation. A possibility to avoid this issue is Kifunensine, an inhibitor for ER Manosidase I trimming of glycans.</p>
Full article ">
16 pages, 2508 KiB  
Article
Tryptophan Modulation in Cancer-Associated Cachexia Mouse Models
by M. Teresa Agulló-Ortuño, Esther Mancebo, Montserrat Grau, Juan Antonio Núñez Sobrino, Luis Paz-Ares, José A. López-Martín and Marta Flández
Int. J. Mol. Sci. 2023, 24(16), 13005; https://doi.org/10.3390/ijms241613005 - 21 Aug 2023
Cited by 3 | Viewed by 2016
Abstract
Cancer cachexia is a multifactorial syndrome that interferes with treatment and reduces the quality of life and survival of patients. Currently, there is no effective treatment or biomarkers, and pathophysiology is not clear. Our group reported alterations on tryptophan metabolites in cachectic patients, [...] Read more.
Cancer cachexia is a multifactorial syndrome that interferes with treatment and reduces the quality of life and survival of patients. Currently, there is no effective treatment or biomarkers, and pathophysiology is not clear. Our group reported alterations on tryptophan metabolites in cachectic patients, so we aim to investigate the role of tryptophan using two cancer-associated cachexia syngeneic murine models, melanoma B16F10, and pancreatic adenocarcinoma that is KPC-based. Injected mice showed signs of cancer-associated cachexia as reduction in body weight and raised spleen weight, MCP1, and carbonilated proteins in plasma. CRP and Myostatin also increased in B16F10 mice. Skeletal muscle showed a decrease in quadriceps weight and cross-sectional area (especially in B16F10). Higher expression of atrophy genes, mainly Atrogin1, was also observed. Plasmatic tryptophan levels in B16F10 tumor-bearing mice decreased even at early steps of tumorigenesis. In KPC-injected mice, tryptophan fluctuated but were also reduced and in cachectic patients were significantly lower. Treatment with 1-methyl-tryptophan, an inhibitor of tryptophan degradation, in the murine models resulted in the restoration of plasmatic tryptophan levels and an improvement on splenomegaly and carbonilated proteins levels, while changes in plasmatic inflammatory markers were mild. After the treatment, CCR2 expression in monocytes diminished and lymphocytes, Tregs, and CD8+, were activated (seen by increased in CD127 and CD25 expression, respectively). These immune cell changes pointed to an improvement in systemic inflammation. While treatment with 1-MT did not show benefits in terms of muscle wasting and atrophy in our experimental setting, muscle functionality was not affected and central nuclei fibers appeared, being a feature of regeneration. Therefore, tryptophan metabolism pathway is a promising target for inflammation modulation in cancer-associated cachexia. Full article
(This article belongs to the Section Molecular Oncology)
Show Figures

Figure 1

Figure 1
<p>Murine models for the study of cancer-associated cachexia recapitulate human disease. (<b>A</b>) Experimental design for the in vivo experiments. (<b>B</b>) Tumor growth along the experiments. (<b>C</b>) Changes in body weight observed since injection of the tumor cells. (<b>D</b>) Spleen weight at the time of sacrifice referred to total body weight. (<b>E</b>) MCP1, CRP, and Mstn levels measured by ELISA in plasma and shown as fold increase versus non-tumor plasmatic samples. (<b>F</b>) Carbonylated protein levels measured in plasma. Significant differences between groups are indicated by * (<span class="html-italic">p</span> &lt; 0.05), ** (<span class="html-italic">p</span> &lt; 0.005), *** (<span class="html-italic">p</span> &lt; 0.0005) and **** (<span class="html-italic">p</span> &lt; 0.0001).</p>
Full article ">Figure 2
<p>Muscle and inguinal fat alterations during cachexia development in B16F10 and KPC mouse models. (<b>A</b>) Quadriceps weight at the time of sacrifice referred to total body weight. (<b>B</b>) Quadriceps mean cross sectional measured in H&amp;E sections. (<b>C</b>) Quadriceps cross sectional area measured in H&amp;E sections and represented as relative frequency. (<b>D</b>) <span class="html-italic">Atrogin1</span>, <span class="html-italic">Murf1</span>, and <span class="html-italic">Mstn</span> RNA expression normalized by HPRT by qPCR. (<b>E</b>) Inguinal fat weight at the time of sacrifice referred to total body weight. Significant differences between groups are indicated by * (<span class="html-italic">p</span> &lt; 0.05), ** (<span class="html-italic">p</span> &lt; 0.005) and *** (<span class="html-italic">p</span> &lt; 0.0005).</p>
Full article ">Figure 3
<p>Plasma of cachectic cancer patients and tumor-bearing mice showed reduced tryptophan levels. Tryptophan levels measured by ELISA in plasma of cachectic and no cachectic cancer patients (<b>A</b>), B16F10 (<b>B</b>), and KPC (<b>C</b>) murine models during tumor development. Significant differences between groups are indicated by * (<span class="html-italic">p</span> &lt; 0.05), ** (<span class="html-italic">p</span> &lt; 0.005), *** (<span class="html-italic">p</span> &lt; 0.0005), and **** (<span class="html-italic">p</span> &lt; 0.0001).</p>
Full article ">Figure 4
<p>1-MT modifies tryptophan metabolism without clear effect in body weight and tumor growth. Tryptophan levels measured by ELISA in plasma of (<b>A</b>) B16F10 (<b>B</b>) and KPC comparing untreated and 1-MT-treated mice (different symbols represent different time points indicated in y axis). (<b>C</b>) Tumor weight at the time of sacrifice. Significant differences between groups are indicated by * (<span class="html-italic">p</span> &lt; 0.05) and ** (<span class="html-italic">p</span> &lt; 0.005).</p>
Full article ">Figure 5
<p>1-MT ameliorates inflammation signs in tumor-bearing mice. (<b>A</b>) Spleen weight at the time of sacrifice referred to total body weight. MCP1, CRP, and Mstn levels measured by ELISA in plasma (shown as fold increase versus non-tumor plasmatic samples) in (<b>B</b>) B16F10 and (<b>C</b>) KPC mouse models. (<b>D</b>) Plasmatic levels of carbonylated proteins in plasma of the same mice. Significant differences between groups are indicated by * (<span class="html-italic">p</span> &lt; 0.05), ** (<span class="html-italic">p</span> &lt; 0.005), *** (<span class="html-italic">p</span> &lt; 0.0005), and **** (<span class="html-italic">p</span> &lt; 0.0001).</p>
Full article ">Figure 6
<p>Immune population analysis by flow cytometry on peripheral blood cells after 1-MT treatment in B16F10 and KPC models. CCR2 Mean Fluorescence Intensity (MFI) measured by flow cytometry in B16F10 (<b>A</b>) and KPC (<b>B</b>) mice. (<b>C</b>) CD127 MFI in Tregs population (CD3<sup>+</sup>, CD4<sup>+</sup>, Foxp3<sup>+</sup>, and CD25<sup>+</sup>) in B16F10 model. (<b>D</b>) CD25 MFI in CD3<sup>+</sup> CD8<sup>+</sup> cells in KPC mice. Significant differences between groups are indicated by * (<span class="html-italic">p</span> &lt; 0.05), ** (<span class="html-italic">p</span> &lt; 0.005) and n.s. means no significant.</p>
Full article ">Figure 7
<p>Muscle alterations after 1-MT treatment. (<b>A</b>) Quadriceps weight at the time of sacrifice referred to total body weight. Quadriceps cross sectional area measured in H&amp;E sections represented as mean (<b>B</b>) and as relative frequency (<b>C</b>). <span class="html-italic">Atrogin1</span>, <span class="html-italic">Murf1</span>, and <span class="html-italic">Mstn</span> RNA expression normalized by HPRT, detected by qPCR, in B16F10 (<b>D</b>) and KPC (<b>E</b>) mice (represented by fold change compared with non-tumor-bearing mice). (<b>F</b>) Average number of fibers with central nuclei. Significant differences between groups are indicated by * (<span class="html-italic">p</span> &lt; 0.05), ** (<span class="html-italic">p</span> &lt; 0.005) and *** (<span class="html-italic">p</span> &lt; 0.0005).</p>
Full article ">
13 pages, 1291 KiB  
Review
Twenty Years of Anti-Vascular Endothelial Growth Factor Therapeutics in Neovascular Age-Related Macular Degeneration Treatment
by Bo-Hyun Moon, Younghwa Kim and Soo-Young Kim
Int. J. Mol. Sci. 2023, 24(16), 13004; https://doi.org/10.3390/ijms241613004 - 21 Aug 2023
Cited by 10 | Viewed by 10328
Abstract
Neovascular age-related macular degeneration (nAMD) is the primary disastrous retinal disease that leads to blindness in the elderly population. In the early 2000s, nAMD resulted in irreversible vision loss and blindness with no available treatment options. However, there have been breakthrough advances in [...] Read more.
Neovascular age-related macular degeneration (nAMD) is the primary disastrous retinal disease that leads to blindness in the elderly population. In the early 2000s, nAMD resulted in irreversible vision loss and blindness with no available treatment options. However, there have been breakthrough advances in the drug development of anti-angiogenic biological agents over the last two decades. The primary target molecule for treating nAMD is the vascular endothelial growth factor (VEGF), and there are currently several anti-VEGF drugs such as bevacizumab, ranibizumab, and aflibercept, which have made nAMD more manageable than before, thus preventing vision loss. Nevertheless, it should be noted that these anti-VEGF drugs for nAMD treatment are not effective in more than half of the patients, and even those who initially gain visual improvements lose their vision over time, along with potential deterioration in the geography of atrophy. As a result, there have been continuous endeavors to improve anti-VEGF agents through better efficacy, fewer doses, expanded intervals, and additional targets. This review describes past and current anti-VEGF therapeutics used to treat nAMD and outlines future directions to improve the effectiveness and safety of anti-VEGF agents. Full article
(This article belongs to the Special Issue Retinal Degenerative Diseases: 2nd Edition)
Show Figures

Figure 1

Figure 1
<p>Vascular endothelial growth factor (VEGF) and VEGF receptor (VEGFR) interaction. (<b>A</b>) VEGFB and placental growth factor (PGF) bind to VEGFR1. VEGFA binds both VEGFR1 and VEGFR2. VEGFC and VEGFD bind to VEGFR3. VEGFR2 activation shows the strongest tyrosine phosphorylation and intracellular signaling. The binding of VEGFs and soluble VEGFR1 and R2 exerts an inhibitory effect. (<b>B</b>) The homodimerization of VEGFRs is a major format, but VEGFRs create heterodimers and even dimerize with soluble ones.</p>
Full article ">Figure 2
<p>Isoforms of human vascular endothelial growth factor A (VEGFA). (<b>A</b>) VEGFAs are composed of eight exons and subtypes with different lengths such as VEGFA121, VEGFA165, and VEGFA206. All subtypes contain exons 1–5. Alternate splice site selection in exons 6–8 generates multiple isoforms. Exons 6 and 7 encode heparin- and neuropilin-binding domains. Exon 8 can be spliced at a proximal or distal splicing site. Distal splicing generates the VEGFAxxxb form with a different C-terminus (indicated 8b). <sup>t</sup>, truncated form. (<b>B</b>) Exon structure of the VEGFA gene. Size is adopted from UCSC Genome Browser.</p>
Full article ">Figure 3
<p>Illustrative structure of anti-VEGF antibody-derived drugs. Molecular weights, clinical doses, and approximate molar amounts of clinical doses are summarized. Region of anti VEGF is indicated by yellow domains and region of anti-ANG2 is indicated by green. V<sub>H</sub>, variable region of heavy chain; V<sub>L</sub>, variable region of light chain; C<sub>H</sub>1, constant region 1 of heavy chain; C<sub>H</sub>2, constant region 2 of heavy chain; C<sub>H</sub>3, constant region 3 of heavy chain; C<sub>L</sub>, constant region of light chain.</p>
Full article ">
18 pages, 4408 KiB  
Article
SET Domain Group 703 Regulates Planthopper Resistance by Suppressing the Expression of Defense-Related Genes
by Peizheng Wen, Jun He, Qiong Zhang, Hongzhi Qi, Aoran Zhang, Daoming Liu, Quanguang Sun, Yongsheng Wang, Qi Li, Wenhui Wang, Zhanghao Chen, Yunlong Wang, Yuqiang Liu and Jianmin Wan
Int. J. Mol. Sci. 2023, 24(16), 13003; https://doi.org/10.3390/ijms241613003 - 21 Aug 2023
Cited by 2 | Viewed by 1466
Abstract
Plant defense responses against insect pests are intricately regulated by highly complex regulatory networks. Post-translational modifications (PTMs) of histones modulate the expression of genes involved in various biological processes. However, the role of PTMs in conferring insect resistance remains unclear. Through the screening [...] Read more.
Plant defense responses against insect pests are intricately regulated by highly complex regulatory networks. Post-translational modifications (PTMs) of histones modulate the expression of genes involved in various biological processes. However, the role of PTMs in conferring insect resistance remains unclear. Through the screening of a T-DNA insertion activation-tagged mutant collection in rice, we identified the mutant planthopper susceptible 1 (phs1), which exhibits heightened expression of SET domain group 703 (SDG703). This overexpression is associated with increased susceptibility to the small brown planthopper (SBPH), an economically significant insect pest affecting rice crops. SDG703 is constitutively expressed in multiple tissues and shows substantial upregulation in response to SBPH feeding. SDG703 demonstrates the activity of histone H3K9 methyltransferase. Transcriptomic analysis revealed the downregulation of genes involved in effector-triggered immunity (ETI) and pattern-triggered immunity (PTI) in plants overexpressing SDG703. Among the downregulated genes, the overexpression of SDG703 in plants resulted in a higher level of histone H3K9 methylation compared to control plants. Collectively, these findings indicate that SDG703 suppresses the expression of defense-related genes through the promotion of histone methylation, consequently leading to reduced resistance against SBPH. The defense-related genes regulated by histone methylation present valuable targets for developing effective pest management strategies in future studies. Furthermore, our study provides novel insight into the epigenetic regulation involved in plant-insect resistance. Full article
(This article belongs to the Special Issue Recent Advances in Plant Molecular Science in China 2023)
Show Figures

Figure 1

Figure 1
<p>Mutant <span class="html-italic">phs1</span> displays more susceptibility to SBPH than the wild type, Dongjin. (<b>A</b>) Phenotypes of wild type (Dongjin) and mutant <span class="html-italic">phs1</span> post infestation with SBPH. Bar: 5 cm. (<b>B</b>) The seedling mortality rate of wild type and mutant <span class="html-italic">phs1</span> infested by SBPH. Significant differences were determined using the Student’s <span class="html-italic">t</span>-test. ** <span class="html-italic">p</span> &lt; 0.01.</p>
Full article ">Figure 2
<p>Overexpressing <span class="html-italic">SDG703</span> significantly reduces rice resistance to SBPH. (<b>A</b>) RT-qPCR analysis of <span class="html-italic">SDG703</span> in wild type (Dongjin) and three independent <span class="html-italic">SDG703</span> overexpressing transgenic lines, with <span class="html-italic">18s-rRNA</span> as the internal reference gene. (<b>B</b>) Phenotypes of wild type and three <span class="html-italic">SDG703</span> overexpressing transgenic lines (<span class="html-italic">OE703#1</span>, <span class="html-italic">OE703#2</span>, and <span class="html-italic">OE703#3</span>) subjected to SBPH infestation. Bar: 5 cm. (<b>C</b>) The seedling mortality rate of wild type and three independent <span class="html-italic">OE-SDG703</span> transgenic lines. (<b>D</b>) Dynamic changes in SBPH populations on wild type, mutant <span class="html-italic">phs1</span>, and <span class="html-italic">SDG703</span> overexpressing transgenic lines surrounded by SBPH sources. (<b>E</b>) Dynamic changes in SBPH populations on wild type, mutant <span class="html-italic">phs1</span>, and <span class="html-italic">OE-SDG703</span> transgenic lines initially infested with 10 SBPH. Data are shown as mean ± SEM (n ≥ 3). * <span class="html-italic">p</span> &lt; 0.05, ** <span class="html-italic">p</span> &lt; 0.01 using the Student’s <span class="html-italic">t</span>-test in (<b>B</b>–<b>D</b>).</p>
Full article ">Figure 3
<p>Expression pattern analysis of <span class="html-italic">SDG703</span>. (<b>A</b>) Transcriptional analysis of <span class="html-italic">SDG703</span> in response to SBPH infestation. <span class="html-italic">18s-rRNA</span> was used as the internal reference gene. The asterisks indicate significant differences using the Student’s <span class="html-italic">t</span>-test. * <span class="html-italic">p</span> &lt; 0.05 (n ≥ 3). (<b>B</b>) Tissue expression of <span class="html-italic">SDG703</span> in seedling roots, stem, sheath, and leaves. <span class="html-italic">18s-rRNA</span> was used as the internal reference gene. (<b>C</b>) Expression pattern of the reporter <span class="html-italic">β-GLUCURONIDASE</span> (<span class="html-italic">GUS</span>) gene driven by the SDG703 promoter (<span class="html-italic">SDG703pro::GUS</span>) in rice seedlings. GUS activity was detected in the stem, sheath, roots, and leaves. Bar: 1 cm.</p>
Full article ">Figure 4
<p>Expression pattern analysis of <span class="html-italic">SDG703</span>. (<b>A</b>) Subcellular localization of SDG703 in rice protoplasts and <span class="html-italic">Nicotiana benthamiana</span> leaf epidermal cells. D53-mCherry was used as the nuclear marker. Bar: 10 µm. (<b>B</b>) Western blot analysis of H3K9 and H3K27 methylation in <span class="html-italic">OE-Flag-SDG703</span>. The fold change (F-change) measures the ratio of signal intensity of <span class="html-italic">OE-Flag-SDG703</span> with the wild type (set as 1) and is shown as mean ± SE from three replicates, after normalization using H3. The asterisks indicate statistically significant F-changes using the Student’s <span class="html-italic">t</span>-test, <span class="html-italic">** p &lt;</span> 0.01. (<b>C</b>) Western blot analysis of H3K9 and H3K27 methylation in <span class="html-italic">Nicotiana benthamiana</span> transient expression. The fold change (F-change) measures the ratio of signal intensity of <span class="html-italic">Flag-SDG703</span> with Mock (set as 1) and is shown as mean ± SE from three replicates, after normalization using H3. The asterisks indicate statistically significant F-changes using the Student’s <span class="html-italic">t</span>-test, <span class="html-italic">** p &lt;</span> 0.01.</p>
Full article ">Figure 5
<p><span class="html-italic">SDG703</span> is required for proper expression of PRR and NLR genes in rice. (<b>A</b>) Venn diagram showing overlap of the upregulated genes in DJ-B vs. DJ-N and the downregulated genes in <span class="html-italic">OE703</span>-N vs. DJ-N. DJ-N: Dongjin without SBPH infestation. DJ-B: Dongjin with SBPH infestation. <span class="html-italic">OE703</span>-N: <span class="html-italic">OE-SDG703</span> without SBPH infestation. <span class="html-italic">OE703</span>-B: <span class="html-italic">OE703</span> with SBPH infestation. (<b>B</b>) Venn diagram showing overlap of the upregulated genes in DJ-B vs. DJ-N and the downregulated genes in <span class="html-italic">OE703</span>-B vs. DJ-B. (<b>C</b>) Venn diagram showing overlap of the upregulated genes in DJ-B vs. DJ-N, the downregulated genes in <span class="html-italic">OE703</span>-N vs. DJ-N, and the downregulated genes in <span class="html-italic">OE703</span>-B vs. DJ-B. (<b>D</b>) Heatmaps showing the genes upregulated by SBPH feeding in the wild type but downregulated in <span class="html-italic">OE-SDG703</span>. Each horizontal bar represents a single gene. Blue indicates a relatively low level of transcription, while red indicates a relatively high level of transcription. (<b>E</b>) Expression analysis of PRR and NLR genes in wild type and <span class="html-italic">OE-SDG703</span> under normal conditions by RT-qPCR. Values are the mean ± SD of three individual biological replicates, normalized to the internal control <span class="html-italic">18s-rRNA</span>. Significant differences were determined using the Student’s <span class="html-italic">t</span>-test. ** <span class="html-italic">p</span> &lt; 0.01.</p>
Full article ">Figure 6
<p>ChIP-qPCR for H3K9me2 modification of <span class="html-italic">NLRs</span> and <span class="html-italic">PRRs</span> downregulated by <span class="html-italic">SDG703</span>. The levels of H3K9me2 on <span class="html-italic">UBQ10</span> were used as the negative control. Data represent mean ± SD (n = 3). The asterisks represent statistically significant differences using the Student’s <span class="html-italic">t</span>-test, <span class="html-italic">* p &lt;</span> 0.05, <span class="html-italic">** p &lt;</span> 0.01.</p>
Full article ">Figure 7
<p>Work mode of SDG703 suppressing SBPH resistance in rice. SBPH infestation upregulates the transcriptional level of <span class="html-italic">SDG703</span>. SDG703 represses the transcriptional level of <span class="html-italic">NLRs</span> and <span class="html-italic">PRRs</span> by increasing H3K9me2 levels, resulting in the reduction of rice resistance against SBPH. Created with BioRender.com.</p>
Full article ">
28 pages, 14704 KiB  
Review
Targeting SARS-CoV-2 Non-Structural Proteins
by Donald Tam, Ana C. Lorenzo-Leal, Luis Ricardo Hernández and Horacio Bach
Int. J. Mol. Sci. 2023, 24(16), 13002; https://doi.org/10.3390/ijms241613002 - 20 Aug 2023
Cited by 9 | Viewed by 2542
Abstract
Severe acute respiratory syndrome coronavirus 2 (SARS-CoV-2) is an enveloped respiratory β coronavirus that causes coronavirus disease (COVID-19), leading to a deadly pandemic that has claimed millions of lives worldwide. Like other coronaviruses, the SARS-CoV-2 genome also codes for non-structural proteins (NSPs). These [...] Read more.
Severe acute respiratory syndrome coronavirus 2 (SARS-CoV-2) is an enveloped respiratory β coronavirus that causes coronavirus disease (COVID-19), leading to a deadly pandemic that has claimed millions of lives worldwide. Like other coronaviruses, the SARS-CoV-2 genome also codes for non-structural proteins (NSPs). These NSPs are found within open reading frame 1a (ORF1a) and open reading frame 1ab (ORF1ab) of the SARS-CoV-2 genome and encode NSP1 to NSP11 and NSP12 to NSP16, respectively. This study aimed to collect the available literature regarding NSP inhibitors. In addition, we searched the natural product database looking for similar structures. The results showed that similar structures could be tested as potential inhibitors of the NSPs. Full article
(This article belongs to the Collection Feature Papers in “Molecular Biology”)
Show Figures

Figure 1

Figure 1
<p>SARS-CoV-2 genome, non-structural proteins, and accessory proteins. S, spike protein; M, membrane protein; E, envelope protein; N, nucleocapsid protein. Created with BioRender.com and adapted from [<a href="#B6-ijms-24-13002" class="html-bibr">6</a>].</p>
Full article ">
23 pages, 1177 KiB  
Review
Recent Advances in Miscanthus Macromolecule Conversion: A Brief Overview
by Galina F. Mironova, Vera V. Budaeva, Ekaterina A. Skiba, Yulia A. Gismatulina, Ekaterina I. Kashcheyeva and Gennady V. Sakovich
Int. J. Mol. Sci. 2023, 24(16), 13001; https://doi.org/10.3390/ijms241613001 - 20 Aug 2023
Cited by 3 | Viewed by 1927
Abstract
Miscanthus is a valuable renewable feedstock and has a significant potential for the manufacture of diverse biotechnology products based on macromolecules such as cellulose, hemicelluloses and lignin. Herein, we overviewed the state-of-the art of research on the conversion of miscanthus polymers into biotechnology [...] Read more.
Miscanthus is a valuable renewable feedstock and has a significant potential for the manufacture of diverse biotechnology products based on macromolecules such as cellulose, hemicelluloses and lignin. Herein, we overviewed the state-of-the art of research on the conversion of miscanthus polymers into biotechnology products comprising low-molecular compounds and macromolecules: bioethanol, biogas, bacterial cellulose, enzymes (cellulases, laccases), lactic acid, lipids, fumaric acid and polyhydroxyalkanoates. The present review aims to assess the potential of converting miscanthus polymers in order to develop sustainable technologies. Full article
(This article belongs to the Collection State-of-the-Art Macromolecules in Russia)
Show Figures

Graphical abstract

Graphical abstract
Full article ">Figure 1
<p>Effect of pretreatment on biomasses (reproduced with permission from [<a href="#B73-ijms-24-13001" class="html-bibr">73</a>], MDPI, 2023).</p>
Full article ">Figure 2
<p>A simplified formula for production of biotechnology products from miscanthus.</p>
Full article ">
13 pages, 2104 KiB  
Article
Phosphate Additives for Aging Inhibition of Impregnated Activated Carbon against Hazardous Gases
by Ido Nir, Vladislav Shepelev, Alexander Pevzner, Daniele Marciano, Lilach Rosh, Tal Amitay-Rosen and Hadar Rotter
Int. J. Mol. Sci. 2023, 24(16), 13000; https://doi.org/10.3390/ijms241613000 - 20 Aug 2023
Cited by 1 | Viewed by 1218
Abstract
Impregnated activated carbons (IACs) used in air filtration gradually lose their efficacy for the chemisorption of noxious gases when exposed to humidity due to impregnated metal deactivation. In order to stabilize IACs against aging, and to prolong the filters’ shelf life, inorganic phosphate [...] Read more.
Impregnated activated carbons (IACs) used in air filtration gradually lose their efficacy for the chemisorption of noxious gases when exposed to humidity due to impregnated metal deactivation. In order to stabilize IACs against aging, and to prolong the filters’ shelf life, inorganic phosphate compounds (phosphoric acid and its three salts, NaHPO4, Na2HPO4, and Na3PO4) were used as anti-aging additives for two different chromium-free IACs impregnated with copper, zinc, molybdenum, and triethylenediamine (TEDA). Phosphoric acid, monosodium, and disodium phosphate were found to be very efficient in inhibiting the aging of IACs over long periods against cyanogen chloride (the test agent) chemisorption, with the latter being the most efficient. However, the efficiency of phosphate as an anti-aging additive was not well correlated with its ability to inhibit the migration of metal impregnants, especially copper, from the interior to the external surface of carbon granules. Unlike organic additives, the inorganic phosphate additives did not decrease the surface area of the IAC or its physical adsorption capacity for toluene. Using a phosphate additive in IAC used in collective protection and personal filters can improve the safety of the user and the environment and dramatically reduce the need to replace these filters after exposure to humid environments. This has safety, economic, logistical, and environmental advantages. Full article
Show Figures

Graphical abstract

Graphical abstract
Full article ">Figure 1
<p>Effect of aging on commercial ASZMT and LIAC protection values against CK.</p>
Full article ">Figure 2
<p>Effect of phosphate additive (NaH<sub>2</sub>PO<sub>4</sub>·H<sub>2</sub>O) on CK protection values of aged impregnated activated carbon; (<b>A</b>) ASZMT, (<b>B</b>) LIAC.</p>
Full article ">Figure 3
<p>Effect of phosphate additive (NaH<sub>2</sub>PO<sub>4</sub>·H<sub>2</sub>O) on CK protection values of dried, aged, impregnated activated carbon; (<b>A</b>) ASZMT, (<b>B</b>) LIAC.</p>
Full article ">Figure 4
<p>Effect of phosphate additive (NaH<sub>2</sub>PO<sub>4</sub>·H<sub>2</sub>O) concentration on the protection values of new and aged, humidified, impregnated activated carbons; (<b>A</b>) ASZMT, (<b>B</b>) LIAC.</p>
Full article ">Figure 5
<p>Effect of phosphoric acid concentration on new and aged, humidified LIAC protection values.</p>
Full article ">Figure 6
<p>Effect of phosphate dibasic dihydrate (Na<sub>2</sub>HPO<sub>4</sub>·2H<sub>2</sub>O) on the protection values of new and aged, humidified LIAC.</p>
Full article ">Figure 7
<p>N<sub>2</sub> adsorption-desorption isotherms of IACs.</p>
Full article ">
20 pages, 4517 KiB  
Article
The Role of Hydrogen Incorporation into Amorphous Carbon Films in the Change of the Secondary Electron Yield
by Nenad Bundaleski, Carolina F. Adame, Eduardo Alves, Nuno P. Barradas, Maria F. Cerqueira, Jonas Deuermeier, Yorick Delaup, Ana M. Ferraria, Isabel M. M. Ferreira, Holger Neupert, Marcel Himmerlich, Ana Maria M. B. do Rego, Martino Rimoldi, Orlando M. N. D. Teodoro, Mikhail Vasilevskiy and Pedro Costa Pinto
Int. J. Mol. Sci. 2023, 24(16), 12999; https://doi.org/10.3390/ijms241612999 - 20 Aug 2023
Cited by 1 | Viewed by 1386
Abstract
Over the last few years, there has been increasing interest in the use of amorphous carbon thin films with low secondary electron yield (SEY) to mitigate electron multipacting in particle accelerators and RF devices. Previous works found that the SEY increases with the [...] Read more.
Over the last few years, there has been increasing interest in the use of amorphous carbon thin films with low secondary electron yield (SEY) to mitigate electron multipacting in particle accelerators and RF devices. Previous works found that the SEY increases with the amount of incorporated hydrogen and correlates with the Tauc gap. In this work, we analyse films produced by magnetron sputtering with different contents of hydrogen and deuterium incorporated via the target poisoning and sputtering of CxDy molecules. XPS was implemented to estimate the phase composition of the films. The maximal SEY was found to decrease linearly with the fraction of the graphitic phase in the films. These results are supported by Raman scattering and UPS measurements. The graphitic phase decreases almost linearly for hydrogen and deuterium concentrations between 12% and 46% (at.), but abruptly decreases when the concentration reaches 53%. This vanishing of the graphitic phase is accompanied by a strong increase of SEY and the Tauc gap. These results suggest that the SEY is not dictated directly by the concentration of H/D, but by the fraction of the graphitic phase in the film. The results are supported by an original model used to calculate the SEY of films consisting of a mixture of graphitic and polymeric phases. Full article
(This article belongs to the Special Issue Carbon–Multidisciplinary Investigations and Innovative Solutions)
Show Figures

Figure 1

Figure 1
<p>High resolution spectra of the C 1s state of (<b>a</b>) freshly cleaved HOPG; (<b>b</b>) reference a-C sample; (<b>c</b>) sample 0.2D; (<b>d</b>) sample 0.5D; (<b>e</b>) sample 1D; and (<b>f</b>) sample 10D, including the peaks obtained through data fitting, as described in the text.</p>
Full article ">Figure 2
<p>Valence bands electron spectra excited by He I radiation of HOPG and a-C coatings with different D content. The data are normalised at binding energy of 2 eV.</p>
Full article ">Figure 3
<p>(<b>a</b>) Raman spectra of the reference sample, as well as of the 0.2D, 0.5D and 1D films deposited on Si substrates measured using a 0.7 W laser beam of 532 nm wavelength; (<b>b</b>) Fitting illustration on the example of the sample 1D; (<b>c</b>) intensity ratio of the D and G bands <span class="html-italic">I<sub>D</sub></span>/<span class="html-italic">I<sub>G</sub></span> and position of the G band maximum <span class="html-italic">σ<sub>D</sub></span> vs. the relative H + D film content.</p>
Full article ">Figure 4
<p>Dependence of the Tauc gap and the SEYmax on the graphitic content in a-C films. The dashed blue line represents the linear dependence of the Tauc gap as reported by Robertson [<a href="#B37-ijms-24-12999" class="html-bibr">37</a>]. The dashed red line is the prediction of the modified semi-empirical model for the SEY developed in this work.</p>
Full article ">Figure A1
<p>Vibrational HREELS spectrum of the sample 1D. The peaks obtained by fitting the C-H and C-D stretching modes are also included.</p>
Full article ">Figure A2
<p>Determination of the parameter n in the case of the (<b>a</b>) the reference sample (without D) and (<b>b</b>) the 10D sample, representing dominantly graphitic and polymeric samples, respectively.</p>
Full article ">Figure A3
<p>Comparison of the experimental and calculated SEY in the case of the (<b>a</b>) reference and (<b>b</b>) 10D sample.</p>
Full article ">Figure A4
<p>Illustration of different configurations <span class="html-italic">ck</span> (<span class="html-italic">k</span> = 1, 2…), each containing the same relative amounts of graphitic (grey) and polymeric (brown) regions, which will be characterised with very different SEY curves.</p>
Full article ">
19 pages, 1609 KiB  
Article
Sialic-Acid-Related Enzymes of B Cells and Monocytes as Novel Markers to Discriminate Improvement Categories and to Fulfill Two Remission Definitions in Rheumatoid Arthritis
by Lieh-Bang Liou, Ping-Han Tsai, Yao-Fan Fang, Yen-Fu Chen, Chih-Chieh Chen and Jenn-Haung Lai
Int. J. Mol. Sci. 2023, 24(16), 12998; https://doi.org/10.3390/ijms241612998 - 20 Aug 2023
Cited by 1 | Viewed by 1325
Abstract
The enzymes α-2,6-sialyltransferase 1 (ST6Gal1), neuraminidase 1 (Neu1), α-2,3-sialyltransferase 1 (ST3Gal1), and neuraminidase 3 (Neu3) are known to affect immune cell function. However, it is not known whether the levels of these enzymes relate to remission definitions or differentiate American College of Rheumatology [...] Read more.
The enzymes α-2,6-sialyltransferase 1 (ST6Gal1), neuraminidase 1 (Neu1), α-2,3-sialyltransferase 1 (ST3Gal1), and neuraminidase 3 (Neu3) are known to affect immune cell function. However, it is not known whether the levels of these enzymes relate to remission definitions or differentiate American College of Rheumatology (ACR), European League Against Rheumatism (EULAR), and Simplified Disease Activity Index (SDAI) responses in patients with rheumatoid arthritis (RA). We measured the ST6Gal1, Neu1, ST3Gal1, and Neu3 levels of B cells and monocytes in RA patients and correlated the cells’ enzyme levels/ratios with the improvement in the ACR, EULAR and SDAI responses and with the two remission definitions. The difference in the B-cell Neu1 levels differed between the ACR 70% improvement and non-improvement groups (p = 0.043), between the EULAR good major response (improvement) and non-good response groups (p = 0.014), and also between the SDAI 50% or 70% improvement and non-improvement groups (p = 0.001 and 0.018, respectively). The same held true when the RA patients were classified by positive rheumatoid factor or the use of biologics. The B-cell Neu1 levels significantly indicated 2005 modified American Rheumatism Association and 2011 ACR/EULAR remission definitions (area under the curve (AUC) = 0.674 with p = 0.001, and AUC = 0.682 with p < 0.001, respectively) in contrast to the CRP and ESR (all AUCs < 0.420). We suggest that B-cell Neu1 is superior for discriminating ACR, EULAR, and SDAI improvement and is good for predicting two kinds of remission definitions. Full article
Show Figures

Figure 1

Figure 1
<p>Comparisons of the difference of monocyte and B-cell enzyme levels/ratios between various ACR improvements and their non-improvements. (<b>A</b>) The B-cell Neu1 difference (M0 − M3) fulfilled the ACR 70% improvement criteria (<span class="html-italic">n</span> = 23), compared with those not fulfilled (<span class="html-italic">n</span> = 67), <span class="html-italic">p</span> = 0.043. (<b>B</b>) The monocyte Neu3 difference (M0 − M12) fulfilled the ACR 20% improvement criteria (<span class="html-italic">n</span> = 65), compared with those not fulfilled (<span class="html-italic">n</span> = 6), <span class="html-italic">p</span> = 0.037. (<b>C</b>) The B-cell ST6 difference (M0 − M12) fulfilled the ACR 20% improvement criteria (<span class="html-italic">n</span> = 62), compared with those not fulfilled (<span class="html-italic">n</span> = 5), <span class="html-italic">p</span> = 0.050. (<b>D</b>) The monocyte ST3/Neu3 ratio difference (M0 − M12) fulfilled the ACR 70% improvement criteria (<span class="html-italic">n</span> = 26), compared with those not fulfilled (<span class="html-italic">n</span> = 38), <span class="html-italic">p</span> = 0.042. All comparisons were analysed using the Mann–Whitney U test.</p>
Full article ">Figure 2
<p>Comparisons of the difference of monocyte and B-cell enzyme levels/ratios between various ACR improvements and their non-improvements in RA patients with positive rheumatoid factor. (<b>A</b>) The B-cell Neu1 difference (M0 − M3) fulfilled the ACR 70% improvement criteria (<span class="html-italic">n</span> = 21), compared with those not fulfilled (<span class="html-italic">n</span> = 53), <span class="html-italic">p</span> = 0.041. (<b>B</b>) The B-cell ST6 difference (M0 − M3) fulfilled the ACR 70% improvement criteria (<span class="html-italic">n</span> = 21), compared with those not fulfilled (<span class="html-italic">n</span> = 50), <span class="html-italic">p</span> = 0.022; that of the B-cell ST6 difference yielded <span class="html-italic">p</span> = 0.024 (ACR 50%, M0 − M12). (<b>C</b>) The monocyte Neu3 difference (M0 − M12) fulfilled the ACR 20% improvement criteria (<span class="html-italic">n</span> = 67), compared with those not fulfilled (<span class="html-italic">n</span> = 8), <span class="html-italic">p</span> = 0.029; that of the monocyte ST6/Neu1 ratio difference rendered <span class="html-italic">p</span> = 0.007 (ACR 70%, M0 − M12); that of the monocyte ST6 difference yielded <span class="html-italic">p</span> = 0.019 (ACR 50%, M0 − M15). (<b>D</b>) The B-cell ST3 difference (M0 − M3) fulfilled the ACR 70% improvement criteria (<span class="html-italic">n</span> = 21), compared with those not fulfilled (<span class="html-italic">n</span> = 49), <span class="html-italic">p</span> = 0.013; that of the B-cell ST3 difference provided <span class="html-italic">p</span> = 0.046 (ACR 50%, M0 − M12); that of the B-cell Neu 3 difference yielded <span class="html-italic">p</span> = 0.015 (ACR 70%, M0 − M3). All comparisons were analysed using the Mann–Whitney U test.</p>
Full article ">Figure 3
<p>Comparisons of the difference of monocyte and B-cell enzyme levels/ratios between various ACR improvements and their non-improvements in RA patients with positive anti-CCP antibodies. (<b>A</b>) The B-cell ST6 difference (M0 − M12) fulfilled the ACR 70% improvement (<span class="html-italic">n</span> = 75) criteria, compared with those not fulfilled (<span class="html-italic">n</span> = 6), <span class="html-italic">p</span> = 0.030. (<b>B</b>) The monocyte ST6 difference gave <span class="html-italic">p</span> = 0.039 for ACR 70% improvement (<span class="html-italic">n</span> = 50) vs. non-improvement (<span class="html-italic">n</span> = 31) (M0 − M15). (<b>C</b>) The monocyte ST3/Neu3 ratio difference rendered <span class="html-italic">p</span> = 0.036 for ACR 70% improvement (<span class="html-italic">n</span> = 33) vs. non-improvement (<span class="html-italic">n</span> = 41) (M0 − M12). All comparisons were analysed using the Mann–Whitney U test.</p>
Full article ">Figure 4
<p>Comparisons of the difference of monocyte and B-cell enzyme levels/ratios between various ACR improvements and their non-improvements in RA patients with use of biologics. (<b>A</b>) The B-cell Neu1 difference (M0 − M3) fulfilled the ACR 50% improvement criteria (<span class="html-italic">n</span> = 26), compared with those not fulfilled (<span class="html-italic">n</span> = 16), <span class="html-italic">p</span> = 0.029. (<b>B</b>) The B-cell ST6/Neu1 ratio difference (M0 − M3) fulfilled the ACR 50% improvement (<span class="html-italic">n</span> = 21), compared with those not fulfilled (<span class="html-italic">n</span> = 15) gave <span class="html-italic">p</span> = 0.037. (<b>C</b>) The monocyte ST6/Neu1 ratio difference (M0 − M3) fulfilled the ACR 20% improvement (<span class="html-italic">n</span> = 31), compared with those not fulfilled (<span class="html-italic">n</span> = 6), <span class="html-italic">p</span> = 0.009. (<b>D</b>) The monocyte ST3/Neu3 ratio difference (M0 − M12) fulfilled the ACR 70% improvement (<span class="html-italic">n</span> = 10), compared with those not fulfilled (<span class="html-italic">n</span> = 27), <span class="html-italic">p</span> = 0.028. All comparisons were analysed using the Mann–Whitney U test.</p>
Full article ">Figure 5
<p>Comparison of the B-cell Neu1 level and DAS28 scores between baseline and later months. The B-cell Neu1 level was significantly lower in (<b>A</b>) month 12 (<span class="html-italic">n</span> = 72) and (<b>B</b>) month 15 (<span class="html-italic">n</span> = 48) than month 0 (<span class="html-italic">n</span> = 100) (<span class="html-italic">p</span> = 0.009 and &lt;0.001, respectively). DAS28-ESR scores were significantly lower in (<b>C</b>) month 12 and (<b>D</b>) month 15 than month 0 (<span class="html-italic">p</span> &lt; 0.001 and &lt;0.001, respectively). DAS28-MCP-1 scores were significantly lower in (<b>E</b>) month 12 and (<b>F</b>) month 15 than month 0 (<span class="html-italic">p</span> &lt; 0.001 and &lt;0.001, respectively). All comparisons were analysed using the Mann–Whitney U test.</p>
Full article ">
11 pages, 1008 KiB  
Review
Drug Repositioning for Refractory Benign Tumors of the Central Nervous System
by Ryota Tamura
Int. J. Mol. Sci. 2023, 24(16), 12997; https://doi.org/10.3390/ijms241612997 - 20 Aug 2023
Cited by 1 | Viewed by 1738
Abstract
Drug repositioning (DR) is the process of identifying novel therapeutic potentials for already-approved drugs and discovering new therapies for untreated diseases. DR can play an important role in optimizing the pre-clinical process of developing novel drugs by saving time and cost compared with [...] Read more.
Drug repositioning (DR) is the process of identifying novel therapeutic potentials for already-approved drugs and discovering new therapies for untreated diseases. DR can play an important role in optimizing the pre-clinical process of developing novel drugs by saving time and cost compared with the process of de novo drug discovery. Although the number of publications related to DR has rapidly increased, most therapeutic approaches were reported for malignant tumors. Surgical resection represents the definitive treatment for benign tumors of the central nervous system (BTCNS). However, treatment options remain limited for surgery-, chemotherapy- and radiation-refractory BTCNS, as well as malignant tumors. Meningioma, pituitary neuroendocrine tumor (PitNET), and schwannoma are the most common BTCNS. The treatment strategy using DR may be applied for refractory BTCNS, such as Grade 2 meningiomas, neurofibromatosis type 2-related schwannomatosis, and PitNETs with cavernous sinus invasion. In the setting of BTCNS, stable disease can provide significant benefit to the patient. DR may provide a longer duration of survival without disease progression for patients with refractory BTCNS. This article reviews the utility of DR for refractory BTCNS. Full article
Show Figures

Figure 1

Figure 1
<p>Drug discovery process through drug repositioning.</p>
Full article ">Figure 2
<p>Drug repositioning for the refractory benign tumors of the central nervous system.</p>
Full article ">
15 pages, 2071 KiB  
Article
Modulation of Voltage-Gating and Hysteresis of Lysenin Channels by Cu2+ Ions
by Andrew Bogard, Pangaea W. Finn, Aviana R. Smith, Ilinca M. Flacau, Rose Whiting and Daniel Fologea
Int. J. Mol. Sci. 2023, 24(16), 12996; https://doi.org/10.3390/ijms241612996 - 20 Aug 2023
Cited by 1 | Viewed by 1050
Abstract
The intricate voltage regulation presented by lysenin channels reconstituted in artificial lipid membranes leads to a strong hysteresis in conductance, bistability, and memory. Prior investigations on lysenin channels indicate that the hysteresis is modulated by multivalent cations which are also capable of eliciting [...] Read more.
The intricate voltage regulation presented by lysenin channels reconstituted in artificial lipid membranes leads to a strong hysteresis in conductance, bistability, and memory. Prior investigations on lysenin channels indicate that the hysteresis is modulated by multivalent cations which are also capable of eliciting single-step conformational changes and transitions to stable closed or sub-conducting states. However, the influence on voltage regulation of Cu2+ ions, capable of completely closing the lysenin channels in a two-step process, was not sufficiently addressed. In this respect, we employed electrophysiology approaches to investigate the response of lysenin channels to variable voltage stimuli in the presence of small concentrations of Cu2+ ions. Our experimental results showed that the hysteretic behavior, recorded in response to variable voltage ramps, is accentuated in the presence of Cu2+ ions. Using simultaneous AC/DC stimulation, we were able to determine that Cu2+ prevents the reopening of channels previously closed by depolarizing potentials and the channels remain in the closed state even in the absence of a transmembrane voltage. In addition, we showed that Cu2+ addition reinstates the voltage gating and hysteretic behavior of lysenin channels reconstituted in neutral lipid membranes in which lysenin channels lose their voltage-regulating properties. In the presence of Cu2+ ions, lysenin not only regained the voltage gating but also behaved like a long-term molecular memory controlled by electrical potentials. Full article
(This article belongs to the Special Issue Membrane Channels: Mechanistic Insights)
Show Figures

Figure 1

Figure 1
<p>Lysenin inserts uniform channels in artificial lipid membranes. The insertion of individual lysenin channels in a planar bilayer lipid membrane was monitored from the stepwise variation of the ionic currents at −60 mV transmembrane voltage. Each inserted channel adjusted the ionic current by ~20 pA.</p>
Full article ">Figure 2
<p>Cu<sup>2+</sup> ions adjust the voltage gating and hysteresis in the positive voltage range. (<b>a</b>) The I-V plots recorded for forward and reverse voltage ramps before and after Cu<sup>2+</sup> addition indicate major adjustments in channel closing and reopening. Cu<sup>2+</sup> addition reduces the voltage required to initiate gating during ascending (Fwd) voltage ramps and elicit resistance to reopening during descending voltage ramps (Rev). (<b>b</b>) The negligible ionic currents recorded for a consecutive voltage ramp applied to Cu<sup>2+</sup> -exposed channels indicates the persistency of the closed state of the channels. The panels show experimental data from single traces, with the symbols added to facilitate identification.</p>
Full article ">Figure 3
<p>Cu<sup>2+</sup> ions modulate the voltage gating and hysteresis of lysenin channels for an extended voltage range. In the absence of Cu<sup>2+</sup> ions, the hysteresis in conductance in response to ascending and descending voltage ramps is observed for I-V (<b>a</b>) and open probability (P<sub>open</sub>) (<b>b</b>) plots. The changes in the macroscopic currents, P<sub>open</sub>, and midway voltage of activation for channels in a previously open state indicate a history-dependent response to applied voltages. Cu<sup>2+</sup> addition influences the I-V (<b>c</b>) and P<sub>open</sub> (<b>d</b>) plots recorded in response to the oscillatory voltage stimuli. The addition of Cu<sup>2+</sup> ions induces a strong leftward shift in gating during ascending voltage ramps and the previously closed channels resist reopening. The traces represent experimental data, from single traces, with the symbols added to facilitate identification.</p>
Full article ">Figure 4
<p>Determination of lysenin channels’ macroscopic conductance from combined AC/DC stimulation. The application of 0 mV and +60 mV DC voltages is indicated in the figure. The fully open state at 0 mV at the beginning of the recording is indicated by the large value of the AC current amplitude. The decreasing amplitude observed after the application of +60 mV indicates channel closure. The re-application of +60 mV reinstates the fully conducting state, which is indicative of channel reopening.</p>
Full article ">Figure 5
<p>Cu<sup>2+</sup> ions adjust the response of lysenin channels to voltages in a history-dependent manner. A large macroscopic conductance at 0 mV for previously open channels is indicated by the large amplitude of the AC current. The channels close rapidly at +60 mV but removal of the DC bias voltage does not lead to reopening. The channels reopen upon application of a negative bias voltage step (−60 mV); subsequent removal of the DC stimulus (i.e., reapplication of 0 mV) reinstates the current prior to channel closure, demonstrating a bistable system.</p>
Full article ">Figure 6
<p>The power spectrum recorded for all the voltage and conformation conditions indicate the presence of the 10 Hz AC signal for channels open at 0 mV (squares), closed at +60 mV (circles), closed at 0 mV (up triangles), reopen at −60 mV (down triangles), and again at 0 mV after reopening by the negative step voltage (diamonds). The symbols were added to traces constructed from all the experimental data to facilitate identification.</p>
Full article ">Figure 7
<p>Cu<sup>2+</sup> reinstates the voltage gating and hysteresis features of lysenin channels in neutral membranes. The linear I-V plot recorded for lysenin channels reconstituted in neutral membranes ((<b>a</b>), open squares) indicates the absence of voltage-induced gating. The voltage-induced gating feature is reinstated upon Cu<sup>2+</sup> addition ((<b>a</b>), open up triangles). The I-V plot recorded after Cu<sup>2+</sup> addition (<b>b</b>) for ascending (full squares) and descending (full down triangles) voltage ramps indicates the hysteresis in conductance and history-dependent response to applied voltages. The plots represent experimental data from single traces, with the symbols added to facilitate identification.</p>
Full article ">Figure 8
<p>The experimental setup for electrophysiology measurements. Lysenin channels are reconstituted in a bilayer lipid membrane (BLM) bathed by electrolyte solutions. The electrical connections to the Axopatch 200B electrophysiology amplifier are ensured by agarose salt bridges and Ag/AgCl electrodes wired to the headstage. The diagram is not to scale.</p>
Full article ">Figure 9
<p>Experimental setup for investigating the status of the channels at any applied DC voltage. A combined AC/DC signal is applied from the electrophysiology amplifier to the membrane depicted as a capacitor C<sub>m</sub> in parallel to a variable resistor R (the conducting pathway created by inserted lysenin channels).</p>
Full article ">
Previous Issue
Back to TopTop