[go: up one dir, main page]

Next Issue
Volume 19, July
Previous Issue
Volume 19, May
 
 
ijms-logo

Journal Browser

Journal Browser

Int. J. Mol. Sci., Volume 19, Issue 6 (June 2018) – 276 articles

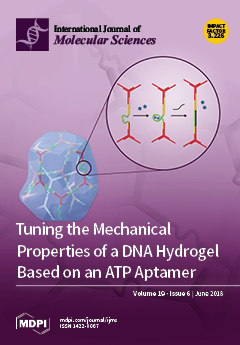
Cover Story (view full-size image): A Y-scaffold (red line) and linear linker (yellow line) were designed to form a DNA hydrogel by hybridization of the reactive ends. An adenosine triphosphate (ATP) aptamer sequence (green line) was inserted into the linker region. On addition of ATP (blue star), the conformational transition of the aptamer had a great influence on the mechanical properties of the DNA hydrogel. The mechanical properties can be further tuned by adding a fully complementary strand (black line) of the aptamer. View Paper here.
  • Issues are regarded as officially published after their release is announced to the table of contents alert mailing list.
  • You may sign up for e-mail alerts to receive table of contents of newly released issues.
  • PDF is the official format for papers published in both, html and pdf forms. To view the papers in pdf format, click on the "PDF Full-text" link, and use the free Adobe Reader to open them.
Order results
Result details
Section
Select all
Export citation of selected articles as:
35 pages, 2440 KiB  
Review
Rho GTPases in Intellectual Disability: From Genetics to Therapeutic Opportunities
by Valentina Zamboni, Rebecca Jones, Alessandro Umbach, Alessandra Ammoni, Maria Passafaro, Emilio Hirsch and Giorgio R. Merlo
Int. J. Mol. Sci. 2018, 19(6), 1821; https://doi.org/10.3390/ijms19061821 - 20 Jun 2018
Cited by 59 | Viewed by 9113
Abstract
Rho-class small GTPases are implicated in basic cellular processes at nearly all brain developmental steps, from neurogenesis and migration to axon guidance and synaptic plasticity. GTPases are key signal transducing enzymes that link extracellular cues to the neuronal responses required for the construction [...] Read more.
Rho-class small GTPases are implicated in basic cellular processes at nearly all brain developmental steps, from neurogenesis and migration to axon guidance and synaptic plasticity. GTPases are key signal transducing enzymes that link extracellular cues to the neuronal responses required for the construction of neuronal networks, as well as for synaptic function and plasticity. Rho GTPases are highly regulated by a complex set of activating (GEFs) and inactivating (GAPs) partners, via protein:protein interactions (PPI). Misregulated RhoA, Rac1/Rac3 and cdc42 activity has been linked with intellectual disability (ID) and other neurodevelopmental conditions that comprise ID. All genetic evidences indicate that in these disorders the RhoA pathway is hyperactive while the Rac1 and cdc42 pathways are consistently hypoactive. Adopting cultured neurons for in vitro testing and specific animal models of ID for in vivo examination, the endophenotypes associated with these conditions are emerging and include altered neuronal networking, unbalanced excitation/inhibition and altered synaptic activity and plasticity. As we approach a clearer definition of these phenotype(s) and the role of hyper- and hypo-active GTPases in the construction of neuronal networks, there is an increasing possibility that selective inhibitors and activators might be designed via PPI, or identified by screening, that counteract the misregulation of small GTPases and result in alleviation of the cognitive condition. Here we review all knowledge in support of this possibility. Full article
(This article belongs to the Special Issue Small GTPases)
Show Figures

Graphical abstract

Graphical abstract
Full article ">Figure 1
<p>Regulations of Rho GTPases at the growth cone, by GTPase-activating proteins (GAPs) and Guanine nucleotide Exchange Factors (GEFs) implicated in Intellectual Disability. Green and red boxes surround GEF and GAP proteins, respectively. Asterisks indicate that are mutated in Intellectual Disability (ID) and other human diseases comprising ID. Circled P indicates phosphorylation. Arrows indicate activation, T bars indicate inhibition. A representative small magnification image of a growth cone is provided in the inset (top left). ROCK, Rho kinase-LIM domain kinase; MLC, myosin light chain; PAK1-2-3, p21-activated kinase 1-2-3; LIMK1-2, Rho kinase-LIM domain kinase 1-2.</p>
Full article ">Figure 2
<p>Regulations of Rho GTPases at the leading edge of a migrating neuron, by GAPs and GEFs implicated in Intellectual Disability. Green and red boxes surround GEF and GAP proteins, respectively. Circled P indicates phosphorylation. Arrows indicate activation, T bars indicate inhibition. A representative small magnification image of a migrating neuron with an evident leading edge is provided in the inset (top left). ROCK, Rho kinase-LIM domain kinase; MLC, myosin light chain; PAK1-2-3, p21-activated kinase 1-2-3; LIMK1-2, Rho kinase-LIM domain kinase 1-2.</p>
Full article ">Figure 3
<p>Regulations of Rho GTPases at the dendritic spine of an excitatory synapse, by GAPs and GEFs implicated in Intellectual Disability. Green and red boxes surround GEF and GAP proteins, respectively. Asterisks indicate genes that are mutated in ID and other human diseases comprising ID. Circled P indicates phosphorylation. Arrows indicate activation, T bars indicate inhibition. A representative small magnification image of a dendritic spine is provided in the inset (top left). ROCK, Rho kinase-LIM domain kinase; RICS, Rho GTPase activating protein 32; DOCK10, dedicator of cytokinesis 10; RICH2, Rho GTPase activating protein 44; PAK1-2-3, p21-activated kinase 1-2-3; LIMK1-2, Rho kinase-LIM domain kinase 1-2.</p>
Full article ">
13 pages, 3009 KiB  
Article
Does the Automatic Measurement of Interleukin 6 Allow for Prediction of Complications during the First 48 h of Acute Pancreatitis?
by Witold Kolber, Paulina Dumnicka, Małgorzata Maraj, Beata Kuśnierz-Cabala, Piotr Ceranowicz, Michał Pędziwiatr, Barbara Maziarz, Małgorzata Mazur-Laskowska, Marek Kuźniewski, Mateusz Sporek and Jerzy Walocha
Int. J. Mol. Sci. 2018, 19(6), 1820; https://doi.org/10.3390/ijms19061820 - 20 Jun 2018
Cited by 21 | Viewed by 5256
Abstract
Acute pancreatitis (AP) in most patients takes a course of self-limiting local inflammation. However, up to 20% of patients develop severe AP (SAP), associated with systemic inflammation and/or pancreatic necrosis. Early prediction of SAP allows for the appropriate intensive treatment of severe cases, [...] Read more.
Acute pancreatitis (AP) in most patients takes a course of self-limiting local inflammation. However, up to 20% of patients develop severe AP (SAP), associated with systemic inflammation and/or pancreatic necrosis. Early prediction of SAP allows for the appropriate intensive treatment of severe cases, which reduces mortality. Serum interleukin-6 (IL-6) has been proposed as a biomarker to assist early diagnosis of SAP, however, most data come from studies utilizing IL-6 measurements with ELISA. Our aim was to verify the diagnostic usefulness of IL-6 for the prediction of SAP, organ failure, and need for intensive care in the course of AP using a fully automated assay. The study included 95 adult patients with AP of various severity (29 mild, 58 moderately-severe, 8 severe) admitted to a hospital within 24 h from the onset of symptoms. Serum IL-6 was measured using electochemiluminescence immunoassay in samples collected on admission and on the next day of hospital stay. On both days, patients with SAP presented the highest IL-6 levels. IL-6 correlated positively with other inflammatory markers (white blood cell and neutrophil counts, C-reactive protein, procalcitonin), the markers of renal injury (kidney injury molecule-1 and neutrophil gelatinase-associated lipocalin), and the markers of endothelial dysfunction (angiopoietin-2, soluble fms-like tyrosine kinase-1). IL-6 on admission significantly predicted SAP, vital organ failure, and the need for intensive care or death, with areas under the receiver operating curve between 0.75 and 0.78, not significantly different from multi-variable prognostic scores. The fully automated assay allows for fast and repeatable measurements of serum IL-6, enabling wider clinical use of this valuable biomarker. Full article
(This article belongs to the Special Issue Cell and Molecular Biology of Pancreatic Disorders)
Show Figures

Figure 1

Figure 1
<p>Serum concentrations of IL-6 among patients with various etiology of acute pancreatitis (AP) at admission (<b>A</b>) and on day 2 of hospital stay (<b>B</b>). Data are shown as median, interquartile range (box), non-outlier range (whiskers) and outliers (points).</p>
Full article ">Figure 2
<p>IL-6 concentrations at admission (<b>A</b>) and on day 2 of hospital stay (<b>B</b>) in edematous and necrotizing pancreatitis. Data are shown as median, interquartile range (box), non-outlier range (whiskers) and outliers (points).</p>
Full article ">Figure 3
<p>ROC curves showing diagnostic usefulness of IL-6 on admission (solid lines) in comparison to known predictive scores (Ranson’s, BISAP, BALI, PANC3) in prediction of SAP according to 2012 Atlanta classification (<b>A</b>), organ failure with 2 or more points in Marshall score (<b>B</b>), and ICU transfer or death (<b>C</b>). The values of area under the ROC curve (AUC) with standard errors (in brackets) are shown on the graphs.</p>
Full article ">
14 pages, 2727 KiB  
Article
Effect of Surfactant Type and Sonication Energy on the Electrical Conductivity Properties of Nanocellulose-CNT Nanocomposite Films
by Sanna Siljander, Pasi Keinänen, Anna Räty, Karthik Ram Ramakrishnan, Sampo Tuukkanen, Vesa Kunnari, Ali Harlin, Jyrki Vuorinen and Mikko Kanerva
Int. J. Mol. Sci. 2018, 19(6), 1819; https://doi.org/10.3390/ijms19061819 - 20 Jun 2018
Cited by 36 | Viewed by 5877
Abstract
We present a detailed study on the influence of sonication energy and surfactant type on the electrical conductivity of nanocellulose-carbon nanotube (NFC-CNT) nanocomposite films. The study was made using a minimum amount of processing steps, chemicals and materials, to optimize the conductivity properties [...] Read more.
We present a detailed study on the influence of sonication energy and surfactant type on the electrical conductivity of nanocellulose-carbon nanotube (NFC-CNT) nanocomposite films. The study was made using a minimum amount of processing steps, chemicals and materials, to optimize the conductivity properties of free-standing flexible nanocomposite films. In general, the NFC-CNT film preparation process is sensitive concerning the dispersing phase of CNTs into a solution with NFC. In our study, we used sonication to carry out the dispersing phase of processing in the presence of surfactant. In the final phase, the films were prepared from the dispersion using centrifugal cast molding. The solid films were analyzed regarding their electrical conductivity using a four-probe measuring technique. We also characterized how conductivity properties were enhanced when surfactant was removed from nanocomposite films; to our knowledge this has not been reported previously. The results of our study indicated that the optimization of the surfactant type clearly affected the formation of freestanding films. The effect of sonication energy was significant in terms of conductivity. Using a relatively low 16 wt. % concentration of multiwall carbon nanotubes we achieved the highest conductivity value of 8.4 S/cm for nanocellulose-CNT films ever published in the current literature. This was achieved by optimizing the surfactant type and sonication energy per dry mass. Additionally, to further increase the conductivity, we defined a preparation step to remove the used surfactant from the final nanocomposite structure. Full article
(This article belongs to the Special Issue Synthesis and Applications of Biopolymer Composites)
Show Figures

Graphical abstract

Graphical abstract
Full article ">Figure 1
<p>Conductivity of nanocomposite films processed using surfactants Triton X-100, Pluronic F-127 and cetyl trimethylammonium bromide. Concentration in weight percentages.</p>
Full article ">Figure 2
<p>Conductivity of nanocomposite films before and after (<b>a</b>) Triton X-100 surfactant removal, (<b>b</b>) CTAB surfactant removal, and (<b>c</b>) Pluronic surfactant removal.</p>
Full article ">Figure 3
<p>Comparison of obtained electrical conductivity of NFC-CNT nanocomposite films from the current literature. Pink star (letter k) refers to our data (Triton X-100), while other letters refer to a [<a href="#B9-ijms-19-01819" class="html-bibr">9</a>], b [<a href="#B56-ijms-19-01819" class="html-bibr">56</a>], c [<a href="#B57-ijms-19-01819" class="html-bibr">57</a>], d [<a href="#B58-ijms-19-01819" class="html-bibr">58</a>], e [<a href="#B22-ijms-19-01819" class="html-bibr">22</a>], f [<a href="#B9-ijms-19-01819" class="html-bibr">9</a>], g [<a href="#B24-ijms-19-01819" class="html-bibr">24</a>], h [<a href="#B57-ijms-19-01819" class="html-bibr">57</a>], i [<a href="#B59-ijms-19-01819" class="html-bibr">59</a>], j [<a href="#B15-ijms-19-01819" class="html-bibr">15</a>], l [<a href="#B32-ijms-19-01819" class="html-bibr">32</a>] and m [<a href="#B27-ijms-19-01819" class="html-bibr">27</a>].</p>
Full article ">Figure 4
<p>SEM imaging of NFC-CNT nanocomposite films surface (166 and 666 kJ/g) containing surfactant (<b>a</b>,<b>c</b>) and after removal of surfactant Triton X-100 by washing them in acetone (<b>b</b>,<b>d</b>).</p>
Full article ">Figure 5
<p>SEM imaging of the nanocomposite film (Triton X-100, 500 kJ/g) cross-section when embedded in epoxy: <b>Left</b> side: overall structure; <b>Right</b> side: magnification in the center of the film.</p>
Full article ">Figure 6
<p>Preparation procedure of NFC-CNT dispersion and nanocomposite films.</p>
Full article ">
12 pages, 3185 KiB  
Review
Possible Molecular Targets of Novel Ruthenium Complexes in Antiplatelet Therapy
by Thanasekaran Jayakumar, Chia-Yuan Hsu, Themmila Khamrang, Chih-Hsuan Hsia, Chih-Wei Hsia, Manjunath Manubolu and Joen-Rong Sheu
Int. J. Mol. Sci. 2018, 19(6), 1818; https://doi.org/10.3390/ijms19061818 - 20 Jun 2018
Cited by 12 | Viewed by 4686
Abstract
In oncotherapy, ruthenium (Ru) complexes are reflected as potential alternatives for platinum compounds and have been proved as encouraging anticancer drugs with high efficacy and low side effects. Cardiovascular diseases (CVDs) are mutually considered as the number one killer globally, and thrombosis is [...] Read more.
In oncotherapy, ruthenium (Ru) complexes are reflected as potential alternatives for platinum compounds and have been proved as encouraging anticancer drugs with high efficacy and low side effects. Cardiovascular diseases (CVDs) are mutually considered as the number one killer globally, and thrombosis is liable for the majority of CVD-related deaths. Platelets, an anuclear and small circulating blood cell, play key roles in hemostasis by inhibiting unnecessary blood loss of vascular damage by making blood clot. Platelet activation also plays a role in cancer metastasis and progression. Nevertheless, abnormal activation of platelets results in thrombosis under pathological settings such as the rupture of atherosclerotic plaques. Thrombosis diminishes the blood supply to the heart and brain resulting in heart attacks and strokes, respectively. While currently used anti-platelet drugs such as aspirin and clopidogrel demonstrate efficacy in many patients, they exert undesirable side effects. Therefore, the development of effective therapeutic strategies for the prevention and treatment of thrombotic diseases is a demanding priority. Recently, precious metal drugs have conquered the subject of metal-based drugs, and several investigators have motivated their attention on the synthesis of various ruthenium (Ru) complexes due to their prospective therapeutic values. Similarly, our recent studies established that novel ruthenium-based compounds suppressed platelet aggregation via inhibiting several signaling cascades. Our study also described the structure antiplatelet-activity relationship (SAR) of three newly synthesized ruthenium-based compounds. This review summarizes the antiplatelet activity of newly synthesized ruthenium-based compounds with their potential molecular mechanisms. Full article
(This article belongs to the Special Issue Molecular Pharmacology and Pathology of Strokes)
Show Figures

Figure 1

Figure 1
<p>Synthetic procedure of the ligands (<b>A</b>) and its complexes (<b>B</b>) of TQ-1, TQ-2, TQ-3, TQ-5 and TQ-6; (<b>C</b>) Structures of ruthenium (II) methylimidazole complexes [Ru(MeIm)<sub>4</sub>(4npip)]<sup>2+</sup> and [Ru(MeIm)<sub>4</sub>(4mopip)]<sup>2+</sup>.</p>
Full article ">Figure 1 Cont.
<p>Synthetic procedure of the ligands (<b>A</b>) and its complexes (<b>B</b>) of TQ-1, TQ-2, TQ-3, TQ-5 and TQ-6; (<b>C</b>) Structures of ruthenium (II) methylimidazole complexes [Ru(MeIm)<sub>4</sub>(4npip)]<sup>2+</sup> and [Ru(MeIm)<sub>4</sub>(4mopip)]<sup>2+</sup>.</p>
Full article ">Figure 2
<p>General representation of the main targets and proposed mechanisms of action of ruthenium compounds as antiplatelet drugs. <span class="html-fig-inline" id="ijms-19-01818-i001"> <img alt="Ijms 19 01818 i001" src="/ijms/ijms-19-01818/article_deploy/html/images/ijms-19-01818-i001.png"/></span> inhibits; <span class="html-fig-inline" id="ijms-19-01818-i002"> <img alt="Ijms 19 01818 i002" src="/ijms/ijms-19-01818/article_deploy/html/images/ijms-19-01818-i002.png"/></span> blocks; <span class="html-fig-inline" id="ijms-19-01818-i003"> <img alt="Ijms 19 01818 i003" src="/ijms/ijms-19-01818/article_deploy/html/images/ijms-19-01818-i003.png"/></span> decrease; <span class="html-fig-inline" id="ijms-19-01818-i004"> <img alt="Ijms 19 01818 i004" src="/ijms/ijms-19-01818/article_deploy/html/images/ijms-19-01818-i004.png"/></span> increase.</p>
Full article ">Figure 3
<p>Molecular targets of Ru-thio-chrysin to its inhibitory effects on platelet function.</p>
Full article ">
21 pages, 2754 KiB  
Article
Studies of Microbiota Dynamics Reveals Association of “Candidatus Liberibacter Asiaticus” Infection with Citrus (Citrus sinensis) Decline in South of Iran
by Alessandro Passera, Hamidreza Alizadeh, Mehdi Azadvar, Fabio Quaglino, Asma Alizadeh, Paola Casati and Piero A. Bianco
Int. J. Mol. Sci. 2018, 19(6), 1817; https://doi.org/10.3390/ijms19061817 - 20 Jun 2018
Cited by 11 | Viewed by 4047
Abstract
Citrus Decline Disease was recently reported to affect several citrus species in Iran when grafted on a local rootstock variety, Bakraee. Preliminary studies found “Candidatus Phytoplasma aurantifoliae” and “Candidatus Liberibacter asiaticus” as putative etiological agents, but were not ultimately able to [...] Read more.
Citrus Decline Disease was recently reported to affect several citrus species in Iran when grafted on a local rootstock variety, Bakraee. Preliminary studies found “Candidatus Phytoplasma aurantifoliae” and “Candidatus Liberibacter asiaticus” as putative etiological agents, but were not ultimately able to determine which one, or if an association of both, were causing the disease. The current study has the aim of characterizing the microbiota of citrus plants that are either asymptomatic, showing early symptoms, or showing late symptoms through amplification of the V1–V3 region of 16S rRNA gene using an Illumina sequencer in order to (i) clarify the etiology of the disease, and (ii) describe the microbiota associated to different symptom stages. Our results suggest that liberibacter may be the main pathogen causing Citrus Decline Disease, but cannot rule out the possibility of phytoplasma being involved as well. The characterization of microbiota shows that the leaves show only two kinds of communities, either symptomatic or asymptomatic, while roots show clear distinction between early and late symptoms. These results could lead to the identification of bacteria that are related to successful plant defense response and, therefore, to immunity to the Citrus Decline Disease. Full article
(This article belongs to the Special Issue Plant Innate Immunity 2.0)
Show Figures

Figure 1

Figure 1
<p>Graphs describing the different distribution of OTUs among different organs and/or sanitary statuses of examined plants: (<b>a</b>) Between all leaves and roots, regardless of sanitary status; (<b>b</b>) between leaves and roots of asymptomatic plants; (<b>c</b>) between leaves and roots of early symptomatic plants; (<b>d</b>) between leaves and roots of late symptomatic plants; (<b>e</b>) between the asymptomatic, early symptomatic, and late symptomatic plants at the leaves; (<b>f</b>) between the asymptomatic, early symptomatic, and late symptomatic plants at the roots.</p>
Full article ">Figure 2
<p>Graph describing the taxonomic distribution of OTUs among different organs (leaves or roots, indicated by brackets at the top) and/or sanitary statuses (asymptomatic (ASP), early symptomatic (ESP), or late symptomatic (LSP)) of examined plants at phylum level.</p>
Full article ">Figure 3
<p>Principal Component Analysis calculated among all the samples, based on the relative abundance of OTUs in each phyla. The line was added to highlight the separation between leaves and roots.</p>
Full article ">Figure 4
<p>Graphs reporting the presence and abundance of pathogenic agents “<span class="html-italic">Ca</span>. Phytoplasma” and “<span class="html-italic">Ca</span>. Liberibacter” in the analyzed material according to metagenomic analyses: (<b>a</b>) Bar graph showing the average absolute abundance (number of OTUs) for each category of sample, with error bars indicating standard deviation among samples of the same category. Light grey bars indicate “<span class="html-italic">Ca</span>. Liberibacter” while dark grey bars indicate “<span class="html-italic">Ca</span>. Phytoplasma”; (<b>b</b>) circular graph indicating the relative abundance of different OTUs associated to “<span class="html-italic">Ca</span>. Liberibacter” in the different samples. Each circular bar represents a different category of sample as follow, from innermost circle to outermost: ASP leaf, ESP leaf, LSP leaf, ASP root, ESP root, LSP root; (<b>c</b>) circular graph indicating the relative abundance of different OTUs associated to “<span class="html-italic">Ca</span>. Phytoplasma” in the different samples. Each circular bar represents a different category of sample as follow, from innermost circle to outermost: ASP leaf, ESP leaf, LSP leaf, ASP root, ESP root, LSP root.</p>
Full article ">Figure 5
<p>Box plots reporting the shift in absolute abundance of relevant taxonomical families in ESP and LSP samples compared to the ASP. Difference in abundance is expressed as fold change in a logarithmic scale (base 10). Median values above 0.5 or above −0.5 were considered relevant differences. (<b>a</b>) box plot showing the differences in leaves, highlighting with lines at the bottom families belonging to the same <span class="html-italic">phylum</span>, and with brackets on top those belonging to the same order; (<b>b</b>) box plot showing the differences in roots, highlighting with lines at the bottom families belonging to the same <span class="html-italic">phylum</span>, and with brackets on top those belonging to the same class.</p>
Full article ">Figure 6
<p>Pie graphs describing the relative abundance of genera in the Actinobacteria <span class="html-italic">phylum</span>. Between brackets is indicated the total share of the <span class="html-italic">phylum</span>, while each genus is represented by the size of the corresponding slice. (<b>a</b>) ASP leaves; (<b>b</b>) ESP leaves; (<b>c</b>) LSP leaves; (<b>d</b>) ASP roots; (<b>e</b>) ESP roots; (<b>f</b>) LSP roots.</p>
Full article ">Figure 7
<p>Pie graphs describing the relative abundance of genera in the Firmicutes <span class="html-italic">phylum</span>. Between brackets is indicated the total share of the <span class="html-italic">phylum</span>, while each genus is represented by the size of the corresponding slice. (<b>a</b>) ASP leaves; (<b>b</b>) ESP leaves; (<b>c</b>) LSP leaves; (<b>d</b>) ASP roots; (<b>e</b>) ESP roots; (<b>f</b>) LSP roots.</p>
Full article ">Figure 8
<p>Pie graphs describing the relative abundance of genera in the Proteobacteria <span class="html-italic">phylum</span>. Between brackets is indicated the total share of the <span class="html-italic">phylum</span>, while each genus is represented by the size of the corresponding slice. (<b>a</b>) ASP leaves; (<b>b</b>) ESP leaves; (<b>c</b>) LSP leaves; (<b>d</b>) ASP roots; (<b>e</b>) ESP roots; (<b>f</b>) LSP roots.</p>
Full article ">Figure 9
<p>Principal Component Analysis calculated among the leaf samples, based on the relative abundance of OTUs in each family. The line was added to highlight the separation between the ASP leaf samples and the ESP/LSP leaf samples.</p>
Full article ">Figure 10
<p>Principal Component Analysis calculated among the root samples, based on the relative abundance of OTUs in each family. The lines were added to highlight the separation between the ASP root samples, the ESP root samples, and the LSP root samples.</p>
Full article ">
14 pages, 557 KiB  
Review
Diabetic Retinopathy: Pathophysiology and Treatments
by Wei Wang and Amy C. Y. Lo
Int. J. Mol. Sci. 2018, 19(6), 1816; https://doi.org/10.3390/ijms19061816 - 20 Jun 2018
Cited by 843 | Viewed by 43519
Abstract
Diabetic retinopathy (DR) is the most common complication of diabetes mellitus (DM). It has long been recognized as a microvascular disease. The diagnosis of DR relies on the detection of microvascular lesions. The treatment of DR remains challenging. The advent of anti-vascular endothelial [...] Read more.
Diabetic retinopathy (DR) is the most common complication of diabetes mellitus (DM). It has long been recognized as a microvascular disease. The diagnosis of DR relies on the detection of microvascular lesions. The treatment of DR remains challenging. The advent of anti-vascular endothelial growth factor (VEGF) therapy demonstrated remarkable clinical benefits in DR patients; however, the majority of patients failed to achieve clinically-significant visual improvement. Therefore, there is an urgent need for the development of new treatments. Laboratory and clinical evidence showed that in addition to microvascular changes, inflammation and retinal neurodegeneration may contribute to diabetic retinal damage in the early stages of DR. Further investigation of the underlying molecular mechanisms may provide targets for the development of new early interventions. Here, we present a review of the current understanding and new insights into pathophysiology in DR, as well as clinical treatments for DR patients. Recent laboratory findings and related clinical trials are also reviewed. Full article
(This article belongs to the Special Issue Retinal Diseases: Bridging Basic and Clinical Research)
Show Figures

Figure 1

Figure 1
<p>① Nesvacumab activates Tie-2 signaling and decreases vascular permeability by inhibiting Ang-2, an antagonist of Tie2. ② AKB-9778 activates Tie-2 signaling by inhibiting ③ VE-PTP, a negative regulator of Tie-2.</p>
Full article ">
11 pages, 1792 KiB  
Article
Exploring the Mechanism of Inhibition of Au Nanoparticles on the Aggregation of Amyloid-β(16-22) Peptides at the Atom Level by All-Atom Molecular Dynamics
by Menghua Song, Yunxiang Sun, Yin Luo, Yanyan Zhu, Yongsheng Liu and Huiyu Li
Int. J. Mol. Sci. 2018, 19(6), 1815; https://doi.org/10.3390/ijms19061815 - 20 Jun 2018
Cited by 39 | Viewed by 5511
Abstract
The abnormal self-assembly of the amyloid-β peptide into toxic β-rich aggregates can cause Alzheimer’s disease. Recently, it has been shown that small gold nanoparticles (AuNPs) inhibit Aβ aggregation and fibrillation by slowing down the nucleation process in experimental studies. However, the effects of [...] Read more.
The abnormal self-assembly of the amyloid-β peptide into toxic β-rich aggregates can cause Alzheimer’s disease. Recently, it has been shown that small gold nanoparticles (AuNPs) inhibit Aβ aggregation and fibrillation by slowing down the nucleation process in experimental studies. However, the effects of AuNPs on Aβ oligomeric structures are still unclear. In this study, we investigate the conformation of Aβ(16-22) tetramers/octamers in the absence and presence of AuNPs using extensive all-atom molecular-dynamics simulations in explicit solvent. Our studies demonstrate that the addition of AuNPs into Aβ(16-22) solution prevents β-sheet formation, and the inhibition depends on the concentration of Aβ(16-22) peptides. A detailed analysis of the Aβ(16-22)/Aβ(16-22)/water/AuNPs interactions reveals that AuNPs inhibit the β-sheet formation resulting from the same physical forces: hydrophobic interactions. Overall, our computational study provides evidence that AuNPs are likely to inhibit Aβ(16-22) and full-length Aβ fibrillation. Thus, this work provides theoretical insights into the development of inorganic nanoparticles as drug candidates for treatment of AD. Full article
(This article belongs to the Special Issue Translating Gold Nanoparticles to Diagnostics and Therapeutics)
Show Figures

Graphical abstract

Graphical abstract
Full article ">Figure 1
<p>Detailed analysis of a representative molecular dynamics (MD) trajectory starting from the initial state for the Aβ-tetramer system (<b>A</b>), Aβ-tetramer + AuNPs system(<b>B</b>), Aβ-octamer system (<b>C</b>), and Aβ-octamer + AuNPs system (<b>D</b>). Snapshots at seven different time points and the top view of the snapshot generated at <span class="html-italic">t</span> = 500 ns. The peptides are represented as cartoons, with the β sheet in yellow, the coil in cyan and the other secondary structure in white and purple. The AuNPs are in van der Waals (vdW) representation in pink. For clarity, counter ions and water molecules are not shown.</p>
Full article ">Figure 2
<p>Calculated β-sheet probability of each residue of Aβ (16-22) peptides in (<b>A</b>) the Aβ tetramer system (red) and Aβ tetramer + AuNPs system (black) and (<b>B</b>) the Aβ octamer system (red) and the Aβ octamer + AuNPs system (black).</p>
Full article ">Figure 3
<p>Representative conformations of the top two most-populated clusters for the Aβ tetramer in the absence (<b>A</b>) and presence (<b>B</b>) of AuNPs. Side-chain-side-chain (SC-SC) and main-chain-main-chain (MC-MC) contact probability maps for Aβ tetramer in the absence (<b>C</b>,<b>E</b>) and presence (<b>D</b>,<b>F</b>) of AuNPs. The Aβ tetramer is shown in new cartoon representation. The peptides are colored in yellow. The AuNPs are in vdW representation and colored in pink.</p>
Full article ">Figure 4
<p>Probability distribution of the minimum distance between the side chain of each residue.and AuNPs’ surface in the Aβ tetramer/octamer + AuNPs system. The distance between AuNPs’ surface and (<b>A</b>) K16, E22, (<b>B</b>) L17, V18, A21, (<b>C</b>)F19, F20.</p>
Full article ">Figure 5
<p>Solvent accessible surface area of each residue as a function of amino acid residue (<b>A</b>) for the Aβ tetramer (<b>B</b>) and the Aβ octamer in the absence (black) and presence (red) of AuNPs. Residue-based binding interaction analysis: contact probability (<b>C</b>,<b>D</b>) and binding free energy (in kcal mol<sup>−1</sup>) (<b>E</b>,<b>F</b>).</p>
Full article ">
15 pages, 2699 KiB  
Article
Yeast-Based Screen to Identify Natural Compounds with a Potential Therapeutic Effect in Hailey-Hailey Disease
by Graziella Ficociello, Azzurra Zonfrilli, Samantha Cialfi, Claudio Talora and Daniela Uccelletti
Int. J. Mol. Sci. 2018, 19(6), 1814; https://doi.org/10.3390/ijms19061814 - 20 Jun 2018
Cited by 6 | Viewed by 5289
Abstract
The term orthodisease defines human disorders in which the pathogenic gene has orthologs in model organism genomes. Yeasts have been instrumental for gaining insights into the molecular basis of many human disorders, particularly those resulting from impaired cellular metabolism. We and others have [...] Read more.
The term orthodisease defines human disorders in which the pathogenic gene has orthologs in model organism genomes. Yeasts have been instrumental for gaining insights into the molecular basis of many human disorders, particularly those resulting from impaired cellular metabolism. We and others have used yeasts as a model system to study the molecular basis of Hailey-Hailey disease (HHD), a human blistering skin disorder caused by haploinsufficiency of the gene ATP2C1 the orthologous of the yeast gene PMR1. We observed that K. lactis cells defective for PMR1 gene share several biological similarities with HHD derived keratinocytes. Based on the conservation of ATP2C1/PMR1 function from yeast to human, here we used a yeast-based assay to screen for molecules able to influence the pleiotropy associated with PMR1 deletion. We identified six compounds, Kaempferol, Indirubin, Lappaconite, Cyclocytidine, Azomycin and Nalidixic Acid that induced different major shape phenotypes in K. lactis. These include mitochondrial and the cell-wall morphology-related phenotypes. Interestingly, a secondary assay in mammalian cells confirmed activity for Kaempferol. Indeed, this compound was also active on human keratinocytes depleted of ATP2C1 function by siRNA-treatment used as an in-vitro model of HHD. We found that Kaempferol was a potent NRF2 regulator, strongly inducing its expression and its downstream target NQO1. In addition, Kaempferol could decrease oxidative stress of ATP2C1 defective keratinocytes, characterized by reduced NRF2-expression. Our results indicated that the activation of these pathways might provide protection to the HHD-skin cells. As oxidative stress plays pivotal roles in promoting the skin lesions of Hailey-Hailey, the NRF2 pathway could be a viable therapeutic target for HHD. Full article
(This article belongs to the Special Issue Rare Diseases: Molecular Mechanisms and Therapeutic Strategies)
Show Figures

Graphical abstract

Graphical abstract
Full article ">Figure 1
<p>(<b>A</b>) General flowchart of the natural products screen approach. The primary screening is performed to identify compounds that alleviate the oxidative stress of <span class="html-italic">pmr1</span>-mutant cells. Then the effects of the positive hits are tested for the other phenotypes of the mutant strain. The final step is to test the selected molecules on the human cell cultures used as model for Hailey-Hailey disease; (<b>B</b>) The <span class="html-italic">PMR1</span>-deleted strain exposed or not for 24 h to different natural products was tested for its ability to grow with or without the 60 µM menadione or 4 mM H<sub>2</sub>O<sub>2</sub>. Wild type cells (WT) were used as control.</p>
Full article ">Figure 2
<p>Analysis of calcium alteration. WT and <span class="html-italic">Klpmr1∆</span> cells exposed or not to the individual natural molecules, were grown for 24 h in Yeast Extract-Peptone-Dextrose (YPD) medium at 30 °C. Then, serial dilutions of the cultures were spotted onto solid medium supplemented or not with 20 mM EGTA. Scale bar:</p>
Full article ">Figure 3
<p>Chitin distribution of mutant cells treated with the six selected products. <span class="html-italic">PMR1</span>-deleted cells, grown with or without the individual compounds for 24 h at 30 °C, were stained with the chitin-binding dye CFW. At least 500 cells were analyzed for each treatment to determine the percentage of cell wall recovery. Wild type cells (WT) represent the positive control. Scale bar 2 µm.</p>
Full article ">Figure 4
<p>Effect of the natural compounds on the altered mitochondrial function of <span class="html-italic">pmr1∆</span> cells. The mutant cells, untreated or treated with the indicated molecules for 24 h, were stained with the vital dye DASPMI and immediately the fluorescence micrographs were taken. To calculate the percentage of cells with altered tubular mitochondria morphology, at least 500 cells were analyzed for each condition. Wild type strain (WT) was used as a control. Scale bar 2 µm.</p>
Full article ">Figure 5
<p>Keratinocytes-derived cell line, HaCaT, was transfected with either siRNA-CTR or siRNA-ATP2C1; 24 h post-transfection, cells were treated with the indicated compounds at 10 µM for a further 24 h and analyzed by microscopy. (100× magnification). The potencies (EC<sub>50</sub> = 0.8 µM +/− 0.1) of Kaempferol were obtained from the dose–response curves using GraphPad Prism (GraphPad Software, La Jolla, CA, USA). Scale bar: 50 µm.</p>
Full article ">Figure 6
<p>(<b>A</b>,<b>B</b>) NHKCs (primary human keratinocytes) were transfected with control (siRNA-CTR) or ATP2C1-specific siRNA oligonucleotides; 24 h later, cells were treated with Kaempferol (10 µΜ) for 24 h and analyzed by microscopy. (100× magnification). Each of the lower images is an enlarged subset of the image above. Scale bar: 50 µm.</p>
Full article ">Figure 7
<p>Cell extracts were prepared from both NHKCs (<b>A</b>,<b>B</b>) and HaCaT cells (<b>C</b>,<b>D</b>) transfected with either control (siRNA-CTR) or ATP2C1-specific siRNA oligonucleotides; 24 h later, cells were treated with Kaempferol (10 µΜ) for 24 h and the cell extracts analyzed by western blot; (<b>E</b>) Cells were treated as in C, and expression of NRF2 was determined by RT-PCR; (<b>F</b>) Keratinocytes-derived cell line, HaCaT, was transfected with either siRNA-CTR or siRNA-ATP2C1 and cells were analyzed by flow cytometry. The percentage of ROS-positive cells is also shown. The absolute value of ROS of both from siRNA-CTR and siRNA-ATP2C1 Kaempferol-untreated cells was arbitrary indicated as 100%.</p>
Full article ">Figure 8
<p>(<b>A</b>–<b>C</b>) NHKC cells were transfected with control (siRNA-CTR) or ATP2C1-specific siRNA oligonucleotides; 24 h later, cells were treated with Kaempferol (10 µΜ) for 24 h, the total RNA extracted, and the expression of the indicated targets analyzed by RT-PCR; (<b>D</b>) ATP production in both yeast (left) and primary human keratinocytes (right). ATP levels were analyzed in <span class="html-italic">Klpmr1∆ and WT</span> cells, and ATP production was assessed in primary human keratinocytes transfected with control (siRNA-CTR) or ATP2C1-specific siRNA oligonucleotides.</p>
Full article ">
24 pages, 988 KiB  
Review
Lead (Pb) Exposure Enhances Expression of Factors Associated with Inflammation
by Emilia Metryka, Karina Chibowska, Izabela Gutowska, Anna Falkowska, Patrycja Kupnicka, Katarzyna Barczak, Dariusz Chlubek and Irena Baranowska-Bosiacka
Int. J. Mol. Sci. 2018, 19(6), 1813; https://doi.org/10.3390/ijms19061813 - 20 Jun 2018
Cited by 145 | Viewed by 8977
Abstract
The human immune system is constantly exposed to xenobiotics and pathogens from the environment. Although the mechanisms underlying their influence have already been at least partially recognized, the effects of some factors, such as lead (Pb), still need to be clarified. The results [...] Read more.
The human immune system is constantly exposed to xenobiotics and pathogens from the environment. Although the mechanisms underlying their influence have already been at least partially recognized, the effects of some factors, such as lead (Pb), still need to be clarified. The results of many studies indicate that Pb has a negative effect on the immune system, and in our review, we summarize the most recent evidence that Pb can promote inflammatory response. We also discuss possible molecular and biochemical mechanisms of its proinflammatory action, including the influence of Pb on cytokine metabolism (interleukins IL-2, IL-4, IL-8, IL-1b, IL-6), interferon gamma (IFNγ), and tumor necrosis factor alpha (TNF-α); the activity and expression of enzymes involved in the inflammatory process (cyclooxygenases); and the effect on selected acute phase proteins: C-reactive protein (CRP), haptoglobin, and ceruloplasmin. We also discuss the influence of Pb on the immune system cells (T and B lymphocytes, macrophages, Langerhans cells) and the secretion of IgA, IgE, IgG, histamine, and endothelin. Full article
(This article belongs to the Section Molecular Toxicology)
Show Figures

Figure 1

Figure 1
<p>Model of lead (Pb<sup>2+</sup>)-induced activation of the <span class="html-italic">IL-8</span> gene. The diagram presents a signaling pathway leading to the induction of the <span class="html-italic">IL-8</span> gene in human AGS cells (human caucasian gastric adenocarcinoma) after the administration of 0.1 μM Pb(NO<sub>3</sub>)<sub>2</sub>. Pb<sup>2+</sup> activates the epidermal growth factor receptor (EGFR) and p42/44 mitogen activated protein (MAP) kinase phosphorylation, which then activates the protein heterodimeric transcriptional factor AP-1 (containing the c-jun protein), resulting in the activation of <span class="html-italic">IL-8</span> gene expression. The use of EGFR inhibitors (PD153035 and AG1478) resulted in a decrease in <span class="html-italic">IL-8</span> gene expression, but EGFR inhibitors were unable to fully abolish Pb(NO<sub>3</sub>)<sub>2</sub>-induced <span class="html-italic">IL-8</span> gene expression. The use of a MAP kinase kinase (MEK) inhibitor (PD98059) significantly suppressed <span class="html-italic">IL-8</span> gene expression.</p>
Full article ">Figure 2
<p>Mechanism of activation and inactivation Nrf 2 by Pb<sup>2+</sup>. In physiological conditions, Nrf2 binds to its inhibitor, Kelch-like ECH-associated protein 1 (Keap1). This is followed by the dimerization and then sequestration of Nrf2 in the cytoplasm. The Keap1–Nrf2 complex connects ubiquitin (via the Cul 3-dependent ligase) and is recognized by the 26S proteosome, where the Nrf2 transcription factor is degraded. After exposure to Pb<sup>2+</sup>, Nrf2 is released from the Keap1–Nrf2 complex, and translocated to the nucleus, where a small Maf protein attaches forming a heterodimer and CREB-binding protein (CBP). The incorporation of the newly formed complex into DNA initiates the transcription of antioxidant response genes and <span class="html-italic">IL-8</span> gene results in enhanced reactive oxygen species (ROS) and IL-8 synthesis.</p>
Full article ">Figure 3
<p>The signaling pathway that results in the production of tumor necrosis factor alpha (TNF-α) in macrophages after the stimulation by lead and lipopolysaccharide (LPS). Lead increases the expression of TNF-α in LPS-treated cells via post-transcriptional mechanisms. It thus increases the effect of lipopolysaccharide (LPS) that is uptaken by the CD14 receptor (cluster of differentiation 14) and its co-receptor TLR 4 (Toll-like receptor TLR 4). The diagram shows some of the transmitters potentially mediating the regulation of TNF-α expression. The signal is transmitted via the MyD88 adapter protein (myeloid differentiation primary response gene 88). One of the activated pathways is the MAPK pathway. MEK1/2 (mitogen-activated protein kinase kinase), MAPK (mitogen-activated protein kinases), and activator protein 1 (AP-1) are activated. The NF-κB factor (nuclear factor kappa B) activation pathway is also stimulated by the regulation of IKKs (IκB kinase) activity. The resulting AP-1 and NF-κB lead to enhanced transcription of TNF-α mRNA. PI3K–AKT pathway is also activated. Attachment of LPS to the receptor leads to the phosphorylation of PI3K (phosphoinositide 3-kinase), which then activates AKT (protein kinase B). There is a mutual adjustment between the NF-κB and PI3K–AKT signaling pathways. The activation of the above-mentioned signaling pathways by LPS and Pb results in enhanced TNF-α synthesis.</p>
Full article ">
25 pages, 720 KiB  
Review
Anti-Inflammatory Effects of Resveratrol: Mechanistic Insights
by Diego De Sá Coutinho, Maria Talita Pacheco, Rudimar Luiz Frozza and Andressa Bernardi
Int. J. Mol. Sci. 2018, 19(6), 1812; https://doi.org/10.3390/ijms19061812 - 20 Jun 2018
Cited by 203 | Viewed by 11785
Abstract
Inflammation is the principal response invoked by the body to address injuries. Despite inflammation constituting a crucial component of tissue repair, it is well known that unchecked or chronic inflammation becomes deleterious, leading to progressive tissue damage. Studies over the past years focused [...] Read more.
Inflammation is the principal response invoked by the body to address injuries. Despite inflammation constituting a crucial component of tissue repair, it is well known that unchecked or chronic inflammation becomes deleterious, leading to progressive tissue damage. Studies over the past years focused on foods rich in polyphenols with anti-inflammatory and immunomodulatory properties, since inflammation was recognized to play a central role in several diseases. In this review, we discuss the beneficial effects of resveratrol, the most widely investigated polyphenol, on cancer and neurodegenerative, respiratory, metabolic, and cardiovascular diseases. We highlight how resveratrol, despite its unfavorable pharmacokinetics, can modulate the inflammatory pathways underlying those diseases, and we identify future opportunities for the evaluation of its clinical feasibility. Full article
(This article belongs to the Special Issue Natural Anti-Inflammatory Agents 2018)
Show Figures

Graphical abstract

Graphical abstract
Full article ">Figure 1
<p>Some of the molecular bases of resveratrol anti-inflammatory effects. Inflammation induces the activation of several cell signaling pathways. The exact mechanism of RSV-mediated protection is not yet understood, but it was described that RSV interacts with multiple targets, and alters dysregulated inflammatory pathways and mediators. Arrows with a point indicate activation, while arrows with a flat tip indicate inhibition. Dashed arrows indicate a poorly understood mechanism.</p>
Full article ">
13 pages, 1557 KiB  
Review
Role of Membrane Cholesterol Levels in Activation of Lyn upon Cell Detachment
by Takao Morinaga, Noritaka Yamaguchi, Yuji Nakayama, Masatoshi Tagawa and Naoto Yamaguchi
Int. J. Mol. Sci. 2018, 19(6), 1811; https://doi.org/10.3390/ijms19061811 - 19 Jun 2018
Cited by 6 | Viewed by 5717
Abstract
Cholesterol, a major component of the plasma membrane, determines the physical
properties of biological membranes and plays a critical role in the assembly of membrane
microdomains. Enrichment or deprivation of membrane cholesterol affects the activities of many
signaling molecules at the plasma membrane.
[...] Read more.
Cholesterol, a major component of the plasma membrane, determines the physical
properties of biological membranes and plays a critical role in the assembly of membrane
microdomains. Enrichment or deprivation of membrane cholesterol affects the activities of many
signaling molecules at the plasma membrane. Cell detachment changes the structure of the plasma
membrane and influences the localizations of lipids, including cholesterol. Recent studies showed
that cell detachment changes the activities of a variety of signaling molecules. We previously reported
that the localization and the function of the Src-family kinase Lyn are critically regulated by its
membrane anchorage through lipid modifications. More recently, we found that the localization and
the activity of Lyn were changed upon cell detachment, although the manners of which vary between
cell types. In this review, we highlight the changes in the localization of Lyn and a role of cholesterol
in the regulation of Lyn’s activation following cell detachment.

Full article
(This article belongs to the Special Issue Cholesterol and Lipoprotein Metabolism)
Show Figures

Graphical abstract

Graphical abstract
Full article ">Figure 1
<p>Trafficking of Src-family kinases. (<b>a</b>) The black arrow indicates biosynthetic trafficking of Lyn kinase. Distributions of c-Src and Fyn differ from that of Lyn. The dashed arrows indicate the translocation of c-Src between the plasma membrane and endosomes. The red and blue wavy lines represent myristic acids and palmitic acids, respectively; (<b>b</b>) Loss of cell–scaffold interactions did not internalize Lyn from the plasma membrane in HeLa S3 cells but internalizes c-Src and Fyn in NIH3T3 cells, whereas caveolin and cholesterol were internalized from the plasma membrane after cell detachment in both cell lines. However, loss of cell–cell interactions is capable of internalizing Lyn in MDCK cells.</p>
Full article ">Figure 2
<p>Fractionations of cellular membranes. (<b>a</b>) Detergent-based fractionation. An ideal membrane fragment consists of detergent-insoluble portion (left half) and detergent-soluble portion (right half). The proteins in detergent-soluble membranes are solubilized with an appropriate concentration of detergent and separated by density gradient fractionation. (<b>b</b>) (<b>i</b>) Membrane fragments comprising differential ratios of proteins to lipids were separated by density gradient fractionation; (<b>ii</b>) the distribution pattern of a given protein of interest in density gradient fractionation (green area) reflects the density of the membrane segments harboring the protein of interest (green circle).</p>
Full article ">Figure 3
<p>Cell detachment activates Lyn through cholesterol depletion. Cell detachment causes internalization of some lipid raft-related molecules, including caveolin and cholesterol, in the plasma membrane. Cholesterol depletion affects the characteristics of the membrane segments harboring Lyn, which is associated with activation of Lyn in suspended cells.</p>
Full article ">
13 pages, 1643 KiB  
Article
Differential Expression and Pathway Analysis in Drug-Resistant Triple-Negative Breast Cancer Cell Lines Using RNASeq Analysis
by Safa Shaheen, Febin Fawaz, Shaheen Shah and Dietrich Büsselberg
Int. J. Mol. Sci. 2018, 19(6), 1810; https://doi.org/10.3390/ijms19061810 - 19 Jun 2018
Cited by 23 | Viewed by 9438
Abstract
Triple-negative breast cancer (TNBC) is among the most notorious types of breast cancer, the treatment of which does not give consistent results due to the absence of the three receptors (estrogen receptor (ER), progesterone receptor (PR), and human epidermal growth factor receptor 2 [...] Read more.
Triple-negative breast cancer (TNBC) is among the most notorious types of breast cancer, the treatment of which does not give consistent results due to the absence of the three receptors (estrogen receptor (ER), progesterone receptor (PR), and human epidermal growth factor receptor 2 (HER2) as well as high amount of molecular variability. Drug resistance also contributes to treatment unresponsiveness. We studied differentially expressed genes, their biological roles, as well as pathways from RNA-Seq datasets of two different TNBC drug-resistant cell lines of Basal B subtype SUM159 and MDA-MB-231 treated with drugs JQ1 and Dexamethasone, respectively, to elucidate the mechanism of drug resistance. RNA sequencing(RNA-Seq) data analysis was done using edgeR which is an efficient program for determining the most significant Differentially Expressed Genes (DEGs), Gene Ontology (GO) terms, and Kyoto Encyclopedia of Genes and Genomes (KEGG) pathways. iPathway analysis was further used to obtain validated results using analysis that takes into consideration type, function, and interactions of genes in the pathway. The significant similarities and differences throw light into the molecular heterogeneity of TNBC, giving clues into the aspects that can be focused to overcome drug resistance. From this study, cytokine-cytokine receptor interaction pathway appeared to be a key factor in TNBC drug resistance. Full article
Show Figures

Graphical abstract

Graphical abstract
Full article ">Figure 1
<p>Multidimensional scaling plots (<b>a</b>) for JQ1 treatment; (<b>b</b>) for Dexamethasone treatment. s1—JQ1 sensitive-3 h treatment, s2—JQ1 sensitive-3 h treatment, s3—JQ1 sensitive-24 h treatment, s4—JQ1 sensitive-24 h treatment, r1—JQ1 resistant-3 h treatment, r2—JQ1 resistant-3 h treatment, r3—JQ1 resistant-24 h treatment, r4—JQ1 resistant-24 h treatment, ctrl1—control 1, ctrl2—control 2, dex2_1—Dexamethasone-2 h treatment, dex2_2—Dexamethasone-2 h treatment, dex4_1—Dexamethasone-4 h treatment and dex4_2—Dexamethasone-4 h treatment.</p>
Full article ">Figure 2
<p>Biological Coefficient of Variation plots: (<b>a</b>) For JQ1 treatment; (<b>b</b>) For Dexamethasone treatment. CPM- counts per million.</p>
Full article ">Figure 2 Cont.
<p>Biological Coefficient of Variation plots: (<b>a</b>) For JQ1 treatment; (<b>b</b>) For Dexamethasone treatment. CPM- counts per million.</p>
Full article ">Figure 3
<p>Heat maps: (<b>a</b>) For 24 h of JQ1 treatment; (<b>b</b>) For four hours of Dexamethasone treatment.</p>
Full article ">Figure 4
<p>Volcano plots: (<b>a</b>) For 24 h of JQ1 treatment. DE thresholds: Fold change 0.6, <span class="html-italic">p</span>-value 0.05.; (<b>b</b>) For four hours of Dex treatment. x-axis: log fold change (log FC), y-axis: negative logarithm of adjusted <span class="html-italic">p</span>-value -log10 (adjPVal). DE thresholds: Fold change 0.6, <span class="html-italic">p</span>-value 0.05.</p>
Full article ">Figure 5
<p>Perturbation (y-axis) vs. Overrepresentation (x-axis) reveals disrupted pathways: (<b>a</b>) At 24 h of JQ1 treatment; (<b>b</b>) At four hours of Dexamethasone treatment. The size of each dot denotes the number of genes in the pathway. The x-axis measures <span class="html-italic">p</span>-values obtained using the classical over-representation analysis (pORA). The y-axis represents the <span class="html-italic">p</span>-values obtained from total perturbation accumulation (pAcc) in the pathway. Yellow: Cytokine-cytokine receptor interaction pathway, Red: Significantly enriched pathways, Black: Non-significantly enriched pathways.</p>
Full article ">
13 pages, 2899 KiB  
Article
Diethyl Blechnic, a Novel Natural Product Isolated from Salvia miltiorrhiza Bunge, Inhibits Doxorubicin-Induced Apoptosis by Inhibiting ROS and Activating JNK1/2
by Jie Yu, Hongwei Gao, Chuanhong Wu, Qiong-Ming Xu, Jin-Jian Lu and Xiuping Chen
Int. J. Mol. Sci. 2018, 19(6), 1809; https://doi.org/10.3390/ijms19061809 - 19 Jun 2018
Cited by 19 | Viewed by 4490
Abstract
Doxorubicin (DOX) is a widely used antineoplastic agent in clinics. However, its clinical application is largely limited by its cardiotoxicity. Diethyl blechnic (DB) is a novel compound isolated from Salvia miltiorrhiza Bunge. Here, we study the effect of DB on DOX-induced cardiotoxicity and [...] Read more.
Doxorubicin (DOX) is a widely used antineoplastic agent in clinics. However, its clinical application is largely limited by its cardiotoxicity. Diethyl blechnic (DB) is a novel compound isolated from Salvia miltiorrhiza Bunge. Here, we study the effect of DB on DOX-induced cardiotoxicity and its underlying mechanisms. Cellular viability was tested by 3-[-4,5-dimethylthiazol-2-yl]-2,5-diphenyltetrazolium bromide (MTT) and protein level was evaluated by Western blotting. 5,5’,6,6’-tetrachloro-1,1’,3,3’-tetraethylbenzimidazolylcarbocyanine iodide (JC-1) staining was performed to determine the mitochondrial membrane potential (MMP). Hoechst 33342 staining and TUNEL staining was performed to test the apoptosis. Reactive oxygen species (ROS) generation was investigated by using flow cytometry. DB significantly inhibited DOX-induced apoptosis in H9c2 cells and primary cultured cardiomyocytes. Moreover, DB decreased cell apoptotic morphological changes and reversed the mitochondrial membrane potential induced by DOX. Meanwhile, pre-treatment with DB increased the expression levels of B-cell lymphoma 2 (Bcl-2), B-cell lymphoma-extra-large (Bcl-xl), and survivin and reduced the expression levels of Bcl-2-associated X protein (Bax), p-p53, cytochrome c (cyt c), and cleaved-caspase 3, 7, 8, 9 in the protein levels in DOX-treated H9c2 cells. Furthermore, DB suppressed ROS generation. The DB-mediated protective effects were accompanied by increased c-Jun N-terminal kinase1/2 (JNK1/2) expression. In addition, SP600125, the inhibitor of JNK1/2, abolished the protective effect of DB. We concluded that DB protected cardiomyocytes against DOX-induced cytotoxicity by inhibiting ROS and activating the JNK1/2 pathway. Therefore, DB is a promising candidate as a cardioprotective agent against DOX-induced cardiotoxicity. Full article
(This article belongs to the Special Issue Free Radicals and Oxidants in Pathogenesis)
Show Figures

Graphical abstract

Graphical abstract
Full article ">Figure 1
<p>Diethyl blechnic (DB) protects cells from doxorubicin (DOX)-induced cell death. (<b>A</b>) The chemical structure of DB; (<b>B</b>,<b>C</b>) DB inhibits DOX-induced viability loss (<span class="html-italic">n</span> = 6). (<b>B</b>) H9c2 cells (<b>C</b>) primary cardiomyocytes were treated with DOX (1 μM) for 24 h with and without DB pre-treatment, and the surviving cells were analyzed using MTT assay; (<b>D</b>) Effect of DB on the apoptotic index in H9c2 cells after DOX insult. Apoptotic cell death was detected with Annexin V staining by using flow cytometry. Data represent the mean ± SD (<span class="html-italic">n</span> = 3) and were analyzed by ANOVA. * <span class="html-italic">p</span> &lt; 0.05, ** <span class="html-italic">p</span> &lt; 0.01, *** <span class="html-italic">p</span> &lt; 0.001 for each group versus DOX without DB.</p>
Full article ">Figure 2
<p>The reversal of DOX-induced apoptosis by DB. (<b>A</b>) Nuclear staining of H9c2 cells with Hoechst 33324. Cells pre-treated with DB for 2 h and then co-treated with DOX (1 μM) for 24 h, the internucleosomal DNA fragmentation was examined using Hoechst 33342. The arrow indicates the cells with the typical characteristics of apoptosis. Bar = 40 µm; (<b>B</b>) H9c2 cells were pre-treated without or with DB for 2 h, followed by incubation with 1 μM DOX for another 24 h. mitochondrial membrane potential (MMP) was monitored by determining the relative amounts of mitochondrial JC-1 monomers using a fluorescent microscope. Bar = 40 µm; (<b>C</b>,<b>D</b>) Effect of DB on the TUNEL staining index in H9c2 cells after DOX insult. Apoptotic cell death was detected with TUNEL staining by using flow cytometry. Data represent the mean ± SD (<span class="html-italic">n</span> = 3) and were analyzed by ANOVA. *** <span class="html-italic">p</span> &lt; 0.001 for each group versus DOX without DB.</p>
Full article ">Figure 2 Cont.
<p>The reversal of DOX-induced apoptosis by DB. (<b>A</b>) Nuclear staining of H9c2 cells with Hoechst 33324. Cells pre-treated with DB for 2 h and then co-treated with DOX (1 μM) for 24 h, the internucleosomal DNA fragmentation was examined using Hoechst 33342. The arrow indicates the cells with the typical characteristics of apoptosis. Bar = 40 µm; (<b>B</b>) H9c2 cells were pre-treated without or with DB for 2 h, followed by incubation with 1 μM DOX for another 24 h. mitochondrial membrane potential (MMP) was monitored by determining the relative amounts of mitochondrial JC-1 monomers using a fluorescent microscope. Bar = 40 µm; (<b>C</b>,<b>D</b>) Effect of DB on the TUNEL staining index in H9c2 cells after DOX insult. Apoptotic cell death was detected with TUNEL staining by using flow cytometry. Data represent the mean ± SD (<span class="html-italic">n</span> = 3) and were analyzed by ANOVA. *** <span class="html-italic">p</span> &lt; 0.001 for each group versus DOX without DB.</p>
Full article ">Figure 3
<p>The preventive effect of DB on DOX-modulated Bcl-2 expression. (<b>A</b>) DB regulated the protein levels of Bcl-2, Bcl-xl and Bax induced by DOX; (<b>B</b>) DB mediated the expression levels of DOX-induced p53, Cyt c and survivin. Cells were pre-treated with DB for 2 h and then co-treated with DOX for 24 h, and the protein level were assessed by using Western blot analysis; (<b>C</b>,<b>D</b>) Semi-quantitative analysis of protein level. Beta-actin (<span class="html-italic">β</span>-actin) served as the loading control. # <span class="html-italic">p</span> &lt; 0.05, ## <span class="html-italic">p</span> &lt; 0.01, ### <span class="html-italic">p</span> &lt; 0.001 versus control and * <span class="html-italic">p</span> &lt; 0.05, ** <span class="html-italic">p</span> &lt; 0.01, *** <span class="html-italic">p</span> &lt; 0.001 versus DOX.</p>
Full article ">Figure 4
<p>The inhibitory effect of DB on caspase activity induced by DOX. (<b>A</b>) DB regulated the expression of cleaved caspase (cl-caspase) 3 induced by DOX; (<b>C</b>) DB reversed the expression levels of cl-caspase 7, 8 and 9 induced by DOX. Cells were pre-treated with DB for 2 h and then co-treated with DOX for 24 h and the protein expression levels were followed assessed by Western blot analysis. <span class="html-italic">β</span>-actin served as the loading control; (<b>D</b>) DB decreased the caspase-3/7 activity induced by DOX. Cells were pre-treated with DB for 2 h and co-treated with DOX for 24 h followed by caspase 3/7 activity assay. * <span class="html-italic">p</span> &lt; 0.05 versus DOX without DB; (<b>B</b>,<b>E</b>) Semi-quantitative analysis of Western blot analysis results. # <span class="html-italic">p</span> &lt; 0.05, ## <span class="html-italic">p</span> &lt; 0.01, ### <span class="html-italic">p</span> &lt; 0.001 versus control and * <span class="html-italic">p</span> &lt; 0.05, ** <span class="html-italic">p</span> &lt; 0.01, *** <span class="html-italic">p</span> &lt; 0.001 versus DOX. cl = cleaved.</p>
Full article ">Figure 5
<p>(<b>A</b>) The inhibitory effects of DB on intracellular ROS generation induced by DOX. H9c2 cells were pre-treated without or with DB for 2 h, followed by incubation with 1 μM DOX for another 24 h. ROS generation was assayed by DCFH<sub>2</sub>-DA oxidation-based fluorescence using a flow cytometry. (<b>B</b>) ROS levels are expressed in terms of relative intensity of cell fluorescence. * <span class="html-italic">p</span> &lt; 0.05, ** <span class="html-italic">p</span> &lt; 0.01, compared with DOX alone treated group.</p>
Full article ">Figure 6
<p>Effects of JNK 1/2 signaling pathway on the protective effect of DB against DOX-induced toxicity in H9c2 cells. (<b>A</b>) DOX-induced ERK 1/2, JNK 1/2, and p38 activation in a time-dependent manner. Cells were treated with DOX (1 μM) at different time points, and were analyzed by Western blot; (<b>B</b>) Effects of DB on the expression levels of p-ERK 1/2, p-JNK 1/2 and p-p38 in H9c2 cells. Cells were pre-treated with DB for 2 h and then treated with DOX for another 24 h prior to western blot analysis; (<b>C</b>) MAPK signaling pathway inhibitors on the protective effect of DB against DOX-induced toxicity in H9c2 cells. Cells were pre-treated with or without U0126, PD98059, SB203580 or SP600125, and DOX treatment was conducted for 24h. Afterward, cell viability was determined by MTT assay. NS means not significant, *** <span class="html-italic">p</span> &lt; 0.001; (<b>D</b>) SP600125 inhibited DB-induced JNK 1/2 activation. Cells were pre-treated with SP600125 (20 μM) for 1 h, and then treated with DB for 24 h prior to western blot analysis. Glyceraldehyde-3-phosphate dehydrogenase (GADPH) served as the loading control; (<b>E</b>,<b>F</b>) Semi-quantitative analysis of Western blot. ### <span class="html-italic">p</span> &lt; 0.001 versus control and * <span class="html-italic">p</span> &lt; 0.05, ** <span class="html-italic">p</span> &lt; 0.01, *** <span class="html-italic">p</span> &lt; 0.001 versus DOX.</p>
Full article ">
25 pages, 3259 KiB  
Article
Co-Expression Network Analysis of AMPK and Autophagy Gene Products during Adipocyte Differentiation
by Mahmoud Ahmed, Jin Seok Hwang, Trang Huyen Lai, Sahib Zada, Huynh Quoc Nguyen, Trang Min Pham, Miyong Yun and Deok Ryong Kim
Int. J. Mol. Sci. 2018, 19(6), 1808; https://doi.org/10.3390/ijms19061808 - 19 Jun 2018
Cited by 8 | Viewed by 6033
Abstract
Autophagy is involved in the development and differentiation of many cell types. It is essential for the pre-adipocytes to respond to the differentiation stimuli and may contribute to reorganizing the intracellulum to adapt the morphological and metabolic demands. Although AMPK, an energy sensor, [...] Read more.
Autophagy is involved in the development and differentiation of many cell types. It is essential for the pre-adipocytes to respond to the differentiation stimuli and may contribute to reorganizing the intracellulum to adapt the morphological and metabolic demands. Although AMPK, an energy sensor, has been associated with autophagy in several cellular processes, how it connects to autophagy during the adipocyte differentiation remains to be investigated. Here, we studied the interaction between AMPK and autophagy gene products at the mRNA level during adipocyte differentiation using public-access datasets. We used the weighted-gene co-expression analysis to detect and validate multiple interconnected modules of co-expressed genes in a dataset of MDI-induced 3T3-L1 pre-adipocytes. These modules were found to be highly correlated with the differentiation course of the adipocytes. Several novel interactions between AMPK and autophagy gene products were identified. Together, it is possible that AMPK-autophagy interaction is temporally and locally modulated in response to the differentiation stimuli. Full article
(This article belongs to the Special Issue AMP-Activated Protein Kinase Signalling)
Show Figures

Graphical abstract

Graphical abstract
Full article ">Figure 1
<p>Clustering of AMPK and autophagy genes by their pairwise distances. Pairwise topological overlap matrix (TOM) similarities of AMPK and autophagy genes (<span class="html-italic">n</span> = 181) were calculated from their expression values in the GSE34150 dataset. Distances between each pair of genes were derived as 1 - TOM and shown as color values (small, red or large, yellow). A hierarchal tree and colored segments of the clusters were shown on the top and side.</p>
Full article ">Figure 2
<p>Correlations and over-representation of the detected modules in differentiation stages. The expression values of the members of the detected modules in the GSE34150 dataset (42, blue; 10, gray; and 66, turquoise) were used to calculate two representative summary statistics. (<b>A</b>) the first principal component (PC) across samples were correlated to the sample stages using Pearson’s correlation (bars); (<b>B</b>) the fraction of differentially expressed (DE) genes across differentiation stages (bars).</p>
Full article ">Figure 3
<p>Network representation of the AMPK and autophagy modules. Members of the blue (<b>A</b>) and turquoise (<b>B</b>) modules are shown as a nodes. Each pair of nodes is connected by an edge if the corresponding pairwise topological overlap matrix (TOM) similarity/weight is above the threshold 0.1. Nodes are colored by gene category (AMPK, green or autophagy, gray). Edges are colored by type of interaction (STRING, red or Novel, gray).</p>
Full article ">Figure 4
<p>Enrichment of the gene ontology terms by the detected modules. The list of genes in the two detected modules (42, blue and 66, turquoise) were used to test for gene ontology terms enrichment. All terms in the Molecular Function (MF) and the Cellular component (CC) categories of the gene ontology were considered. Only significant terms at a false discovery rate (FDR) less than 0.1 are shown. For each term, the count (<span class="html-italic">n</span>) and the fractions of hits (bars) in the module are shown.</p>
Full article ">Figure 5
<p>Average expression of AMPK and autophagy in multiple MDI-induced 3T3-L1 microarrays datasets. The log average expression values of AMPK and autophagy genes (<span class="html-italic">n</span> = 181) in the MDI-induced 3T3-L1 datasets (GSE15018, GSE20696 and GSE69313) are compared to the corresponding averages in the main dataset (GSE34150). Individual values are shown as colored points by their assigned modules. The Pearson’s correlation coefficient of the corresponding values is shown on top.</p>
Full article ">Figure 6
<p>Module preservation <span class="html-italic">Z</span> summary across multiple MDI-induced 3T3-L1 microarrays datasets. The GSE34150 dataset was used to detect the highly co-expressed modules among AMPK and autophagy genes (42, blue; 66, turquoise; 10, gray, unassigned; and 55, gold , randomly assigned). The detected modules were used as a reference to calculate several preservation statistics in three independent datasets of similar design (GSE15018, GSE20696 and GSE69313). <span class="html-italic">Z</span> summary statistics and sizes of four modules are shown as colored points.</p>
Full article ">Figure 7
<p>Validation of selected gene products expression and co-expression with AMPK subunits. Three independent samples of MDI-induced 3T3-L1 cells at four different time points corresponding to confluent, undifferentiated, differentiating and maturating stages were used to check the mRNA level of several gene products. (<b>A</b>,<b>B</b>) the <math display="inline"><semantics> <mrow> <mo>Δ</mo> <mo>Δ</mo> <msub> <mi>C</mi> <mi>t</mi> </msub> </mrow> </semantics></math> values of five and four gene products, respectively, normalized by 18S and relative to the confluent cell stage are shown as points; (<b>C</b>,<b>D</b>) the Pearson’s coefficient of four and three gene products with Prkab1 and Prkag1, respectively, are shown as bars.</p>
Full article ">Figure A1
<p>Average expression of all probes in multiple MDI-induced 3T3-L1 microarrays datasets. The log average expression values of all probes in the MDI-induced 3T3-L1 datasets (GSE15018, GSE20696 and GSE69313) are compared to the corresponding averages in the main dataset (GSE34150). Individual values are shown as points. The Pearson’s correlation coefficient of the corresponding values is shown on top.</p>
Full article ">Figure A2
<p>Quality assessment and exploration of the main microarrays dataset. Twenty-four samples of MDI-treated 3T3-L1 cells of the microarray series (GSE34150) were obtained from GEO along with the corresponding annotation data (GPL6885); (<b>A</b>) the distribution of the log expression of (<span class="html-italic">n</span> = 25,697) probes from all samples as box plots; (<b>B</b>) hierarchical clustering based on the euclidean distances of all samples; (<b>C</b>) multi-dimensional scaling (MDS) of all samples. Colors represent the cell stage/time point (green, undifferentiated; dark green, differentiating and red, maturating).</p>
Full article ">Figure A3
<p>Differentiation and lipogensis markers in differentiating adipocytes. Average log expression values from 24 samples of MDI-induced 3T3-L1 cells (GSE34150) at 3 differentiation stages and 8 time points (0 day, undifferentiated (red); 2 and 4 days, differentiating (green); 6–18 days, maturating (blue)) from (<b>A</b>) differentiation markers and (<b>B</b>) lipogenesis markers are shown as bars and lines, respectively. <span class="html-italic">Cebpa</span>, CCAAT/enhancer binding protein (C/EBP), alpha; <span class="html-italic">Lpl</span>, lipoprotein lipase; <span class="html-italic">Pparg</span>, peroxisome proliferator activated receptor gamma; <span class="html-italic">Acly</span>, ATP Citrate Lyase; <span class="html-italic">Dgat</span>, Diacylglycerol <span class="html-italic">O</span>-Acyltransferase; <span class="html-italic">Elov6</span>, Fatty Acid Elongase 6; <span class="html-italic">Fasn</span>, Fatty Acid Synthase; <span class="html-italic">Scd</span>, Stearoyl-CoA Desaturase.</p>
Full article ">Figure A4
<p>Scale free topology for multiple power values. Expression data from 24 samples (GSE34150) MDI-induced 3T3-L1 at different time points were used to calculate an (<span class="html-italic">n</span> × <span class="html-italic">n</span>) similarity matrix (<span class="html-italic">n</span> = 181 genes), which were used to obtain the weighed networks by raising them to multiple power values. For each value, a scale free topology index was calculated. (<b>A</b>) the fit indices, the slopes multiplied by the <span class="html-italic">R</span> squared <math display="inline"><semantics> <msup> <mi>R</mi> <mn>2</mn> </msup> </semantics></math> values, are shown for each power value as points; (<b>B</b>) the mean connectivity, average edges shared by a node, for the resultant network at each power value are shown as points. Red lines represent the choice of power that satisfy both high <span class="html-italic">R</span> squared <math display="inline"><semantics> <msup> <mi>R</mi> <mn>2</mn> </msup> </semantics></math> values and high connectivity.</p>
Full article ">Figure A5
<p>Gene similarity and node centrality measures. (<b>A</b>) the cumulative distribution function (CDF) of three correlation/similarity measures of AMPK and autophagy genes (<span class="html-italic">n</span> = 181) are shown as colored lines (green, Pearson’s correlation coefficients; red, adjacency; and blue, TOM); (<b>B</b>) three centrality measures for all nodes in the two detected modules are as points. The degree centrality on the <span class="html-italic">x</span>-axis, the betweenness centrality on the <span class="html-italic">y</span>-axis and the hub score as the point size.</p>
Full article ">Figure A6
<p>Module preservation ranks across multiple MDI-induced 3T3-L1 microarrays datasets. The GSE34150 dataset was used to detect the highly co-expressed modules among AMPK and autophagy genes (42, blue; 66, turquoise; 10, gray, unassigned; and 55, gold, randomly assigned). The detected modules were used as a reference to calculate several preservation statistics in three independent datasets of similar design (GSE15018, GSE20696 and GSE69313). The median ranks of the preservation statistics and the sizes of four modules are shown as colored points.</p>
Full article ">Figure A7
<p>Workflow of the study.</p>
Full article ">
21 pages, 4835 KiB  
Article
Collagen as Coating Material for 45S5 Bioactive Glass-Based Scaffolds for Bone Tissue Engineering
by Jasmin Hum and Aldo R. Boccaccini
Int. J. Mol. Sci. 2018, 19(6), 1807; https://doi.org/10.3390/ijms19061807 - 19 Jun 2018
Cited by 54 | Viewed by 8395
Abstract
Highly porous 45S5 bioactive glass-based scaffolds were fabricated by the foam replica technique and coated with collagen by a novel method. After an initial cleaning step of the bioactive glass surface to expose reactive –OH groups, samples were surface functionalized by (3-aminopropyl)triethoxysilane (APTS). [...] Read more.
Highly porous 45S5 bioactive glass-based scaffolds were fabricated by the foam replica technique and coated with collagen by a novel method. After an initial cleaning step of the bioactive glass surface to expose reactive –OH groups, samples were surface functionalized by (3-aminopropyl)triethoxysilane (APTS). Functionalized scaffolds were immersed in a collagen solution, left for gelling at 37 °C, and dried at room temperature. The collagen coating was further stabilized by crosslinking with 1-ethyl-3-(3-dimethylaminopropyl)carbodiimide (EDC) and N-hydroxysuccinimide (NHS). Applying this coating method, a layer thickness of a few micrometers was obtained without affecting the overall scaffold macroporosity. In addition, values of compressive strength were enhanced by a factor of five, increasing from 0.04 ± 0.02 MPa for uncoated scaffolds to 0.18 ± 0.03 MPa for crosslinked collagen-coated scaffolds. The composite material developed in this study exhibited positive cell (MG-63) viability as well as suitable cell attachment and proliferation on the surface. The combination of bioactivity, mechanical competence, and cellular response makes this novel scaffold system attractive for bone tissue engineering. Full article
(This article belongs to the Special Issue Novel Biomaterials for Tissue Engineering 2018)
Show Figures

Figure 1

Figure 1
<p>SEM images of as-fabricated bioactive glass-based scaffolds after sintering, at lower (<b>A</b>) and higher (<b>B</b>) magnifications. The hollow nature of the struts can be clearly seen (<b>C</b>) and can be attributed to the burn-out of the sacrificial polyurethane (PU) foam.</p>
Full article ">Figure 2
<p>SEM images of uncrosslinked, collagen-coated bioactive glass-based scaffolds. The fibrous collagen layer can be clearly seen (<b>B</b>). After the coating process, the overall macroporosity of the scaffold is not affected (<b>A</b>). The collagen layer exhibits a thickness of a few micrometers (<b>C</b>). At the interface ((<b>D</b>–<b>F</b>), different magnifications), the rough bioactive glass surface can be clearly distinguished from the fibrous collagen layer.</p>
Full article ">Figure 3
<p>XPS spectra of 45S5 bioactive glass (BG) surfaces before and after the silanization process in acetone +2 vol % APTS for 1 h.</p>
Full article ">Figure 4
<p>FTIR spectra of 45S5 BG-based scaffolds and collagen-coated 45S5 BG-based scaffolds before and after crosslinking. Relevant peaks are discussed in the text.</p>
Full article ">Figure 5
<p>Mass loss of uncrosslinked and crosslinked collagen on 45S5 BG-based scaffolds during TGA.</p>
Full article ">Figure 6
<p>SEM images of as-fabricated 45S5 BG-based samples after immersion in simulated body fluid (SBF) for 1, 3, and 7 days (at different magnifications).</p>
Full article ">Figure 7
<p>FTIR spectra of as-fabricated 45S5 BG-based samples after 0, 1, 3, 7, and 10 days of immersion in SBF. Relevant peaks are discussed in the text.</p>
Full article ">Figure 8
<p>SEM images of collagen (Coll)-coated 45S5 BG-based scaffolds (cl) after immersion in SBF for 1, 3, 7, and 10 days (at different magnifications). The formation of a mineralized collagen layer can be observed.</p>
Full article ">Figure 9
<p>FTIR spectra of collagen-coated 45S5 BG-based scaffolds (crosslinked) after 0, 1, 3, 7, and 10 days of immersion in SBF. Relevant peaks are discussed in the text.</p>
Full article ">Figure 10
<p>Cumulative collagen release from different types of 45S5 BG-based scaffolds in PBS.</p>
Full article ">Figure 11
<p>Cumulative collagen release from different types of 45S5 BG-based scaffolds in SBF.</p>
Full article ">Figure 12
<p>Collagen release kinetics of collagen-coated 45S5 BG-based scaffolds in PBS (<b>left</b>) and SBF (<b>right</b>) before and after crosslinking.</p>
Full article ">Figure 13
<p>Exemplary stress-displacement curves for 45S5 BG-based scaffolds with and without collagen coating.</p>
Full article ">Figure 14
<p>Cell viability of MG-63 cells of different scaffold types (absorbance at 450 nm) after 7, 14, and 21 days. Significance levels: * <span class="html-italic">p</span> &lt; 0.05, ** <span class="html-italic">p</span> &lt; 0.01 (Bonferroni’s post-hoc test was used).</p>
Full article ">Figure 15
<p>Relative proliferation of MG-63 cells on different scaffold types (absorbance at 450 nm) after 7, 14, and 21 days. Significance level: *** <span class="html-italic">p</span> &lt; 0.001 (Bonferroni’s post-hoc test was used).</p>
Full article ">Figure 16
<p>SEM images of seeded MG-63 cells on different types of scaffolds for 7, 14, and 21 days (at different magnifications).</p>
Full article ">Figure 17
<p>Surface functionalization of 45S5 bioactive glass-based scaffolds with APTS divided into (<b>I</b>) hydrolysis, (<b>II</b>) condensation reaction, (<b>III</b>) hydrogen bonding, and (<b>IV</b>) bond formation [<a href="#B50-ijms-19-01807" class="html-bibr">50</a>,<a href="#B54-ijms-19-01807" class="html-bibr">54</a>,<a href="#B55-ijms-19-01807" class="html-bibr">55</a>,<a href="#B56-ijms-19-01807" class="html-bibr">56</a>].</p>
Full article ">
21 pages, 6664 KiB  
Article
5-Azacitidine Induces Cell Death in a Tissue Culture of Brachypodium distachyon
by Alexander Betekhtin, Anna Milewska-Hendel, Lukasz Chajec, Magdalena Rojek, Katarzyna Nowak, Jolanta Kwasniewska, Elzbieta Wolny, Ewa Kurczynska and Robert Hasterok
Int. J. Mol. Sci. 2018, 19(6), 1806; https://doi.org/10.3390/ijms19061806 - 19 Jun 2018
Cited by 19 | Viewed by 5823
Abstract
Morphological and histological observations revealed that, at a concentration of 50 µM, 5-azacitidine (5-azaC) totally inhibited the induction of embryogenic masses (EM), while the cultivation of explants (zygotic embryos; ZEs) in the presence of 5 µM of 5-azaC led to the formation of [...] Read more.
Morphological and histological observations revealed that, at a concentration of 50 µM, 5-azacitidine (5-azaC) totally inhibited the induction of embryogenic masses (EM), while the cultivation of explants (zygotic embryos; ZEs) in the presence of 5 µM of 5-azaC led to the formation of a callus with EM in 10% of the cases. Transmission electron microscopy (TEM) analyzes revealed the presence of the morphological and ultrastructural features that are typical for the vacuolar type of cell death in the callus cells that were treated. A TUNEL assay confirmed the presence of DNA double-strand breaks for the callus cells that had been treated with both 5 and 50 µM 5-azaC concentrations. Analysis of the gene expression of selected cell death markers demonstrated a reduced expression of metacaspase, protein executer 1 (EX1), and thioredoxin (TRX) in the callus cells that had been treated compared to the control culture. The strongest increase in the gene activity was characteristic for glutathione S-transferase (GST). Our studies also included an analysis of the distribution of some arabinogalactan proteins (AGPs) and extensin epitopes, which can be used as markers of cells that are undergoing death in a Brachypodium distachyon tissue culture. Full article
(This article belongs to the Section Molecular Plant Sciences)
Show Figures

Graphical abstract

Graphical abstract
Full article ">Figure 1
<p>Morphology (<b>a</b>–<b>c</b>) and histology (<b>d</b>–<b>f</b>) of the Brachypodium callus. (<b>a</b>,<b>d</b>) Control callus; (<b>b</b>,<b>e</b>) callus that has been treated with 5 µM of 5-azaC, (inset figure on (<b>e</b>) demonstrated embryogenic masses (EM)) and (<b>c</b>,<b>f</b>) callus that has been treated with 50 µM of 5-azaC (black arrows: EM; white arrows; parenchymatous cells: PC; cells of an explant: EX). (<b>g</b>) frequency of ZEs which gave calli with EM on the 21st day of cultivation. Scale bars, (<b>a</b>–<b>c</b>) 200 µm; (<b>d</b>) 20 µm; (<b>e</b>,<b>f</b>) = 100 µm.</p>
Full article ">Figure 2
<p>Callus cell ultrastructure in the control (<b>a</b>,<b>b</b>) and in the callus that has been treated with 5 µM (<b>c</b>–<b>f</b>) and 50 µM (<b>g</b>–<b>m</b>) of 5-azaC. CW: cell wall; ER: endoplasmic reticulum; M: mitochondria; N: nucleus; NU: nucleolus; P: plastid; P*: plastid with an altered ultrastructure; PM: plasma membrane; RER: rough endoplasmic reticulum; S: starch; T: tonoplast; V: vacuole; arrows: dictyosomes of Golgi apparatus; double arrow: plastoglobules; asterisks: tonoplast breakdown. Scale bars, 1 µm.</p>
Full article ">Figure 3
<p>In situ detection of DNA fragmentation in the Brachypodium callus cells on the 14th day of the culture using the TUNEL assay. Blue fluorescence: DAPI staining (<b>a</b>–<b>e</b>), green fluorescence: FITC marking TUNEL-positive nuclei (<b>a`</b>–<b>e`</b>). (<b>a</b>,<b>a`</b>) control callus; (<b>b</b>,<b>b`</b>) negative control in TUNEL reaction; (<b>c</b>,<b>c`</b>) positive control in TUNEL reaction; (<b>d</b>,<b>d`</b>) callus that has been treated with 5 μM of 5-azaC; (<b>e</b>,<b>e`</b>) callus that has been treated with 50 μM of 5-azaC. Scale bars, 50 µm.</p>
Full article ">Figure 4
<p>Relative expression levels of the selected PCD-related genes (<b>a</b>), in the explants that were cultivated on the CIM medium supplemented with 5 and 50 μM of 5-azaC (<b>b</b>). Relative expression levels were normalized to an internal control (AK437296, gene encoding for ubiquitin) and calibrated to the control culture (CIM medium with no 5-azaC). *: value is significantly different from the control culture (<span class="html-italic">p</span> &lt; 0.05; <span class="html-italic">n</span> = 3 ± SD), Δ: value is significantly different from the 5 μM of 5-azaC-treated culture (<span class="html-italic">p</span> &lt; 0.05; <span class="html-italic">n</span> = 3 ± SD).</p>
Full article ">Figure 5
<p>Immunolocalization of JIM8 in the Brachypodium callus. (<b>a</b>–<b>a”</b>): control callus; (<b>b</b>–<b>b”</b>,<b>c</b>–<b>c”</b>): callus that has been treated with 5 µM of 5-azaC. (<b>d</b>–<b>d”</b>,<b>e</b>–<b>e”</b>): callus that has been treated with 50 µM of 5-azaC. (<b>d”</b>): red arrows demonstrate the detachment of the plasmalemma from the cell wall. Scale bars, 10 µm.</p>
Full article ">Figure 6
<p>Immunolocalization of JIM13 in the Brachypodium callus. (<b>a</b>–<b>a”</b>): control callus. (<b>b</b>–<b>b”</b>,<b>c</b>–<b>c”</b>): callus that has been treated with 5 µM of 5-azaC. (<b>d</b>–<b>d”</b>,<b>e</b>–<b>e”</b>): callus that has been treated with 50 µM of 5-azaC. The cells with a total absence of the signals are indicated by red arrows. Scale bars, 10 µm.</p>
Full article ">Figure 7
<p>Immunolocalization of LM1 in the Brachypodium callus. (<b>a</b>–<b>a”</b>): control callus. (<b>b</b>–<b>b”</b>): callus that has been treated with 5 µM of 5-azaC. (<b>c</b>–<b>c”</b>,<b>d</b>–<b>d”</b>): callus that has been treated with 50 µM of 5-azaC. The greenish background on these photomicrographs is due to the autofluorescence. Scale bars, 10 µm.</p>
Full article ">Figure 8
<p>Immunolocalization of JIM11 in the Brachypodium callus. (<b>a</b>–<b>a”</b>): control callus. (<b>b</b>–<b>b”</b>,<b>c</b>–<b>c”</b>): callus that has been treated with 5 µM of 5-azaC. (<b>d</b>–<b>d”</b>,<b>e</b>–<b>e”</b>): callus that has been treated with 50 µM of 5-azaC. The greenish background on these photomicrographs is due to the autofluorescence. Scale bars, 10 µm.</p>
Full article ">Figure 9
<p>Immunolocalization of JIM12 in the Brachypodium callus. (<b>a</b>–<b>a”</b>): control callus. (<b>b</b>–<b>b”</b>): callus that has been treated with 5 µM of 5-azaC. (<b>c</b>–<b>c”</b>) callus that has been treated with 50 µM of 5-azaC. The greenish background on these photomicrographs is due to the autofluorescence. Scale bars, 10 µm.</p>
Full article ">Figure A1
<p>Histological sections of the Brachypodium callus stained with a 0.05% (<span class="html-italic">w</span>/<span class="html-italic">v</span>) toluidine blue O. (<b>a</b>–<b>c</b>): control callus; (<b>d</b>–<b>f</b>): callus that has been treated with 5 µM of 5-azaC. (<b>g</b>–<b>i</b>): callus that has been treated with 50 µM of 5-azaC. Scale bars, 10 µm.</p>
Full article ">
17 pages, 2320 KiB  
Article
Inter-Individual Variability in Acute Toxicity of R-Pulegone and R-Menthofuran in Human Liver Slices and Their Influence on miRNA Expression Changes in Comparison to Acetaminophen
by Tomáš Zárybnický, Petra Matoušková, Bibiána Lancošová, Zdeněk Šubrt, Lenka Skálová and Iva Boušová
Int. J. Mol. Sci. 2018, 19(6), 1805; https://doi.org/10.3390/ijms19061805 - 19 Jun 2018
Cited by 18 | Viewed by 4792
Abstract
Monoterpenes R-pulegone (PUL) and R-menthofuran (MF), abundant in the Lamiaceae family, are frequently used in herb and food products. Although their hepatotoxicity was shown in rodent species, information about their effects in human liver has been limited. The aim of our study was [...] Read more.
Monoterpenes R-pulegone (PUL) and R-menthofuran (MF), abundant in the Lamiaceae family, are frequently used in herb and food products. Although their hepatotoxicity was shown in rodent species, information about their effects in human liver has been limited. The aim of our study was to test the effects of PUL, MF and acetaminophen (APAP, as a reference compound) on cell viability and microRNA (miRNA) expression in human precision-cut liver slices. Slices from five patients were used to follow up on the inter-individual variability. PUL was toxic in all liver samples (the half-maximal effective concentration was 4.0 µg/mg of tissue), while MF and surprisingly APAP only in two and three liver samples, respectively. PUL also changed miRNA expression more significantly than MF and APAP. The most pronounced effect was a marked decrease of miR-155-5p expression caused by PUL even in non-toxic concentrations in all five liver samples. Our results showed that PUL is much more toxic than MF and APAP in human liver and that miR-155-5p could be a good marker of PUL early hepatotoxicity. Marked inter-individual variabilities in all our results demonstrate the high probability of significant differences in the hepatotoxicity of tested compounds among people. Full article
(This article belongs to the Special Issue Hepatotoxicity: Molecular Mechanisms and Pathophysiology)
Show Figures

Graphical abstract

Graphical abstract
Full article ">Figure 1
<p>Structural formulas of studied monoterpenes and a reference compound acetaminophen.</p>
Full article ">Figure 2
<p>Inter-individual differences in the effect of R-pulegone, R-menthofuran and acetaminophen on viability of PCLS from five patients (1–5) after 24 h (<span class="html-italic">n</span> = 3), determined by ATP content. Results are presented as the mean ± SD. Statistical analyses were performed using one-way ANOVA with Dunnett’s test: <span class="html-italic">p</span> &lt; 0.05 (*); <span class="html-italic">p</span> &lt; 0.001 (**); <span class="html-italic">p</span> &lt; 0.0001 (***).</p>
Full article ">Figure 3
<p>Non-linear regression of the effect of PUL and MF on the viability of PCLS and half-maximal effective concentration (EC<sub>50</sub>) calculation. Data represent the mean ± SD from PCLS of five liver samples (PUL) and two samples (MF) showing a significant viability decrease after the treatment.</p>
Full article ">Figure 4
<p>Inter-individual variability in constitutive expression of selected miRNAs in PCLS from five patients. The horizontal line represents the median, and whiskers represent the maximum and minimum values.</p>
Full article ">Figure 5
<p>The effect of PUL, MF and APAP on the normalized expression of selected miRNAs. The normalized expression level was calculated using the 2<sup>−ΔΔ<span class="html-italic">C</span>t</sup> method with miR-93-5p as a reference gene. Results are presented as the mean ± SD. Statistical analyses were performed using one-way ANOVA with Dunnett’s test: <span class="html-italic">p</span> &lt; 0.05 (*); <span class="html-italic">p</span> &lt; 0.001 (**); <span class="html-italic">p</span> &lt; 0.0001 (***).</p>
Full article ">Figure 5 Cont.
<p>The effect of PUL, MF and APAP on the normalized expression of selected miRNAs. The normalized expression level was calculated using the 2<sup>−ΔΔ<span class="html-italic">C</span>t</sup> method with miR-93-5p as a reference gene. Results are presented as the mean ± SD. Statistical analyses were performed using one-way ANOVA with Dunnett’s test: <span class="html-italic">p</span> &lt; 0.05 (*); <span class="html-italic">p</span> &lt; 0.001 (**); <span class="html-italic">p</span> &lt; 0.0001 (***).</p>
Full article ">
20 pages, 1415 KiB  
Review
The Type 3 Deiodinase: Epigenetic Control of Brain Thyroid Hormone Action and Neurological Function
by Arturo Hernandez and J. Patrizia Stohn
Int. J. Mol. Sci. 2018, 19(6), 1804; https://doi.org/10.3390/ijms19061804 - 19 Jun 2018
Cited by 31 | Viewed by 10189
Abstract
Thyroid hormones (THs) influence multiple processes in the developing and adult central nervous system, and their local availability needs to be maintained at levels that are tailored to the requirements of their biological targets. The local complement of TH transporters, deiodinase enzymes, and [...] Read more.
Thyroid hormones (THs) influence multiple processes in the developing and adult central nervous system, and their local availability needs to be maintained at levels that are tailored to the requirements of their biological targets. The local complement of TH transporters, deiodinase enzymes, and receptors is critical to ensure specific levels of TH action in neural cells. The type 3 iodothyronine deiodinase (DIO3) inactivates THs and is highly present in the developing and adult brain, where it limits their availability and action. DIO3 deficiency in mice results in a host of neurodevelopmental and behavioral abnormalities, demonstrating the deleterious effects of TH excess, and revealing the critical role of DIO3 in the regulation of TH action in the brain. The fact the Dio3 is an imprinted gene and that its allelic expression pattern varies across brain regions and during development introduces an additional level of control to deliver specific levels of hormone action in the central nervous system (CNS). The sensitive epigenetic nature of the mechanisms controlling the genomic imprinting of Dio3 renders brain TH action particularly susceptible to disruption due to exogenous treatments and environmental exposures, with potential implications for the etiology of human neurodevelopmental disorders. Full article
(This article belongs to the Special Issue Epigenetics of Neurodevelopmental Disorders)
Show Figures

Graphical abstract

Graphical abstract
Full article ">Figure 1
<p>Mechanisms of thyroid hormone action in the brain and its biological effects. DIO2 and DIO3, type 2, and type 3 deiodinase, respectively. T3, triiodothyroinine; T2, diiodothyronine; T4, thyroxine.</p>
Full article ">Figure 2
<p>Neurological consequences of DIO3 deficiency in mice. The lack of DIO3 function prevents degradation of THs, increasing their availability and molecular action in the brain (red lines and arrows). Increased T3 action in the brain (grey arrow) leads to multiple neurological phenotypes (black arrows). TR, thyroid receptor; DIO2, type 2 deiodinase.</p>
Full article ">Figure 3
<p>Genomic imprinting of <span class="html-italic">Dio3</span> in the brain. (<b>a</b>) Simplified diagram of the mouse <span class="html-italic">Dlk1-Dio3</span> imprinted domain showing the dominant pattern of allele-specific gene expression. An arbitrary number of pin point shapes indicate loci exhibiting allele-specific methylation (open circles, unmethylated; closed circles, methylated); (<b>b</b>) Brain variability in the percentage allelic contribution to <span class="html-italic">Dio3</span> expression and associated IG-DMR methylation compared to fetal <span class="html-italic">Dio3</span>. Some brain regions exhibit relaxed or absent <span class="html-italic">Dio3</span> imprinting despite unchanged IG-DMR methylation status [<a href="#B37-ijms-19-01804" class="html-bibr">37</a>]. (Data is approximate and based on parent-of-origin inheritance of the DIO3 mutation. Allelic contributions may add more than 100%, as the wild type allele may exhibit T3-dependent up-regulation upon loss of DIO3 function in the other allele).</p>
Full article ">Figure 4
<p>Environmental factors and <span class="html-italic">Dio3</span> imprinting. Environmental factors may influence <span class="html-italic">Dio3</span> imprinting and expression, with consequences for TH action in the brain in affected (grey arrows) and future generations (dotted red arrow).</p>
Full article ">
14 pages, 1127 KiB  
Review
STAT3 in Tumor-Associated Myeloid Cells: Multitasking to Disrupt Immunity
by Yu-Lin Su, Shuvomoy Banerjee, Seok Voon White and Marcin Kortylewski
Int. J. Mol. Sci. 2018, 19(6), 1803; https://doi.org/10.3390/ijms19061803 - 19 Jun 2018
Cited by 81 | Viewed by 8335
Abstract
Myeloid immune cells, such as dendritic cells, monocytes, and macrophages, play a central role in the generation of immune responses and thus are often either disabled or even hijacked by tumors. These new tolerogenic activities of tumor-associated myeloid cells are controlled by an [...] Read more.
Myeloid immune cells, such as dendritic cells, monocytes, and macrophages, play a central role in the generation of immune responses and thus are often either disabled or even hijacked by tumors. These new tolerogenic activities of tumor-associated myeloid cells are controlled by an oncogenic transcription factor, signal transducer and activator of transcription 3 (STAT3). STAT3 multitasks to ensure tumors escape immune detection by impairing antigen presentation and reducing production of immunostimulatory molecules while augmenting the release of tolerogenic mediators, thereby reducing innate and adaptive antitumor immunity. Tumor-associated myeloid cells and STAT3 signaling in this compartment are now commonly recognized as an attractive cellular target for improving efficacy of standard therapies and immunotherapies. Hereby, we review the importance and functional complexity of STAT3 signaling in this immune cell compartment as well as potential strategies for cancer therapy. Full article
(This article belongs to the Special Issue Advances in Biological Functions of STAT3)
Show Figures

Figure 1

Figure 1
<p>Effects of the tumor microenvironment on myeloid cell differentiation and metabolism. The black arrows indicate the developmental pathway of myeloid cell differentiation. In the presence of tumor-derived factors, the normal developmental pathways to mature DCs, M1 macrophages, or neutrophils are deregulated as indicate by red crosses. These processes result in the accumulation of immature DCs, tumor-associated macrophages, and undifferentiated polymorphonuclear (PMN)- and monocytic(M)-MDSCs. The red and blue arrows indicate up- or down-regulated key molecules and metabolic profiles, the question marks indicate those remain unknown.</p>
Full article ">Figure 2
<p>STAT3 orchestrates the immunosuppressive activity of tumor-associated myeloid cells. As indicated by black arrows, persistent activation of STAT3 in myeloid cells in the tumor microenvironment regulates in a positive (red arrows) or negative (blue arrows) manner a number of effector molecules involved in cellular metabolism as well as immunosuppression. The blocked expression of MHC-II, CD80 and CD86 were indicated by red crosses. Some of these mechanisms are common, while others are specific to different myeloid cell subtypes, as indicated in the figure description.</p>
Full article ">
17 pages, 2358 KiB  
Article
Structure–Activity Relationship of Piplartine and Synthetic Analogues against Schistosoma mansoni and Cytotoxicity to Mammalian Cells
by Yuri Campelo, Alicia Ombredane, Andreanne G. Vasconcelos, Lucas Albuquerque, Daniel C. Moreira, Alexandra Plácido, Jefferson Rocha, Harold Hilarion Fokoue, Lydia Yamaguchi, Ana Mafud, Yvonne P. Mascarenhas, Cristina Delerue-Matos, Tatiana Borges, Graziella A. Joanitti, Daniel D.R. Arcanjo, Massuo J. Kato, Selma A. S. Kuckelhaus, Marcos P. N. Silva, Josué De Moraes and José Roberto S. A. Leite
Int. J. Mol. Sci. 2018, 19(6), 1802; https://doi.org/10.3390/ijms19061802 - 19 Jun 2018
Cited by 13 | Viewed by 4971
Abstract
Schistosomiasis, caused by helminth flatworms of the genus Schistosoma, is an infectious disease mainly associated with poverty that affects millions of people worldwide. Since treatment for this disease relies only on the use of praziquantel, there is an urgent need to identify [...] Read more.
Schistosomiasis, caused by helminth flatworms of the genus Schistosoma, is an infectious disease mainly associated with poverty that affects millions of people worldwide. Since treatment for this disease relies only on the use of praziquantel, there is an urgent need to identify new antischistosomal drugs. Piplartine is an amide alkaloid found in several Piper species (Piperaceae) that exhibits antischistosomal properties. The aim of this study was to evaluate the structure–function relationship between piplartine and its five synthetic analogues (19A, 1G, 1M, 14B and 6B) against Schistosoma mansoni adult worms, as well as its cytotoxicity to mammalian cells using murine fibroblast (NIH-3T3) and BALB/cN macrophage (J774A.1) cell lines. In addition, density functional theory calculations and in silico analysis were used to predict physicochemical and toxicity parameters. Bioassays revealed that piplartine is active against S. mansoni at low concentrations (5–10 µM), but its analogues did not. In contrast, based on 3-(4,5-dimethylthiazol-2-yl)-2,5-diphenyltetrazolium bromide (MTT) and flow cytometry assays, piplartine exhibited toxicity in mammalian cells at 785 µM, while its analogues 19A and 6B did not reduce cell viability at the same concentrations. This study demonstrated that piplartine analogues showed less activity against S. mansoni but presented lower toxicity than piplartine. Full article
(This article belongs to the Section Biochemistry)
Show Figures

Figure 1

Figure 1
<p>Electron density: (<b>a</b>) piplartine; (<b>b</b>) 19A; (<b>c</b>) 1G; (<b>d</b>) 14B; (<b>e</b>) 6B and (<b>f</b>) 1M. The colours represent negative (red) and positive (blue). The dipole moments of all compounds in debye values are as follows: piplartine: 5.4728337; 1G: 1.9658996; 1M: 4.4568136; 6B: 4.0062111; 14B: 3.9403826; 19A: 3.7385640.</p>
Full article ">Figure 2
<p>Ultraviolet and visible light absorption spectra of piplartine and its analogues in arbitrary units (A.U.).</p>
Full article ">Figure 3
<p>Cytotoxicity evaluation using the MTT method in murine fibroblast (NIH3T3) cells after exposure for 24 h to piplartine analogues (<b>A</b>) 19A (72–2331 μM), (<b>B</b>) 6B (62–1998 μM), (<b>C</b>) 1G (85–2738 μM), (<b>D</b>) 1M (56–1796 μM), (<b>E</b>) 14B (101–3250 μM) and (<b>F</b>) piplartine (78–2514 μM). Molecules were used at the same concentrations range at μg/mL for all samples (25–800). Dimethyl sulfoxide (DMSO) was used as a negative control. The values are expressed as mean ± SEM. * <span class="html-italic">p</span> &lt; 0.05 vs. DMSO control group. The dotted lines mark the 100% viability level.</p>
Full article ">Figure 4
<p>Cytotoxicity evaluation in the mouse BALB/cN macrophage (J774A.1) cell line following exposure for 24 h to piplartine analogues (<b>A</b>) 19A (72, 291 and 1165 μM), (<b>B</b>) 6B (62, 249 and 999 μM), (<b>C</b>) 1G (85, 342 and 1369 μM), (<b>D</b>) 1M (56, 224 and 898 μM), (<b>E</b>) 14B (101, 406 and 1625 μM) and (<b>F</b>) piplartine (78, 314 and 1257 μM). Molecules were used at the same concentrations range at μg/mL for all samples (25, 100 and 400). Dulbecco’s Modified Eagle Medium (DMEM) was used as a negative control. Cells were analysed by flow cytometry (20,000 events/sample). The values are expressed as mean ± SEM. * <span class="html-italic">p &lt;</span> 0.05 and **** <span class="html-italic">p &lt;</span> 0.0001 vs. DMEM control group.</p>
Full article ">Figure 5
<p>Evaluation of the cell death mechanism mediated by (<b>A</b>) piplartine (78, 314 and 1257 μM) and its analogues (<b>B</b>) 1G (85, 342 and 1369 μM), (<b>C</b>) 1M (56, 224 and 898 μM), (<b>D</b>) 6B (62, 249 and 999 μM), (<b>E</b>) 14B (101, 406 and 1625 μM) and (<b>F</b>) 19A (72, 291 and 1165 μM) in J774A.1 cells following treatment for 24 h at the same concentrations range at μg/mL for all samples (25, 100 and 400) using annexin-V FITC (apoptosis marker) and propidium iodide (PI, necrosis marker) staining. Cells were analysed by flow cytometry (20,000 events/sample). The values are expressed as mean ± SEM. * <span class="html-italic">p</span> &lt; 0.05 vs. DMEM untreated control group. # <span class="html-italic">p &lt;</span> 0.05 vs. apoptosis staining from each respective group.</p>
Full article ">
15 pages, 666 KiB  
Review
Role of Human Macrophage Polarization in Inflammation during Infectious Diseases
by Chiraz Atri, Fatma Z. Guerfali and Dhafer Laouini
Int. J. Mol. Sci. 2018, 19(6), 1801; https://doi.org/10.3390/ijms19061801 - 19 Jun 2018
Cited by 911 | Viewed by 35119
Abstract
Experimental models have often been at the origin of immunological paradigms such as the M1/M2 dichotomy following macrophage polarization. However, this clear dichotomy in animal models is not as obvious in humans, and the separating line between M1-like and M2-like macrophages is rather [...] Read more.
Experimental models have often been at the origin of immunological paradigms such as the M1/M2 dichotomy following macrophage polarization. However, this clear dichotomy in animal models is not as obvious in humans, and the separating line between M1-like and M2-like macrophages is rather represented by a continuum, where boundaries are still unclear. Indeed, human infectious diseases, are characterized by either a back and forth or often a mixed profile between the pro-inflammatory microenvironment (dominated by interleukin (IL)-1β, IL-6, IL-12, IL-23 and Tumor Necrosis Factor (TNF)-α cytokines) and tissue injury driven by classically activated macrophages (M1-like) and wound healing driven by alternatively activated macrophages (M2-like) in an anti-inflammatory environment (dominated by IL-10, Transforming growth factor (TGF)-β, chemokine ligand (CCL)1, CCL2, CCL17, CCL18, and CCL22). This review brews the complexity of the situation during infectious diseases by stressing on this continuum between M1-like and M2-like extremes. We first discuss the basic biology of macrophage polarization, function, and role in the inflammatory process and its resolution. Secondly, we discuss the relevance of the macrophage polarization continuum during infectious and neglected diseases, and the possibility to interfere with such activation states as a promising therapeutic strategy in the treatment of such diseases. Full article
(This article belongs to the Special Issue Macrophages in Inflammation)
Show Figures

Graphical abstract

Graphical abstract
Full article ">Figure 1
<p>Summary of the main macrophage polarization states of activated macrophages. Different stimuli and signaling pathways have been described as inducers of M1-like or M2-like activation states, of which the most widely referenced ones are summarized here. M1-like or M2-like polarization has been reported in humans as being related to distinct defensive or healing schemas. Many roles have been ascribed to these polarization status, of which pro- and anti-inflammatory macrophage potentiation has for a long time been classically associated to the M1-like/M2-like-like dichotomy. LPS: lipopolysaccharide; MR: mannose receptor; TNF: tumor necrosis factor; IFNg: interferon gamma; IL: interleukin; MCP: monocyte chemoattractant protein; TGF: transforming growth factor; MCSF: macrophage colony stimulating-factor; ROS: reactive oxygen species; iNOS: inducible nitric oxide synthase; MHC: major histocompatibility complex.</p>
Full article ">Figure 2
<p>Macrophage polarization status observed in post-kala-azar dermal leishmaniasis (PKDL) patients during acute disease and after treatment. <span class="html-italic">Leishmania</span> infection in humans has been studied in PKDL patients, in which features of M2-like polarization have been observed in both lesion sites and peripheral blood. M2-like polarization is characterized by the increased mRNA and/or protein expression of specific M2-like markers such as the nuclear peroxisome proliferator activated receptor γ (PPARγ), the arginase-1 receptor, and the membrane mannose receptor CD206/mannose receptor (MR). After treatment, disease resolution is characterized by an M1-like profile repolarization, evidenced by the decreased expression of M2-like markers.</p>
Full article ">
15 pages, 2793 KiB  
Article
MK-0677, a Ghrelin Agonist, Alleviates Amyloid Beta-Related Pathology in 5XFAD Mice, an Animal Model of Alzheimer’s Disease
by Yu-on Jeong, Soo Jung Shin, Jun Yong Park, Bo Kyeong Ku, Ji Soo Song, Jwa-Jin Kim, Seong Gak Jeon, Sang Min Lee and Minho Moon
Int. J. Mol. Sci. 2018, 19(6), 1800; https://doi.org/10.3390/ijms19061800 - 18 Jun 2018
Cited by 30 | Viewed by 10402
Abstract
Alzheimer’s disease (AD) is a progressive neurodegenerative disorder characterized by cognitive deficits, neuroinflammation, and neuronal death. The primary pathogenic cause is believed to be the accumulation of pathogenic amyloid beta (Aβ) assemblies in the brain. Ghrelin, which is a peptide hormone predominantly secreted [...] Read more.
Alzheimer’s disease (AD) is a progressive neurodegenerative disorder characterized by cognitive deficits, neuroinflammation, and neuronal death. The primary pathogenic cause is believed to be the accumulation of pathogenic amyloid beta (Aβ) assemblies in the brain. Ghrelin, which is a peptide hormone predominantly secreted from the stomach, is an endogenous ligand for the growth hormone secretagogue-receptor type 1a (GHS-R1a). MK-0677 is a ghrelin agonist that potently stimulates the GHS-R1a ghrelin receptor. Interestingly, previous studies have shown that ghrelin improves cognitive impairments and attenuates neuronal death and neuroinflammation in several neurological disorders. However, it is unknown whether MK-0677 can affect Aβ accumulation or Aβ-mediated pathology in the brains of patients with AD. Therefore, we examined the effects of MK-0677 administration on AD-related pathology in 5XFAD mice, an Aβ-overexpressing transgenic mouse model of AD. MK-0677 was intraperitoneally administered to three-month-old 5XFAD mice. To visualize Aβ accumulation, neuroinflammation, and neurodegeneration, thioflavin-S staining and immunostaining with antibodies against Aβ (4G8), ionized calcium-binding adaptor molecule 1 (Iba-1), glial fibrillary acidic protein (GFAP), neuronal nuclear antigen (NeuN), and synaptophysin were conducted in the neocortex of 5XFAD and wild-type mice, and to evaluate changes of phosphorylated cyclic adenosine monophosphate (cAMP) response element binding protein (pCREB) levels, immunostaining with antibody against pCREB was performed in dentate gyrus of the hippocampus of 5XFAD and wild-type mice. The histological analyses indicated that MK-0677-treated 5XFAD mice showed reduced Aβ deposition, gliosis, and neuronal and synaptic loss in the deep cortical layers, and inhibited the decrement of pCREB levels in dentate gyrus of the hippocampus compared to vehicle-treated 5XFAD mice. Our results showed that activation of the ghrelin receptor with MK-0677 inhibited the Aβ burden, neuroinflammation, and neurodegeneration, which suggested that MK-0677 might have potential as a treatment of the early phase of AD. Full article
(This article belongs to the Special Issue Amyloid Fibrils and Methods for Their Study)
Show Figures

Graphical abstract

Graphical abstract
Full article ">Figure 1
<p>Cumulative food intake and change in body weight after the administration of MK-0677 in C57BL/6 mice and 5XFAD mice. MK-0677 was administered daily to C57BL/6 mice (<span class="html-italic">n</span> = 5) at doses of 0.1, 1, and 3 mg/kg for 10 days and to 5XFAD mice at doses of 5 mg/kg for three weeks. The group injected with MK-0677 exhibited a significant increase in cumulative food intake compared with the control group. Compared with the control group, the significant difference indicators are as follows: 0.1 mg/kg group (<sup>†</sup> <span class="html-italic">p</span> &lt; 0.05), 1 mg/kg group (<sup>‡</sup> <span class="html-italic">p</span> &lt; 0.001), and 3 mg/kg group (* <span class="html-italic">p</span> &lt; 0.05 and ** <span class="html-italic">p</span> &lt; 0.01) (<b>A</b>). The body weight changes for 10 days were also significantly increased in the group receiving MK-0677 (** <span class="html-italic">p</span> &lt; 0.01 and *** <span class="html-italic">p</span> &lt; 0.001 indicate significant differences compared to control group) (<b>B</b>). MK-0677-treated 5XFAD mice (<span class="html-italic">n</span> = 8) showed tendency to the increase of cumulative food intake induced compared with vehicle-treated 5XFAD mice (<span class="html-italic">n</span> = 8) (<b>C</b>). The body weight changes among wild-type mice (<span class="html-italic">n</span> = 8), vehicle- and, MK-0677-treated 5XFAD mice were not significantly different (<b>D</b>).</p>
Full article ">Figure 2
<p>MK-0677 treatment significantly reduced Aβ plaques in the deep cortical layers of 5XFAD mice. The burden of Aβ was estimated by thoflavin-S staining and immunohistochemical staining for the 4G8 antibody. 5XFAD mice treated with MK-0677 (<span class="html-italic">n</span> = 6) showed a decreased positive area (%) in both thioflavin-S (<b>A</b>) and 4G8 (<b>B</b>)-stained brains, compared with vehicle-treated 5XFAD mice (<span class="html-italic">n</span> = 7). *** <span class="html-italic">p</span> &lt; 0.001 indicates significant differences between the groups. Scale bar = 50 μm.</p>
Full article ">Figure 3
<p>MK-0677-treated 5XFAD mice exhibited a significant reduction in neurodegeneration compared with the vehicle group. Immunofluorescent staining was performed to detect the markers of neuronal cells (NeuN) and pre-synaptic terminals (SYN) in layer V of the frontal cortex of wild-type (<span class="html-italic">n</span> = 8) and 5XFAD mice. MK-0677 significantly ameliorated the reduction of the number of NeuN (+) cells (<b>A</b>) and optical density of SYN (+) area (<b>B</b>) in 5XFAD mice (<span class="html-italic">n</span> = 6), compared with vehicle-treated 5XFAD mice (<span class="html-italic">n</span> = 7). *** <span class="html-italic">p</span> &lt; 0.001 indicates significant differences between the groups. Scale bars are 50 μm in the upper panel and 25 μm in the lower panel.</p>
Full article ">Figure 4
<p>MK-0677-treated 5XFAD mice exhibited significant inhibition of neuroinflammation compared with vehicle-administered mice. Immunofluorescent staining was performed to detect the markers of microglia (Iba-1) and astrocyte (GFAP) in layer V of the frontal cortex of wild-type (<span class="html-italic">n</span> = 8) and 5XFAD mice. MK-0677 significantly reduced the Iba-1 (+) area (<b>A</b>) and GFAP (+) area (<b>B</b>) in 5XFAD mice (<span class="html-italic">n</span> = 6), compared with vehicle-treated 5XFAD mice (<span class="html-italic">n</span> = 7). *** <span class="html-italic">p</span> &lt; 0.001 indicates significant differences between the groups. Scale bar = 50 μm.</p>
Full article ">Figure 5
<p>MK-0677 treatment significantly improved the reduced phosphorylation of CREB in 5XFAD mice. Immunofluorescent staining was performed to detect the phosphorylation form of CREB (pCREB) in dentate gyrus of the hippocampus of wild-type (<span class="html-italic">n</span> = 8) and 5XFAD mice. MK-0677-treated 5XFAD mice (<span class="html-italic">n</span> = 6) showed significantly increased pCREB, compared with vehicle-treated 5XFAD mice (<span class="html-italic">n</span> = 7). * <span class="html-italic">p</span> &lt; 0.05 and *** <span class="html-italic">p</span> &lt; 0.001 indicate significant differences between the groups. Scale bar = 50 μm. CREB = cyclic adenosine monophosphate (cAMP) response element binding protein.</p>
Full article ">
16 pages, 4737 KiB  
Article
STIM1 Knockout Enhances PDGF-Mediated Ca2+ Signaling through Upregulation of the PDGFR–PLCγ–STIM2 Cascade
by Tzu-Yu Huang, Yi-Hsin Lin, Heng-Ai Chang, Tzu-Ying Yeh, Ya-Han Chang, Yi-Fan Chen, Ying-Chi Chen, Chun-Chun Li and Wen-Tai Chiu
Int. J. Mol. Sci. 2018, 19(6), 1799; https://doi.org/10.3390/ijms19061799 - 18 Jun 2018
Cited by 11 | Viewed by 5074
Abstract
Platelet-derived growth factor (PDGF) has mitogenic and chemotactic effects on fibroblasts. An increase in intracellular Ca2+ is one of the first events that occurs following the stimulation of PDGF receptors (PDGFRs). PDGF activates Ca2+ elevation by activating the phospholipase C gamma [...] Read more.
Platelet-derived growth factor (PDGF) has mitogenic and chemotactic effects on fibroblasts. An increase in intracellular Ca2+ is one of the first events that occurs following the stimulation of PDGF receptors (PDGFRs). PDGF activates Ca2+ elevation by activating the phospholipase C gamma (PLCγ)-signaling pathway, resulting in ER Ca2+ release. Store-operated Ca2+ entry (SOCE) is the major form of extracellular Ca2+ influx following depletion of ER Ca2+ stores and stromal interaction molecule 1 (STIM1) is a key molecule in the regulation of SOCE. In this study, wild-type and STIM1 knockout mouse embryonic fibroblasts (MEF) cells were used to investigate the role of STIM1 in PDGF-induced Ca2+ oscillation and its functions in MEF cells. The unexpected findings suggest that STIM1 knockout enhances PDGFR–PLCγ–STIM2 signaling, which in turn increases PDGF-BB-induced Ca2+ elevation. Enhanced expressions of PDGFRs and PLCγ in STIM1 knockout cells induce Ca2+ release from the ER store through PLCγ–IP3 signaling. Moreover, STIM2 replaces STIM1 to act as the major ER Ca2+ sensor in activating SOCE. However, activation of PDGFRs also activate Akt, ERK, and JNK to regulate cellular functions, such as cell migration. These results suggest that alternative switchable pathways can be observed in cells, which act downstream of the growth factors that regulate Ca2+ signaling. Full article
(This article belongs to the Special Issue Calcium Signaling in Human Health and Diseases)
Show Figures

Graphical abstract

Graphical abstract
Full article ">Figure 1
<p>Thapsigargin (TG)-mediated store-operated Ca<sup>2+</sup> entry (SOCE) is suppressed in mouse embryonic fibroblast-STIM1 knockout (MEF-STIM1<sup>−/−</sup>) cells. (<b>A</b>,<b>D</b>) Representative tracings show the effect of 2 μM TG (arrow) on Fura-2/AM loaded MEF-WT (wild-type) and MEF-STIM1<sup>−/−</sup> cells (<b>A</b>) in absence of extracellular Ca<sup>2+</sup> followed by addition of 2 mM Ca<sup>2+</sup> to the extracellular buffer or (<b>D</b>) at 2 mM extracellular Ca<sup>2+</sup>. Intracellular Ca<sup>2+</sup> ([Ca<sup>2+</sup>]<sub>i</sub>) was monitored using a single-cell fluorimeter for 15 min. Each trace represents the mean of at least four independent experiments. The bar charts show (<b>B</b>) ER Ca<sup>2+</sup> release, (<b>C</b>) SOCE, (<b>E</b>) initial Ca<sup>2+</sup> peak (change of peak value), and (<b>F</b>) total Ca<sup>2+</sup> elevation (area under the curve) following the addition of TG. Bars represent mean ± SEM. *** <span class="html-italic">p</span> &lt; 0.001 by Student’s <span class="html-italic">t</span>-test. TG, thapsigargin; a.u., arbitrary unit.</p>
Full article ">Figure 2
<p>PDGF-BB induces Ca<sup>2+</sup> elevation in MEF-STIM1<sup>−/−</sup> cells but not in MEF-WT cells. Representative tracings showing the effect of PDGF-BB (0–200 ng/mL, arrowhead) in Fura-2/AM-loaded, serum-starved (<b>A</b>) MEF-WT, (<b>C</b>) MEF-STIM1<sup>−/−</sup> cells at 2 mM extracellular Ca<sup>2+</sup>, and (<b>E</b>) MEF-STIM1<sup>−/−</sup> cells in the absence of extracellular Ca<sup>2+</sup> followed by addition of 2 mM Ca<sup>2+</sup> to the extracellular buffer. Intracellular Ca<sup>2+</sup> ([Ca<sup>2+</sup>]<sub>i</sub>) was monitored using a single-cell fluorimeter for 15 min. (<b>B</b>,<b>D</b>,<b>F</b>,<b>G</b>) Bar charts indicate (<b>B</b>) initial Ca<sup>2+</sup> peak of MEF-WT and (<b>D</b>) initial Ca<sup>2+</sup> peak, (<b>F</b>) ER Ca<sup>2+</sup> release, and (<b>G</b>) SOCE of MEF-STIM1<sup>−/−</sup> cells following the addition of PDGF-BB. Bars represent mean ± SEM. *,#: <span class="html-italic">p</span> &lt; 0.05; **,##: <span class="html-italic">p</span> &lt; 0.01; ***,###: <span class="html-italic">p</span> &lt; 0.001 by one-way ANOVA with Dunnett’s post-hoc test.</p>
Full article ">Figure 3
<p>STIM1 knockout enhances the expression of PDGFRα and PDGFRβ, and increases phosphorylation of phospholipase C gamma (PLCγ) and cAMP response element binding protein (CREB). (<b>A</b>) MEF-WT and MEF-STIM1<sup>−/−</sup> cells were starved in a serum-free medium for 12 h and then stimulated with 100 ng/mL PDGF-BB for 3, 5, and 10 min. Immunoblotting analysis using antibodies against STIM1, PDGFRα, phospho-PDGFRβ (pPDGFRβ), PDGFRβ, phospho-PLCγ (pPLCγ), PLCγ, phospho-CREB (CREB), and CREB. β-actin served as the internal control; (<b>B</b>–<b>D</b>) Measurement of the relative intensities of protein phosphorylation are represented as mean ± SEM from three independent experiments for both MEF-WT and MEF-STIM1<sup>−/−</sup> cells. Bar charts show phosphorylation levels of (<b>B</b>) pPDGFRβ, (<b>C</b>) pPLCγ, and (<b>D</b>) pCREB, which were normalized to the total protein. *,#: <span class="html-italic">p</span> &lt; 0.05; **,##: <span class="html-italic">p</span> &lt; 0.01; ***: <span class="html-italic">p</span> &lt; 0.001 by Student’s <span class="html-italic">t</span>-test; (<b>E</b>) Knockdown of STIM2 or overexpression of STIM1 upon transient transfection with STIM2 siRNA (siSTIM2) and mOrange-tagged STIM1 plasmid (mOrange-STIM1) for 48 h in MEF-STIM1<sup>−/−</sup> cells, respectively. Cells were starved in a serum-free medium for 12 h and then stimulated with or without 100 ng/mL PDGF-BB for 5 min. Immunoblotting analysis using antibodies against STIM1, STIM2, PDGFRα, phospho-PDGFRβ, and PDGFRβ. β-actin served as the internal control. The MEF-WT cells were used as a control for MEF-STIM1<sup>−/−</sup> cells. Arrows indicate the target proteins.</p>
Full article ">Figure 4
<p>STIM1 knockout increases phosphorylation of Akt, JNK, and ERK but not STAT3 under PDGF-BB stimulation. (<b>A</b>) MEF-WT and MEF-STIM1<sup>−/−</sup> cells were starved in a serum-free medium for 12 h and then stimulated with 100 ng/mL PDGF-BB for 3, 5, and 10 min. Immunoblotting analysis using antibodies against phospho-Akt (pAkt), Akt, phospho-JNK (pJNK), JNK, phospho-ERK (pERK), ERK, phospho-STAT3 (pSTAT3), and STAT3. β-actin served as the internal control; (<b>B</b>–<b>D</b>) Measurement of the relative intensities of protein phosphorylation are represented as mean ± SEM from three independent experiments for both MEF-WT and MEF-STIM1<sup>−/−</sup> cells. Bar charts show the phosphorylation levels of (<b>B</b>) pAkt, (<b>C</b>) pJNK, and (<b>D</b>) pERK, which were normalized to the total protein. *,#: <span class="html-italic">p</span> &lt; 0.05; **,##: <span class="html-italic">p</span> &lt; 0.01 by Student’s <span class="html-italic">t</span>-test.</p>
Full article ">Figure 5
<p>PDGF-BB induces STIM2 puncta formation and translocation in MEF-STIM1<sup>−/−</sup> cells. (<b>A</b>) STIM1, STIM2, Orai1, Orai2, Orai3 and transient receptor potential canonical 1 (TRPC1) were detected using immunoblotting in both MEF-WT and MEF-STIM1<sup>−/−</sup> cells. β-actin served as the internal control; (<b>B</b>,<b>C</b>) MEF-WT and MEF-STIM1<sup>−/−</sup> cells were starved in a serum-free medium and then stimulated with 100 ng/mL PDGF-BB for 3, 5, and 10 min. Then, cells were processed for immunofluorescence staining using (<b>B</b>) anti-STIM1 or (<b>C</b>) anti-STIM2 antibody, followed by adding a secondary antibody coupled to Alexa Fluor<sup>®</sup> 594 dye and Hoechst 33342 (blue) was used as the nuclear marker. Fluorescence images were captured using a laser scanning confocal microscope. Yellow arrowheads indicate plasma membrane translocation of the STIM2 protein. Scale bars = 20 μm.</p>
Full article ">Figure 6
<p>PDGF-BB induces STIM2 activation in MEF-STIM1<sup>−/−</sup> cells. (<b>A</b>) MEF-WT (WT) and MEF-STIM1<sup>−/−</sup> (STIM1<sup>−/−</sup>) cells were starved in a serum-free medium and then stimulated with 100 ng/mL PDGF-BB for 3, 5, and 10 min. Then, cells were processed for immunofluorescence staining using anti-STIM2 antibody, followed by adding a secondary antibody coupled to Alexa Fluor<sup>®</sup> 488 dye. Fluorescence images were captured using a laser scanning confocal microscope. Yellow stars indicate cells with activated STIM2, presented as puncta formation and plasma membrane translocation. Scale bars = 20 μm; (<b>B</b>) Quantitative analysis of PDGF-BB-induced STIM2 activation that was assessed from the STIM2 plasma membrane translocated cells from three independent experiments. Bars represent mean ± SEM. *: <span class="html-italic">p</span> &lt; 0.05; ***,###: <span class="html-italic">p</span> &lt; 0.001 by Student’s <span class="html-italic">t</span>-test; (<b>C</b>) MEF-STIM1<sup>−/−</sup> cells were starved in a serum-free medium and then stimulated with 100 ng/mL PDGF-BB for 5 min. Then, cells were processed for immunofluorescence staining using an anti-STIM2 antibody, followed by adding a secondary antibody coupled to Alexa Fluor<sup>®</sup> 488 dye. Fluorescence images were captured using a total internal reflection fluorescence microscope or laser scanning confocal microscope. Blue dashed lines indicate the periphery of cells. Scale bars = 20 μm; (<b>D</b>) Quantitative analysis of PDGF-BB-induced aggregation of STIM2 puncta from three independent experiments (<span class="html-italic">n</span> &gt; 30 cells). Bars represent mean ± SEM. **: <span class="html-italic">p</span> &lt; 0.01 by Student’s <span class="html-italic">t</span>-test.</p>
Full article ">Figure 6 Cont.
<p>PDGF-BB induces STIM2 activation in MEF-STIM1<sup>−/−</sup> cells. (<b>A</b>) MEF-WT (WT) and MEF-STIM1<sup>−/−</sup> (STIM1<sup>−/−</sup>) cells were starved in a serum-free medium and then stimulated with 100 ng/mL PDGF-BB for 3, 5, and 10 min. Then, cells were processed for immunofluorescence staining using anti-STIM2 antibody, followed by adding a secondary antibody coupled to Alexa Fluor<sup>®</sup> 488 dye. Fluorescence images were captured using a laser scanning confocal microscope. Yellow stars indicate cells with activated STIM2, presented as puncta formation and plasma membrane translocation. Scale bars = 20 μm; (<b>B</b>) Quantitative analysis of PDGF-BB-induced STIM2 activation that was assessed from the STIM2 plasma membrane translocated cells from three independent experiments. Bars represent mean ± SEM. *: <span class="html-italic">p</span> &lt; 0.05; ***,###: <span class="html-italic">p</span> &lt; 0.001 by Student’s <span class="html-italic">t</span>-test; (<b>C</b>) MEF-STIM1<sup>−/−</sup> cells were starved in a serum-free medium and then stimulated with 100 ng/mL PDGF-BB for 5 min. Then, cells were processed for immunofluorescence staining using an anti-STIM2 antibody, followed by adding a secondary antibody coupled to Alexa Fluor<sup>®</sup> 488 dye. Fluorescence images were captured using a total internal reflection fluorescence microscope or laser scanning confocal microscope. Blue dashed lines indicate the periphery of cells. Scale bars = 20 μm; (<b>D</b>) Quantitative analysis of PDGF-BB-induced aggregation of STIM2 puncta from three independent experiments (<span class="html-italic">n</span> &gt; 30 cells). Bars represent mean ± SEM. **: <span class="html-italic">p</span> &lt; 0.01 by Student’s <span class="html-italic">t</span>-test.</p>
Full article ">Figure 7
<p>Dose-response inhibition of PDGF-BB-mediated Ca<sup>2+</sup> elevation by the Ca<sup>2+</sup> mobilization inhibitors. MEF-STIM1<sup>−/−</sup> cells were starved in a serum-free medium and then loaded with Fura-2/AM and co-treated with (<b>A</b>,<b>F</b>) 0–40 μM 2-APB, (<b>B</b>,<b>G</b>) 0–50 μM SKF96365, (<b>C</b>,<b>H</b>) 0–20 μM YM58483, (<b>D</b>,<b>I</b>) 0–200 ng/mL La<sup>3+</sup>, and (<b>E</b>,<b>J</b>) 0–200 ng/mL Gd<sup>3+</sup> for 30 min. Cells were then stimulated with 100 ng/mL PDGF-BB at 2 mM extracellular Ca<sup>2+</sup>. Intracellular Ca<sup>2+</sup> ([Ca<sup>2+</sup>]<sub>i</sub>) was monitored using a single-cell fluorimeter for 15 min for at least three independent experiments. The bar charts show (<b>A</b>–<b>E</b>) initial Ca<sup>2+</sup> peak and (<b>F</b>,<b>J</b>) total Ca<sup>2+</sup> elevation following the addition of PDGF-BB. Bars represent mean ± SEM. *,#: <span class="html-italic">p</span> &lt; 0.05; **,##: <span class="html-italic">p</span> &lt; 0.01; ***,###: <span class="html-italic">p</span> &lt; 0.001 by one-way ANOVA with Dunnett’s post-hoc test.</p>
Full article ">Figure 8
<p>PDGF-BB induces cell migration in MEF-STIM1<sup>−/−</sup> cells. (<b>A</b>) MEF-WT and MEF-STIM1<sup>−/−</sup> cells were seeded into silicon inserts with 0.5% fecal bovine serum (FBS) medium. Following cell adhesion, inserts were removed, followed by the addition of Dulbecco’s modified Eagle’s medium (DMEM) with 0.1% FBS + PDGF-BB (100 ng/mL) for 24 h. Phase images were captured using inverted phase-contrast microscopy and wound spaces were analyzed using ImageJ; (<b>B</b>) Comparison of the effects of PDGF-BB-induced wound closure following insert removal in MEF-WT and MEF-STIM1<sup>−/−</sup> cells. Cellular migratory ability is presented as the percentages of wound closure. Bars represent mean ± SEM. ***: <span class="html-italic">p</span> &lt; 0.001 by Student’s <span class="html-italic">t</span>-test. Scale bars = 200 μm.</p>
Full article ">
18 pages, 3795 KiB  
Article
Regulation and Function of TMEM16F in Renal Podocytes
by Laura K. Schenk, Jiraporn Ousingsawat, Boris V. Skryabin, Rainer Schreiber, Hermann Pavenstädt and Karl Kunzelmann
Int. J. Mol. Sci. 2018, 19(6), 1798; https://doi.org/10.3390/ijms19061798 - 18 Jun 2018
Cited by 5 | Viewed by 4983
Abstract
The Ca2+-activated phospholipid scramblase and ion channel TMEM16F is expressed in podocytes of renal glomeruli. Podocytes are specialized cells that form interdigitating foot processes as an essential component of the glomerular filter. These cells, which participate in generation of the primary [...] Read more.
The Ca2+-activated phospholipid scramblase and ion channel TMEM16F is expressed in podocytes of renal glomeruli. Podocytes are specialized cells that form interdigitating foot processes as an essential component of the glomerular filter. These cells, which participate in generation of the primary urine, are often affected during primary glomerular diseases, such as glomerulonephritis and secondary hypertensive or diabetic nephropathy, which always leads to proteinuria. Because the function of podocytes is known to be controlled by intracellular Ca2+ signaling, it is important to know about the role of Ca2+-activated TMEM16F in these cells. To that end, we generated an inducible TMEM16F knockdown in the podocyte cell line AB8, and produced a conditional mouse model with knockout of TMEM16F in podocytes and renal epithelial cells of the nephron. We found that knockdown of TMEM16F did not produce proteinuria or any obvious phenotypic changes. Knockdown of TMEM16F affected cell death of tubular epithelial cells but not of glomerular podocytes when analyzed in TUNEL assays. Surprisingly, and in contrast to other cell types, TMEM16F did not control intracellular Ca2+ signaling and was not responsible for Ca2+-activated whole cell currents in podocytes. TMEM16F levels in podocytes were enhanced after inhibition of the endolysosomal pathway and after treatment with angiotensin II. Renal knockout of TMEM16F did not compromise renal morphology and serum electrolytes. Taken together, in contrast to other cell types, such as platelets, bone cells, and immune cells, TMEM16F shows little effect on basal properties of podocytes and does not appear to be essential for renal function. Full article
(This article belongs to the Special Issue Ion Transporters and Channels in Physiology and Pathophysiology)
Show Figures

Figure 1

Figure 1
<p>Expression of TMEM16F in human and mouse glomeruli. (<b>A</b>) Immunohistochemistry of cortical sections of an adult human kidney showing TMEM16F (green) and the podocyte marker nephrin (red). Cell nuclei are marked by DAPI (blue). Podocytes seem to express TMEM16F in plasma membrane and cytoplasm. Scale bar 10 µm. (<b>B</b>) Immunohistochemistry of a cortical kidney section of an adult mouse showing TMEM16F (green) and the podocyte marker nephrin (red). TMEM16F does not colocalize with nephrin in foot processes but is rather localized in the cell body of podocytes.</p>
Full article ">Figure 2
<p>Expression of TMEM16F and Xkr8 in AB8 podocytes. (<b>A</b>) Analysis of expression of Xkr8 and TMEM16F by RT-PCR in AB8 podocytes expressing TMEM16F-shRNA3 or shRNA5. (<b>B</b>,<b>C</b>) Summary of the expression of Xkr8 and TMEM16F in the absence or presence of doxycycline (doxy; 125 ng/mL). (<b>D</b>) Immunofluorescence of TMEM16F and Cherry fluorescence in AB8 cells in the absence and presence of dox. Mean ± standard error of the mean (SEM) (number of experiments). # significant difference when compared to -Dox (<span class="html-italic">p</span> &lt; 0.05; unpaired Student’s <span class="html-italic">t</span> test).</p>
Full article ">Figure 3
<p>Knockdown of TMEM16F in podocytes had little effects on the expression of proteins related to cell proliferation/cell cycle or cell death. (<b>A</b>) Western blot analyses of three independent lysates from AB8 shTMEM16F-3 cells. Samples that have been induced with Doxycycline for 7 days are indicated as TMEM16F KD. Cells for the samples shown in the left panel were cultured under standard conditions, and cells for control and knockdown samples shown on the right were starved in serum-free medium for 48 h prior to harvesting. Equal loading, efficient induction, and knockdown of the target protein TMEM16F were verified by immunoblotting for TMEM16F, red fluorescent protein (RFP) cassette (mCherry), and beta tubulin. Western blots were performed for p42/44 MAPK, Akt, phospho-p42/44 MAPK (at a long (upper blot) and a short (lower blot) exposure time), phospho-Akt, and indicator proteins of apoptosis (cleavage of Caspase 3 and poly-ADP-Ribose-Polymerase (PARP)). (<b>B</b>) Densitometry analysis of expression of Akt and phospho-Akt relative to ß-tubulin (arbitrary units, au). Apart from decreased phosphorylation of AKT at T308 in starved cells, there were no quantitative differences in signaling proteins included in this screen. Mean ± SEM (number of experiments).</p>
Full article ">Figure 4
<p>Cell death in renal epithelial cells. (<b>A</b>) Positive control (+DNAse I) and negative control (-rTerminal Deoxynucleotidyl Transferase) for TUNEL assays. (<b>B</b>,<b>C</b>) TUNEL staining in TMEM16F+/+ and TMEM16F−/− kidneys. No signals were detected in glomerula of both +/+ and −/− kidneys and only very few TUNEL-positive cells were seen in tubules of −/− kidneys. # significant difference when compared to +/+ (<span class="html-italic">p</span> &lt;0.05; unpaired Student’s <span class="html-italic">t</span> test). White circles shown in B indicate localization of glomeruli, which are also shown as enhanced magnified insets (glom). (<b>D</b>) Phospholipid scrambling (annexinV positivity) upon stimulation with ATP (5 mM) or the Ca<sup>2+</sup> ionophore ionomycin (5 µM) in AB8-TMEM16F+/+ (-dox) and AB8-TMEM16F−/− (+dox) podocytes. (<b>E</b>) LDH (lactate dehydrogenase) release induced by TNFα in AB8-TMEM16F+/+ (−dox) and AB8-TMEM16F−/− (+dox) podocytes. Mean ± SEM (number of experiments). <sup>#</sup> significant difference when compared to −Dox (<span class="html-italic">p</span> &lt; 0.05; unpaired Student’s <span class="html-italic">t</span> test).</p>
Full article ">Figure 5
<p>Ca<sup>2+</sup>-activated whole-cell currents in AB8 podocytes. (<b>A</b>,<b>B</b>) Current voltage relationships of whole-cell ion currents and current densities activated by the Ca<sup>2+</sup> ionophore ionomycin (1 µM) in AB8 podocytes in the presence (−Dox) or absence (+Dox) of TMEM16F. (<b>C</b>,<b>D</b>) Current voltage relationships of whole-cell ion currents and current densities in the absence (con) or presence of the ROS donor and lipid peroxydizer tert-butyl hydroperoxide (tBHP;100 µM/2 h). (<b>E</b>,<b>F</b>) Summary of ionomycin-induced whole-cell currents and current/voltage relationships in AB8-TMEM16F+/+ (−dox) and AB8-TMEM16F−/− (+dox) podocytes and effect of 48 h incubation with angiotensin II (AngII) (1 µM). Mean ± SEM (number of experiments). * significant effect of ionomycin (<span class="html-italic">p</span> &lt; 0.05; paired Student’s <span class="html-italic">t</span> test).</p>
Full article ">Figure 6
<p>Ca<sup>2+</sup> signaling in AB8 podocytes. (<b>A</b>,<b>B</b>) Increase in intracellular Ca<sup>2+</sup> ([Ca<sup>2+</sup>]<sub>i</sub>) by stimulation with ATP (10 µM), Ang II (100 nM), or hypotonic bath solution (33%) in the presence (−Dox) or absence (+Dox) of TMEM16F (summary curves). (<b>B</b>) Summary of basal Ca<sup>2+</sup> levels in two different AB8 clones, IONO in the presence (−Dox) or absence (+Dox) of TMEM16F. (<b>C</b>) Summary of the effects of ATP, Ang II, and hypo on two AB8 clones in the presence (−Dox) or absence (+Dox) of TMEM16F. Mean ± SEM (number of experiments).</p>
Full article ">Figure 7
<p>Regulation of TMEM16F in podocytes. (<b>A</b>) Western blot analysis indicating low endogenous non-detectable AT1R levels that were enhanced by incubation with Ang II and additional treatment with doxycycline (Dox). Ang II and additional expression of AT1R strongly augmented expression of TMEM16F. (<b>B</b>) Western blotting indicating cellular accumulation of nuclear pore glycoprotein 62 (p62) and TMEM16F during inhibition of PIKfyve. (<b>C</b>) Western blots indicating accumulation of TMEM16F in podocytes by treatment with the inhibitor of Rho kinase (ROCK), hydroxyfasudil.</p>
Full article ">Figure 8
<p>Generation of TMEM16F floxed mice. (<b>A</b>–<b>D</b>) Targeting of mouse TMEM16F gene, exon 7. The intronic and intergenic regions are presented as a line, and exons are displayed as filled boxes with numeration. The neomycin resistance cassette is marked (neo) and flanked by the FRT sites (not shown). The arrows above correspond to the LoxP sequences, and the arrows below correspond to restriction endonuclease sites <span class="html-italic">Eco</span>RI (R). The black box corresponds to the Southern probe sequence (HR). The expected sizes of restriction DNA fragments are labeled below in kb. (<b>A</b>) Wild-type (wt) locus. (<b>B</b>) Targeted vector structure (without negative selection marker and plasmid backbone). (<b>C</b>) Mouse genomic locus after the homologous recombination. The “neo” cassette is present in intron 6, and exon 7 flanked by two LoxP sites. (<b>D</b>) Deletion of the “neo” cassette after crossing with the FLPe-deleter mice. The exon 7 is flanked by two LoxP sites. (<b>E</b>) Southern blot analysis of DNAs isolated from F1 mouse tail biopsy (4–13) and hybridized with the HR probe. With the help of the <span class="html-italic">Eco</span>RI enzymatic digestion, we detected wt allele 5.5 kb and targeted allele 6.6 kb. DNA samples 6–10 and 12 contain correctly targeted <span class="html-italic">TMEM16F</span> gene. Positions of the size marker (in bp) are shown on the right. (<b>F</b>) Southern blot analysis of DNAs isolated from mouse tail biopsy (1–17) of F2 offspring after crossing of the <span class="html-italic">TMEM16F<sup>+/-</sup></span> with the FLPe-expressing transgenic mice. <span class="html-italic">Eco</span>RI enzymatic digestion detected animals 2, 4, 6–9, 10, 11, and 13–15 with the deleted “neo” cassette.</p>
Full article ">Figure 9
<p>Lack of a renal phenotype by renal TMEM16F knockout. (<b>A</b>) Immunohistochemistry of TMEM16F(flox/flox) Six2Cre mice. Cre-negative animals, which were used as a littermate control in our study, display a normal expression of TMEM16F. Cre-positive animals (TMEM16F−/−) lack expression of TMEM16F in the kidney parenchyma. (<b>B</b>) Periodic acid Schiff stain of kidney sections of Cre-negative (control; TMEM16F+/+) and Cre-positive (TMEM16F−/−) animals. The parenchyma appears normal and cysts are absent in the TMEM16F−/− kidney. (<b>C</b>) Summaries for serum creatinine, urea nitrogen, and serum electrolyte concentrations, which did not differ between TMEM16F+/+ and TMEM16F−/− animals. Mean ± SEM (number of experiments).</p>
Full article ">
29 pages, 5040 KiB  
Review
Role of MicroRNAs in Renal Parenchymal Diseases—A New Dimension
by Saeed Kamran Shaffi, David Galas, Alton Etheridge and Christos Argyropoulos
Int. J. Mol. Sci. 2018, 19(6), 1797; https://doi.org/10.3390/ijms19061797 - 17 Jun 2018
Cited by 22 | Viewed by 5148
Abstract
Since their discovery in 1993, numerous microRNAs (miRNAs) have been identified in humans and other eukaryotic organisms, and their role as key regulators of gene expression is still being elucidated. It is now known that miRNAs not only play a central role in [...] Read more.
Since their discovery in 1993, numerous microRNAs (miRNAs) have been identified in humans and other eukaryotic organisms, and their role as key regulators of gene expression is still being elucidated. It is now known that miRNAs not only play a central role in the processes that ensure normal development and physiology, but they are often dysregulated in various diseases. In this review, we present an overview of the role of miRNAs in normal renal development and physiology, in maladaptive renal repair after injury, and in the pathogenesis of renal parenchymal diseases. In addition, we describe methods used for their detection and their potential as therapeutic targets. Continued research on renal miRNAs will undoubtedly improve our understanding of diseases affecting the kidneys and may also lead to new therapeutic agents. Full article
(This article belongs to the Special Issue The Role of MicroRNAs in Human Diseases)
Show Figures

Figure 1

Figure 1
<p>Overview of the with no Lysine Kinase (WNK) system. Abbreviations: NCC: Sodium/Chloride cotransporter; DCT: Distal Convoluted Tubule; CCD: Cortical Collecting Duct; ENaC; Epithelial Sodium Channel; ROMK: Renal Outer Medullary Potassium Channel; ⊕ Increase expression; ⨂ Decrease expression. (<b>Panel 1</b>) In between meals when the kidney retains Na<sup>+</sup> and K<sup>+</sup>. This is mediated by the presence of WNK3 which increases the expression of NCC in the DCT as well as prevents ROMK expression in the CCD. (<b>Panel 2</b>) K<sup>+</sup> rich meal period when there is need to excrete K<sup>+</sup>. Expression of WNK4 causes suppression of WNK3 which leads to diminished presence of NCC in the DCT and increased Na<sup>+</sup> delivery to CCD. In the presence of aldosterone, ENaCs are expressed in the CCD with electrogenic Na absorption making the lumen negative. WNK4 increases the expression of ROMK in the CCD with the removal of K down the electrical gradient. (<b>Panel 3</b>) After K rich meal period. WNK1 antagonizes WNK4 with re-expression to WNK3 phenotype (<b>Panel 1</b>).</p>
Full article ">Figure 2
<p>miRNA discovery cycle from biomarkers to therapeutics.</p>
Full article ">Figure 3
<p>miRNAs as personalized diagnostics in kidney diseases.</p>
Full article ">
26 pages, 37748 KiB  
Review
Bioengineering Approaches for Bladder Regeneration
by Ángel Serrano-Aroca, César David Vera-Donoso and Victoria Moreno-Manzano
Int. J. Mol. Sci. 2018, 19(6), 1796; https://doi.org/10.3390/ijms19061796 - 17 Jun 2018
Cited by 64 | Viewed by 10438
Abstract
Current clinical strategies for bladder reconstruction or substitution are associated to serious problems. Therefore, new alternative approaches are becoming more and more necessary. The purpose of this work is to review the state of the art of the current bioengineering advances and obstacles [...] Read more.
Current clinical strategies for bladder reconstruction or substitution are associated to serious problems. Therefore, new alternative approaches are becoming more and more necessary. The purpose of this work is to review the state of the art of the current bioengineering advances and obstacles reported in bladder regeneration. Tissue bladder engineering requires an ideal engineered bladder scaffold composed of a biocompatible material suitable to sustain the mechanical forces necessary for bladder filling and emptying. In addition, an engineered bladder needs to reconstruct a compliant muscular wall and a highly specialized urothelium, well-orchestrated under control of autonomic and sensory innervations. Bioreactors play a very important role allowing cell growth and specialization into a tissue-engineered vascular construct within a physiological environment. Bioprinting technology is rapidly progressing, achieving the generation of custom-made structural supports using an increasing number of different polymers as ink with a high capacity of reproducibility. Although many promising results have been achieved, few of them have been tested with clinical success. This lack of satisfactory applications is a good reason to discourage researchers in this field and explains, somehow, the limited high-impact scientific production in this area during the last decade, emphasizing that still much more progress is required before bioengineered bladders become a commonplace in the clinical setting. Full article
(This article belongs to the Special Issue Cell Colonization in Scaffolds)
Show Figures

Graphical abstract

Graphical abstract
Full article ">Figure 1
<p>Urinary bladder histological organization in physiological conditions. (I–IV) Representative images of a longitudinal bladder section from an adult male rat after trichromic Masson staining. The adventitious layer (the outermost one), the urothelium (II), and the muscle bundles (IV) are stained in dark red, and the extracellular matrix of the submucosa is stained in blue (III). The location of the layers II, III, and IV is shown in image I by a corresponding colored frame with a dashed line; V: The illustration on the right shows the bladder organization in layers. Starting from the lumen, the bladder is composed of a transitional epithelium or urothelium formed by 4–5 layers of specialized cells supported by the basal lamina and followed by the submucosa coat, a loose connective tissue containing fibroblasts, blood vessels, and extracellular matrix and enriched in collagen I and III. Below, consecutive layers with perpendicular orientations of smooth muscle fibers form an inner muscle layer followed by the detrusor, characterized by smooth muscle fibers organized in circular and longitudinal layers. The adventitious layer of adipose tissue completes the structural organization.</p>
Full article ">Figure 2
<p>Types of urinary diversion currently performed after radical cystectomy: (<b>a</b>) abdominal diversion, such as an ureterocutaneostomy, colonic, or ileal conduit; (<b>b</b>) various forms of a continent pouch created using different segments of the gastrointestinal system and a cutaneous stoma; and (<b>c</b>) orthotopic urinary diversion with an intestinal segment with spherical configuration and anastomosis to the urethra (neobladder, orthotopic bladder substitution).</p>
Full article ">Figure 3
<p>Acellular bladder submucosa scaffolds. Scanning electron micrographs (SEM) of fresh bladder submucosa (BSM) at 1000× magnification: surface (<b>a</b>) and cross section (<b>b</b>,<b>c</b>). The scale bar indicates 200 µm. Reprinted with permission from Elsevier Ltd., Liu et al. [<a href="#B58-ijms-19-01796" class="html-bibr">58</a>].</p>
Full article ">Figure 4
<p>Morphology of a poly(ε-caprolactone (PCL)/poly-<span class="html-small-caps">l</span>-lactide (PLLA) scaffold and cell distribution by SEM. Non-woven and randomly oriented fibers of PCL and PLLA at 500× (<b>A</b>) and 5000× (<b>B</b>) magnifications; (<b>C</b>) Urothelial cells on the scaffold surface preserving their phenotype by creating their typical colonies; (<b>D</b>) Bladder smooth muscle cells expanded and proliferated on the scaffold. Reprinted with permission from Elsevier Ltd., Shakhssalim et al. [<a href="#B47-ijms-19-01796" class="html-bibr">47</a>].</p>
Full article ">Figure 5
<p>In vitro bioreactor: a computer senses the pressure in pressure chamber (<b>B</b>) by feedback via a pressure transducer (<b>E</b>). A computer interface establishes and maintains a specific hydrodynamic pressure by controlling a pump (<b>A</b>) output. A pressure valve (<b>C</b>) is almost completely closed to simulate bladder outlet obstruction. Dulbecco’s modified Eagle’s medium with 10% fetal bovine serum was used. The arrows indicate the flow direction. (<b>D</b>) Fluid reservoir. Reprinted with permission from Elsevier Ltd., Chen et al. [<a href="#B50-ijms-19-01796" class="html-bibr">50</a>].</p>
Full article ">Figure 6
<p>In vivo bioreactor: seeded scaffold preparation (<b>A</b>–<b>C</b>) and implantation (<b>D</b>) in the omentum. Reprinted with permission from Elsevier Ltd., Baumert et al. [<a href="#B147-ijms-19-01796" class="html-bibr">147</a>].</p>
Full article ">Figure 7
<p>Bioprinting technologies: components of laser-induced forward transfer (<b>a</b>), inkjet printing (<b>b</b>) and robotic dispensing (<b>c</b>). Adapted from John Wiley and Sons, Malda et al. [<a href="#B163-ijms-19-01796" class="html-bibr">163</a>].</p>
Full article ">
38 pages, 4933 KiB  
Review
Shining Light on Chitosan: A Review on the Usage of Chitosan for Photonics and Nanomaterials Research
by Sreekar B. Marpu and Erin N. Benton
Int. J. Mol. Sci. 2018, 19(6), 1795; https://doi.org/10.3390/ijms19061795 - 17 Jun 2018
Cited by 54 | Viewed by 8660
Abstract
Chitosan (CS) is a natural polymer derived from chitin that has found its usage both in research and commercial applications due to its unique solubility and chemical and biological attributes. The biocompatibility and biodegradability of CS have helped researchers identify its utility in [...] Read more.
Chitosan (CS) is a natural polymer derived from chitin that has found its usage both in research and commercial applications due to its unique solubility and chemical and biological attributes. The biocompatibility and biodegradability of CS have helped researchers identify its utility in the delivery of therapeutic agents, tissue engineering, wound healing, and more. Industrial applications include cosmetic and personal care products, wastewater treatment, and corrosion protection, to name a few. Many researchers have published numerous reviews outlining the physical and chemical properties of CS, as well as its use for many of the above-mentioned applications. Recently, the cationic polyelectrolyte nature of CS was found to be advantageous for stabilizing fascinating photonic materials including plasmonic nanoparticles (e.g., gold and silver), semiconductor nanoparticles (e.g., zinc oxide, cadmium sulfide), fluorescent organic dyes (e.g., fluorescein isothiocyanate (FITC)), luminescent transitional and lanthanide complexes (e.g., Au(I) and Ru(II), and Eu(III)). These photonic systems have been extensively investigated for their usage in antimicrobial, wound healing, diagnostics, sensing, and imaging applications. Highlighted in this review are the different works involving some of the above-mentioned molecular-nano systems that are prepared or stabilized using the CS polymer. The advantages and the role of the CS for synthesizing and stabilizing the above-mentioned optically active materials have been illustrated. Full article
(This article belongs to the Special Issue Chitins 2018)
Show Figures

Graphical abstract

Graphical abstract
Full article ">Figure 1
<p>Schematic illustration showing different applications of chitosan (CS), highlighting the photonic applications of CS and its derivatives.</p>
Full article ">Figure 2
<p>Demonstrates formation of FCSNPS using FITC. Daylight and emission pictures are shown in (<b>A</b>), and actual size and size distribution of the FCSNPs are shown in (<b>B</b>). Reprinted with permission from <span class="html-italic">Chem. Comm</span>. <b>2009</b>, 2347–2349, Copyright 2009, Royal Society of Chemistry [<a href="#B52-ijms-19-01795" class="html-bibr">52</a>].</p>
Full article ">Figure 3
<p>Demonstrates formation of phosphorescent CS nanoparticles using an Iridium-based organometallic complex. CS polymer is shown to encapsulate the phosphorescent molecular system during formation of phosphorescent nanoparticles. Reprinted with permission from <span class="html-italic">Nanoscale</span> <b>2013</b>, <span class="html-italic">5</span>, 12633–12644, Copyright 2013, Royal Society of Chemistry [<a href="#B55-ijms-19-01795" class="html-bibr">55</a>].</p>
Full article ">Figure 4
<p>Schematic illustration for the formation of phosphorescent CS nanoparticles using Au(I) molecular system as a crosslinker. The light scattering data demonstrates the formation of size-tunable particles. Figure (<b>a</b>) CS nanoparticles in day light, (<b>b</b>) CS nanoparticles on excitation with UV lamp. A, B, C represents varying concentrations of Au(I) molecular system and CS polymer during synthesis of phosphorescent CS nanoparticles. Reprinted with permission from <span class="html-italic">J. Phys. Chem. C</span> <b>2015</b>, <span class="html-italic">119</span>, 12551–12561, Copyright 2015, American Chemical Society [<a href="#B46-ijms-19-01795" class="html-bibr">46</a>].</p>
Full article ">Figure 5
<p>Demonstrates stabilizing feature of CS polymer during formation of CS capped silver nanotriangles. The CS-AgNTs are shown to exhibit better biocompatibility compared to PEG stabilized AuNRs. The figure shows (<b>A</b>,<b>B</b>) the cytotoxicity profiles of CS-stabilized AgNTs and PEG-AuNRs respectively towards HEK (black symbols) and NCI-H460 (red symbols) cells. NCI-H460 cells double-stained with Hoechst-viability and Propidium Iodide-mortality indicators the presence of (<b>C</b>) CS-AgNTs and (<b>D</b>) PEG-AuNRs. The arrows indicate condensed and fragmented nuclei typical of apoptotic cells. Reprinted with permission from <span class="html-italic">Cancer Lett.</span> <b>2011</b>, <span class="html-italic">311</span>, 131–140, Copyright 2011, Elsevier Ireland Ltd. [<a href="#B115-ijms-19-01795" class="html-bibr">115</a>].</p>
Full article ">Figure 6
<p>Demonstrates the sensing action of CS stabilized AuNPs. Schematics show the formation of CS stabilized AuNPs. (<b>A</b>) Schematic representation of the formation of chitosan-stabilized AuNPs where (<b>a</b>) represents the polycationic form of CS, (<b>b</b>) shows the formation of ion pairs with AuCl<sub>4</sub><sup>-</sup> and (<b>c</b>) shows the CS stabilized AuNPs. The red circle indicates the tripolyphosphate (TPP); (<b>B</b>) Schematic representation of colorimetric mechanism for melamine detection. The insert is photographs of solution of tubes (<b>a</b>) CS stabilized AuNPs, (<b>b</b>) CS stabilized AuNPs with melamine, (<b>c</b>) CS stabilized AuNPs with melamine and TEM image of chitosan-stabilized AuNPs with melamine. The melamine detection is indicated by the color change of AuNPs. Reprinted with permission from <span class="html-italic">Food Control</span>. <b>2012</b>, <span class="html-italic">32</span>, 35–41, Copyright 2012, Elsevier [<a href="#B137-ijms-19-01795" class="html-bibr">137</a>].</p>
Full article ">Figure 7
<p>Demonstrates stabilizing feature of CS polymer. Formation of phosphorescent Au(I)-based molecular system and its heavy metal sensing application. In figure <b>I</b>, the difference in photoluminescence spectra of Au(I) molecular system stabilized in aqueous and chitosan media is shown. In figure <b>II</b>, the silver sensing ability of Au(I) molecular system stabilized in CS polymer is demonstrated from fluorescent images. (<b>A</b>) Changes in photoluminescence spectra of Au(I) based molecular system in the presence of various metals is shown; (<b>B</b>) Shows I/I<sub>0</sub> values of various metals, derived from photoluminescence spectra. The “*” indicates weak emission from impurities in chitosan. Reprinted with permission from <span class="html-italic">Anal. Chem</span>. <b>2018</b>, <span class="html-italic">90</span>, 4999–5006, Copyright 2018, American Chemical Society [<a href="#B69-ijms-19-01795" class="html-bibr">69</a>].</p>
Full article ">Figure 7 Cont.
<p>Demonstrates stabilizing feature of CS polymer. Formation of phosphorescent Au(I)-based molecular system and its heavy metal sensing application. In figure <b>I</b>, the difference in photoluminescence spectra of Au(I) molecular system stabilized in aqueous and chitosan media is shown. In figure <b>II</b>, the silver sensing ability of Au(I) molecular system stabilized in CS polymer is demonstrated from fluorescent images. (<b>A</b>) Changes in photoluminescence spectra of Au(I) based molecular system in the presence of various metals is shown; (<b>B</b>) Shows I/I<sub>0</sub> values of various metals, derived from photoluminescence spectra. The “*” indicates weak emission from impurities in chitosan. Reprinted with permission from <span class="html-italic">Anal. Chem</span>. <b>2018</b>, <span class="html-italic">90</span>, 4999–5006, Copyright 2018, American Chemical Society [<a href="#B69-ijms-19-01795" class="html-bibr">69</a>].</p>
Full article ">
13 pages, 1639 KiB  
Review
Scorpins in the DNA Damage Response
by Dario Palmieri, Anna Tessari and Vincenzo Coppola
Int. J. Mol. Sci. 2018, 19(6), 1794; https://doi.org/10.3390/ijms19061794 - 17 Jun 2018
Cited by 10 | Viewed by 5074
Abstract
The DNA Damage Response (DDR) is a complex signaling network that comes into play when cells experience genotoxic stress. Upon DNA damage, cellular signaling pathways are rewired to slow down cell cycle progression and allow recovery. However, when the damage is beyond repair, [...] Read more.
The DNA Damage Response (DDR) is a complex signaling network that comes into play when cells experience genotoxic stress. Upon DNA damage, cellular signaling pathways are rewired to slow down cell cycle progression and allow recovery. However, when the damage is beyond repair, cells activate complex and still not fully understood mechanisms, leading to a complete proliferative arrest or cell death. Several conventional and novel anti-neoplastic treatments rely on causing DNA damage or on the inhibition of the DDR in cancer cells. However, the identification of molecular determinants directing cancer cells toward recovery or death upon DNA damage is still far from complete, and it is object of intense investigation. SPRY-containing RAN binding Proteins (Scorpins) RANBP9 and RANBP10 are evolutionarily conserved and ubiquitously expressed proteins whose biological functions are still debated. RANBP9 has been previously implicated in cell proliferation, survival, apoptosis and migration. Recent studies also showed that RANBP9 is involved in the Ataxia Telangiectasia Mutated (ATM) signaling upon DNA damage. Accordingly, cells lacking RANBP9 show increased sensitivity to genotoxic treatment. Although there is no published evidence, extensive protein similarities suggest that RANBP10 might have partially overlapping functions with RANBP9. Like RANBP9, RANBP10 bears sites putative target of PIK-kinases and high throughput studies found RANBP10 to be phosphorylated following genotoxic stress. Therefore, this second Scorpin might be another overlooked player of the DDR alone or in combination with RANBP9. This review focuses on the relatively unknown role played by RANBP9 and RANBP10 in responding to genotoxic stress. Full article
(This article belongs to the Special Issue Alterations to Signalling Pathways in Cancer Cells 2018)
Show Figures

Figure 1

Figure 1
<p>Schematic representation of RANBP9 and RANBP10 proteins. RANBP10 shares high amino acid conservation with RANBP9 in the PRY (94%), SPRY (97%), LisH (82%), CTLH (90%), and CRA (89%) domains. The two proteins differ the most at the N-terminus and in the post-CTLH region, which contains several putative PIK-kinase phosphorylation sites (see <a href="#ijms-19-01794-t001" class="html-table">Table 1</a>). PRD (red)= Proline-Rich Domain; PRY/SPRY (light blue) = Spore lysis A and Ryanodine receptor Domain; LisH (green) = Lissencephaly type-I-like homology motif; CTLH (yellow) = Carboxy-terminal to LisH motif domain; CRA (orange) = CT11-RanBP9 domain; dark blue = putative Nuclear Localization Signal; Tub (purple) = tubulin-binding domain.</p>
Full article ">Figure 2
<p>Schematic representation of the <span class="html-italic">S. cerevisiae</span> Glucose-Induced degradation Deficient (GID)- and correspondent mammalian CTLH-macromolecular complexes. (<b>A</b>) The topology of the GID complex in yeast is well established [<a href="#B31-ijms-19-01794" class="html-bibr">31</a>]; (<b>B</b>) Predicted composition of the mammalian CTLH complex based on the GID mammalian homologs. The name of the complex comes from the CTLH domain that most of the members have; (<b>C</b>) CTLH or Nuclear Receptor coregulator-complex pulled down from mammalian cells including RANBP9 and RANBP10 (adapted from [<a href="#B29-ijms-19-01794" class="html-bibr">29</a>]). In the depicted complex, GID8 is named C20orf11 and indicated as C20. The experiment showed as part of the complex also YPEL5 (<span class="underline">Y</span>ip<span class="underline">pe</span>e <span class="underline">L</span>ike 5) indicated as Y5 in the cartoon, which has no known equivalent in the <span class="html-italic">S. cerevisiae</span> GID complex.</p>
Full article ">Figure 3
<p>Potential action mechanism of RANBP9 in ATM-dependent DDR. In RANBP9 (red) expressing cells and in the absence of DNA damage (left panel, top), RANBP9 protein shuttles between the nucleus and the cytoplasm. Upon DNA damage such as IR and DNA-damaging drugs (left panel, bottom), ATM is activated and enhances RANBP9 nuclear accumulation through its phosphorylation, potentially with other cytoplasmic partners (purple). This event potentially leads to enhanced KAT5-dependent ATM acetylation, a marker of its full activation. For this reason, RANBP9-expressing cells activate an efficient ATM signaling pathway, resulting in efficient DNA repair and survival to genotoxic stress. Conversely, when RANBP9 expression is reduced, the full activation of ATM is impaired, leading to inefficient DNA repair and sensitivity to DNA damaging agents.</p>
Full article ">
14 pages, 1022 KiB  
Review
Epigenomic Control of Thermogenic Adipocyte Differentiation and Function
by Xu Peng, Qiongyi Zhang, Cheng Liao, Weiping Han and Feng Xu
Int. J. Mol. Sci. 2018, 19(6), 1793; https://doi.org/10.3390/ijms19061793 - 17 Jun 2018
Cited by 14 | Viewed by 5844
Abstract
Obesity and its associated metabolic disorders are spreading at a fast pace throughout the world; thus, effective therapeutic approaches are necessary to combat this epidemic. Obesity develops when there is a greater caloric intake than energy expenditure. Promoting energy expenditure has recently attracted [...] Read more.
Obesity and its associated metabolic disorders are spreading at a fast pace throughout the world; thus, effective therapeutic approaches are necessary to combat this epidemic. Obesity develops when there is a greater caloric intake than energy expenditure. Promoting energy expenditure has recently attracted much attention as a promising approach for the management of body weight. Thermogenic adipocytes are capable of burning fat to dissipate chemical energy into heat, thereby enhancing energy expenditure. After the recent re-discovery of thermogenic adipocytes in adult humans, much effort has focused on understanding the molecular mechanisms, especially the epigenetic mechanisms, which regulate thermogenic adipocyte development and function. A number of chromatin signatures, such as histone modifications, DNA methylation, chromatin accessibilities, and interactions, have been profiled at the genome level and analyzed in various murine and human thermogenic fat cell systems. Moreover, writers and erasers, as well as readers of the epigenome are also investigated using genomic tools in thermogenic adipocytes. In this review, we summarize and discuss the recent advance in these studies and highlight the insights gained into the epigenomic regulation of thermogenic program as well as the pathogenesis of human metabolic diseases. Full article
(This article belongs to the Special Issue Transcriptional Regulation in Lipid Metabolism)
Show Figures

Graphical abstract

Graphical abstract
Full article ">Figure 1
<p>Histone modifications studied at the genome-wide level during thermogenic adipocyte differentiation. Permissive histone marks are colored in green, while repressive histone marks are in red.</p>
Full article ">Figure 2
<p>Schematic illustration of the collaborative regulation of thermogenic fat cell differentiation by writers, erasers, and readers of the epigenome.</p>
Full article ">
16 pages, 1644 KiB  
Review
The Expensive-Tissue Hypothesis in Vertebrates: Gut Microbiota Effect, a Review
by Chun Hua Huang, Xin Yu and Wen Bo Liao
Int. J. Mol. Sci. 2018, 19(6), 1792; https://doi.org/10.3390/ijms19061792 - 17 Jun 2018
Cited by 22 | Viewed by 8838
Abstract
The gut microbiota is integral to an organism’s digestive structure and has been shown to play an important role in producing substrates for gluconeogenesis and energy production, vasodilator, and gut motility. Numerous studies have demonstrated that variation in diet types is associated with [...] Read more.
The gut microbiota is integral to an organism’s digestive structure and has been shown to play an important role in producing substrates for gluconeogenesis and energy production, vasodilator, and gut motility. Numerous studies have demonstrated that variation in diet types is associated with the abundance and diversity of the gut microbiota, a relationship that plays a significant role in nutrient absorption and affects gut size. The Expensive-Tissue Hypothesis states (ETH) that the metabolic requirement of relatively large brains is offset by a corresponding reduction of the other tissues, such as gut size. However, how the trade-off between gut size and brain size in vertebrates is associated with the gut microbiota through metabolic requirements still remains unexplored. Here, we review research relating to and discuss the potential influence of gut microbiota on the ETH. Full article
(This article belongs to the Special Issue The (Microbiota)–Gut–Brain Axis: Hype or Revolution?)
Show Figures

Figure 1

Figure 1
<p>Regulation of food intake via gut-brain pathway. (<b>A</b>) When undigested dietary residue arrives at the caecum, colon, rumen, and hind gut, the bacteria populated in the intestines ferment them to short-chain fatty acids (SCFAs) (e.g., acetate, propionate, and butyrate). Then free fatty acid receptor 2 (FFAR2) and free fatty acid receptor 3 (FFAR3) on the L-cells interact with SCFAs to trigger the secretion of anorectic hormones, including peptide YY (PYY) and glucagon-like peptide 1 (GLP1). PYY and GLP1 then preferentially bind to the Y2 receptor located on the arcuate nucleus of the hypothalamus via the vagus nerve, which further increases the expression of the anorexigenic pro-opiomelanocortin (POMC) neuropeptide while decreasing the expression of neuropeptide Y (NPY), thus managing to control food intake; (<b>B</b>) Microbiota ferment dietary nutrients, digesting them to SCFAs. Acetate molecules then stimulate the vagus nerve, which triggers the stomach to secrete the “hunger hormone” ghrelin, leading to the increase of food intake.</p>
Full article ">Figure 2
<p>SCFAs in liver circulation and central metabolism. Butyrate, propionate, and acetate enter the liver via the portal vein after passing through the mesenteric veins, cecal veins, and colonic veins. They are then utilized for lipogenesis and gluconeogenesis in the liver, the products of which then enter blood circulation. SCFAs are an important source of energy (in the form of ATP) for colonocytes and for gluconeogenesis in the modulation of the central metabolism.</p>
Full article ">Figure 3
<p>The Relationship Between Gut and Brain Size.</p>
Full article ">
Previous Issue
Next Issue
Back to TopTop