Academia.edu no longer supports Internet Explorer.
To browse Academia.edu and the wider internet faster and more securely, please take a few seconds to upgrade your browser.
2010
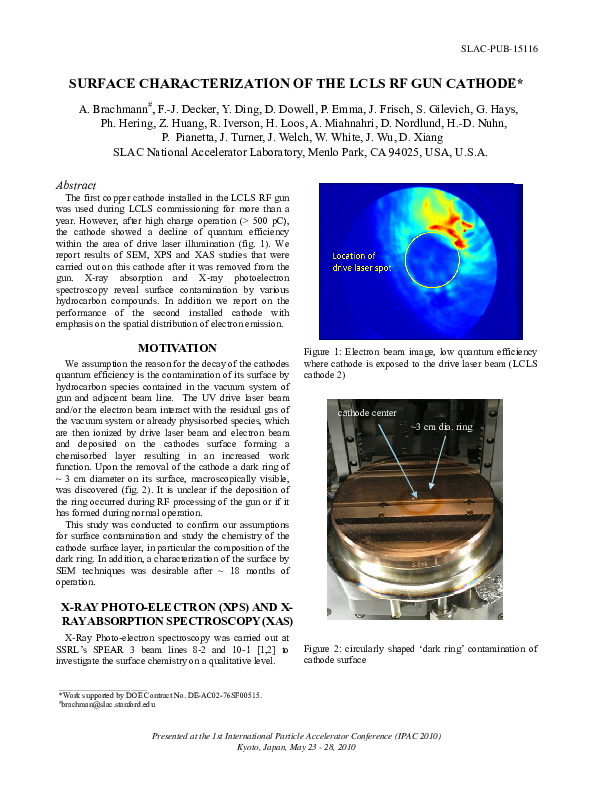
Surface characterization of the LCLS RF gun cathode A. Brachmann On behalf of the LCLS commissioning team The first copper cathode installed in the LCLS RF gun was used during LCLS commissioning for more than a year. However, after high charge operation (~ 500 pC), the cathode showed a decline of quantum efficiency due to surface contamination caused by residual ionized gas species present in the vacuum system. We report results of SEM, XPS and XAS studies that were carried out on this cathode after it was removed from the gun. X-ray absorption and X-ray photoelectron spectroscopy reveal surface contamination by various hydrocarbon compounds. In addition we report on the performance of the second installed cathode with emphasis on the spatial distribution of electron emission.
1998 •
2014 •
The Linac Coherent Light Source (LCLS) has used three copper photocathodes since its commissioning in 2007. Two of three copper cathodes had low initial quantum efficiency (QE) (<1×10) in the LCLS radio frequency (RF) gun. The two cathodes were exposed to the plasma cleaning in the cathode test chamber before installation in the RF gun. Recent studies at the SLAC RF gun test bed at the Accelerator Structure Test Area (ASTA) reveals that the pre-cleaning in the test chamber followed by cathode exposure to air for installation in the gun is the major factor leading to the low initial QE. All four cathodes, without the plasma pre-cleaning prior to the installation in the gun, have demonstrated initial QE>4×10 at the ASTA. Systematic studies also demonstrate that high-power RF gun operation provides an initial QE boost. In-situ laser cleaning for three new cathodes in the RF gun is extensively investigated, and a robust laser cleaning procedure is established at the ASTA with impr...
Metal cathodes installed in rf guns typically exhibit much lower quantum efficiency than the theoretical limit. Experimenters often use some sort of in situ technique to ''clean'' the cathode to improve the QE. The most common technique is laser cleaning where the laser is focused to a small spot and scanned across the cathode surface. However, since the laser is operated near the damage threshold, it can also damage the cathode and increase the dark current. The QE also degrades over days and must be cleaned regularly. We are searching for a more robust cleaning technique that cleans the entire cathode surface simultaneously. In this paper we describe initial results using multiple techniques such as several keV ion beams, glow discharge cleaning and back bombarding electrons. Results are quantified in terms of the change in QE and dark current.
2014 •
This work reports a study of various alternative metal samples as candidate materials for use as photocathodes in normally conducting RF guns. Clean surfaces were prepared using Argon ion bombardment and quantum efficiency measured using a 265 nm UV LED light source. Surface composition was studied using X-ray photoelectron spectroscopy and a Kelvin probe apparatus provided work function measurements. Data were taken both before and after annealing to 200°C, a temperature that is routinely achieved during RF gun vacuum baking. Ion bombardment typically leaves a very rough surface, so further work will focus on the use of Oxygen plasma cleaning of the best candidate alternative metals. An oxygen plasma treated Copper photocathode has been shown to produce an acceptable level of quantum efficiency in the VELA accelerator at Daresbury.
2004 •
9th Int. Particle Accelerator Conf. (IPAC'18), Vancouver, BC, Canada, 29 April-04 May 2018
Photocathode Preparation and Characteristics of the Electron Source for the VELA/CLARA Facility2018 •
2012 •
Вестник древней истории
Строительная надпись из Танаиса: еще раз к вопросу о еврейской общине в Танаисе / Building inscription from Tanais: More about the Jewish community in Tanais2020 •
Environment & Planning D: Society & Space
Anticipation by redress: Transforming African mega-infrastructure futures2024 •
Cuando viajar se explica con palabras, Mónica Martín Molares María Elvira Lezcano González Francisco Javier Novoa Blanco (eds.)
Calvi 2022 La construcción discursiva de la proximidad en la lengua del turismo actual2022 •
Estudos de Sociologia
UM " RAIO-X " DO PROFESSOR DE SOCIOLOGIA BRASILEIRO: condições e percepções (versão com tabela 1 corrigida)2016 •
2024 •
Historia del cuerpo.Del Renacimiento al Siglo de las Luces
Corbin, Courtine y Vigarello - Historia del CUERPO Del Renacimiento al Siglo de las Luces taurus historia2005 •
Conference Paper
Epistemic injustice in the study of language variation in the Global South: Re-examining recent research on Sri Lankan Englishes2024 •
Tecné, Episteme y Didaxis: TED
Ya no somos Homo Sapiens: exploración a los desafíos del Homo Tecnologicus2024 •
Íconos - Revista de Ciencias Sociales
La desventura de ser soltero: introducción a la sociología rural de Pierre Bourdieu2013 •
Journal of Geriatric Oncology
Behavioral, psychological, and supportive care interventions in geriatric oncology: The Cancer and Aging Research Group infrastructure core2020 •
Journal of pharmaceutical and biomedical sciences
Prediction of Insensate Peripheral Neuropathy in Diabetics using “Semmes- Weinstein Monofilament” Examination2016 •
 S. Gilevich