Topics in Catalysis (2018) 61:1263–1273
https://doi.org/10.1007/s11244-018-0981-7
ORIGINAL PAPER
Morphology Conserving High Efficiency Nitrogen Doping of Titanate
Nanotubes by NH3 Plasma
Balázs Buchholcz1 · Kamilla Plank1 · Miklós Mohai2 · Ákos Kukovecz1 · János Kiss3,4 · Imre Bertóti2 · Zoltán Kónya1,4
Published online: 30 April 2018
© Springer Science+Business Media, LLC, part of Springer Nature 2018
Abstract
Titanate nanotubes offer certain benefits like high specific surface area, anisotropic mesoporous structure and ease of synthesis over other nanostructured titania forms. However, their application in visible light driven photocatalysis is hindered
by their wide band-gap, which can be remedied by, e.g., anionic doping. Here we report on a systematic study to insert nitrogen into lattice positions in titanate nanotubes. The efficiency of N2+ bombardment, N2 plasma and NH3 plasma treatment
is compared to that of NH3 gas synthesized in situ by the thermal decomposition of urea or NH4F. N2+ bombarded single
crystalline rutile TiO2 was used as a doping benchmark (16 at.% N incorporated). Surface species were identified by diffuse
reflectance infrared spectroscopy, structural features were characterized by scanning electron microscopy and powder X-ray
diffraction measurements. The local chemical environment of nitrogen built into the nanotube samples was probed by X-ray
photoelectron spectroscopy. Positively charged NH3 plasma treatment offered the best doping performance. This process
succeeded in inserting 20 at.% N into nanotube lattice positions by replacing oxygen and forming Ti–N bonds. Remarkably, the nanotubular morphology and titanate crystal structure were both fully conserved during the process. Since plasma
treatment is a readily scalable technology, the suggested method could be utilized in developing efficient visible light driven
photocatalysts based on N-doped titanate nanotubes.
Keywords Titanate nanotube · N-doping · NH3 plasma · Morphology · Anatase
1 Introduction
* Balázs Buchholcz
buchholcz@chem.u-szeged.hu
* Zoltán Kónya
konya@chem.u-szeged.hu
1
Department of Applied and Environmental Chemistry,
University of Szeged, Rerrich B. 1, Szeged 6720, Hungary
2
Hungarian Academy of Sciences (HAS), Research Centre
of Natural Sciences, Institute of Materials and Environmental
Chemistry, Magyar tudósok körútja 2, Budapest 1117,
Hungary
3
Department of Physical Chemistry and Materials Science,
University of Szeged, Aradi vértanúk tere 1, Szeged 6720,
Hungary
4
MTA-SZTE Reaction Kinetics and Surface Chemistry
Research Group, University of Szeged, Rerrich B. 1,
Szeged 6720, Hungary
Layered titanate nanotubes (TiONT) have attracted considerable attention in the past two decades because of their
relatively high specific surface area and pore volume, interesting open-ended tubular morphology [1, 2] and ability
to stabilize metal nanoparticles [3, 4], metal oxides [5] or
multicomponent semiconductors on their surface [6]. These
properties render TiONTs a potential catalyst or catalyst support in thermal [7, 8] and photo-activated chemical reactions
[9–11]. Moreover, titanate nanotubes can be used as ionexchangers [12], adsorbents [13] or in different biomedical applications [14, 15]. The chemical formula of TiONTs
can be described as Na2Ti3O7 or H2Ti3O7, the latter being
the protonated form of the as-synthesized former structure.
Peng et al. offered a mixed cationic formula: NaxH2−xTi3O7
[16] that is probably the most appropriate for referring to a
general TiONT sample.
TiONTs can be synthesized from a broad variety of
titanium-oxides made up of TiO6 octahedra, e.g. anatase,
rutile, brookite and certain salts of titanic acid [17, 18].
13
Vol.:(0123456789)
�1264
At the first glance, TiONTs seem to be very different from
titanium-dioxides, but actually, there are many similarities
in the properties of this titanium-oxide based material and
TiO2 [16]. Finding these similarities and differences between
TiO2 and TiONT is a key direction in contemporary titania
nanostructure research [5].
TiO2 is among the most popular metal-oxide semiconductors in the field of UV-light driven photocatalysis [19–22].
Its ability to generate electron–hole pairs by incident light
with appropriate wavelength and use them in redox reactions
makes TiO2 a favorable “green-chemical” catalyst [23]. The
anatase and rutile forms of TiO2 have relative large indirect band-gap (Eg) with 3.2 and 3.0 eV, respectively. Electron mobility is higher in anatase than in rutile. Unfortunately, TiO2 absorbs only 6% of solar light in the UV-range,
whereas 50% of the energy arriving to the Earth at sea level
is between 400 and 700 nm. Many research groups work on
developing TiO2-based photocatalysts that are excitable by
the lower energy part of electromagnetic spectrum, namely
the UV–Vis [24], visible [25] and NIR [26, 27] (near infrared) ranges. Today, several methods are available to prepare
TiO2 based visible light photocatalysts, but the ultimate high
performance material is yet to be discovered.
Doping is a well-known method to decrease the band
gap energy or create mid-gap states in the band structure
by incorporating foreign atoms into the lattice [28]. Such
dopants can be metallic [29, 30] or non-metallic [31, 32], as
well as anionic or cationic [33]. For example, the Cr doping of a rutile lattice facilitates its visible light excitation.
According to DFT calculations, this is due to TiO2 electrons
being excited either from the valence band (VB) into unoccupied Cr mid-gap states or from partially filled Cr mid-gap
states into the conduction band by incident visible light.
Gracia et al. [34] revealed that even though the Cr, Fe, V
and Co doping of anatase results in a red shift of its light
absorption spectrum, this process is not necessarily accompanied by the enhancement of the photocatalytic activity.
New levels due to dopants can either promote or hinder the
recombination of electron–hole pairs. Some dopants can act
as recombination centers, whereas doping with e.g. Fe3+ or
V4+ cations brings about longer excited charge carrier lifetimes than those observed in either undoped or Cr, Mn and
Co ion modified counterparts [24].
Anionic doping of TiO 2 is also an effective way to
change its electronic band structure. In 2001, Asahi et al.
reported on the nitrogen doping of TiO2 and its enhanced
visible light induced photocatalytic activity [35]. The number of publications in this field has increased dramatically
since Asahi’s pioneering work. Nevertheless, it is worth
noting that Sato et al. have published an interesting study
about NOx-doped TiO2 and its photocatalytic activity in
visible light back in 1986 [36]. Today this paper is generally agreed to be the very first N-doped TiO2 article for
13
Topics in Catalysis (2018) 61:1263–1273
visible light driven (VLD) photocatalysis. Anionic doping
by other elements, e.g. B, P, C and S can also tune the optical properties of TiO2 [28]. The general explanation for the
effectivity of anionic dopants is that such anions are less
electronegative than O, therefore, they push p-states from
the VB up into the band-gap when substituted into the
lattice. Although these dopants do not affect the thermal
stability of TiO2, they can be thermally removed from the
system during an annealing process [24]. Unfortunately,
the most widespread sol–gel synthesis methods typically
involve a final heat-treatment step to achieve well crystallized TiO2 [37].
The thermal stability of titanias depends on their structure. Anatase TiO2 turns into rutile around 600–700 °C [38].
Titanate nanotubes with trititanate structure transform easily
into anatase nanorods at ~ 400 °C, then into rutile at 600 °C.
The tubular morphology collapses into a non-layered one
between 150 and 200 °C but the one dimensional (1D)
structure is preserved. Moreover, TiONT is a metastable
material with structural water content [16]. The trititanate
to anatase phase transition is thermodynamically favored
under ambient conditions, but the transition itself takes at
least 1.5–2 years. The thermal stability of titanate nanowires (another 1D titanate nanostructure) is superior to that of
TiONTs [39, 40], but their low specific surface area and lack
of mesoporous channels make them inappropriate candidates
for ionic doping. Titanate nanowires can also stabilize metal
nanoparticles on their surface [4].
Nitrogen doping of TiO2 is a well-known approach to
create mid-gap states [41]. There are so called wet and dry
N doping methods. In the case of wet methods, either the
dopant source is mixed with the titania precursor solution
or the titania particles are mixed with the solution of the
dopant compound. Dry methods generally utilize a gas phase
dopant source and solid state titania, e.g. solid TiO2 kept in
NH3 gas flow at elevated temperature (400–600 °C) [42]. An
example for the wet method is stirring tetra-butyl titanate in
the presence of ammonia solution and calcining the dried
precursor at 350 °C or higher [43]. Different methods result
in different nitrogen sites within the titania structure. X-ray
photoelectron spectroscopic (XPS) investigations reveal that
there are two (or three) main nitrogen types. The peak at
396 eV binding energy in the N1s region corresponds to
the substitutional state mentioned above, where N substitutes O in the lattice. Some articles suggest that this is the
type of nitrogen responsible for the improved visible light
photocatalytic properties of doped TiO2 [24, 30]. The other
main N site has its XPS signal around ~ 400 eV. This is the
so-called interstitial or embedded N that can also decrease
the excitation wavelength. In this case reduced Ti3+ sites
stabilized by the N2− or N3− dopants are formed [44]. It
should be noted here that adsorbed N-containing specimens
also give rise to an XPS peak around 400 eV.
�Topics in Catalysis (2018) 61:1263–1273
In our previous study we prepared various nitrogen doped
titanium-oxide nanoparticles from protonated titanate nanotubes. The dopant source was NH3 gas generated in situ by
the thermal decomposition of urea in a closed autoclave in
the presence of TiONTs at 200 °C [45]. The structure and
morphology of doped TiONTs changed with the reaction
time. After 12 h the tubular trititanates were transformed
into nitrogen-doped anatase nanoparticles. A similar collapse was observed by Chang et al. in the case of NH4+
ion exchanged TiONT at elevated temperature [46]. Surface
NH4+ groups also form during the phase transition. The XPS
peak at 396 eV corresponding to Ti–N sites is missing from
these spectra, but the ~ 400 eV signal due to adsorbed NHx
(including NH3) was observed [41, 47].
Earlier Bertóti investigated N implantation into rutile
(110) TiO2 single crystal and other metal-oxide surfaces
via 1–5 keV N2+ bombardment [48, 49], which is a highly
refined method to investigate nitrogen incorporation into the
structure. An oxygen deficient surface formed due to the ionimplantation and metal oxinitride surface developed. The
amount of substituted N was equal to that of the reduced
oxygen in the lattice [50, 51].
The paramount importance of N-doped TiO2 in visible
light photocatalysis necessitates a paradigm shift in research.
Ad hoc doping studies need to be replaced by more systematic efforts. The present study is a step in this direction. We
present a comparative investigation on the effects of N2+ ion
implantation, N2 and NH3 plasma treatments on the structure
and morphology of titanate nanotubes and on the chemical
states of the built-in nitrogen. Results are compared with
those obtained by thermal nitridation where the dopants
were urea or NH4F.
2 Experimental
2.1 Synthesis of Titanate Nanotubes
Elongated titanate nanotubes were synthesized by the hydrothermal conversion of TiO2 (99.8% anatase, Sigma–Aldrich)
in highly alkaline media. In a typical process, 50 g TiO2
precursor was stirred in 1 L 10 M NaOH (99.3% NaOH,
Molar) solution for 1 h. The obtained white solid was kept
in a polytetrafluoroethylene (PTFE)-lined stainless steel
autoclave for 24 h at 130 °C. The reactor was rotated during
the synthesis at 3 rpm around its short axis. The product
was neutralized by washing with distilled water (2×) and
then protonated by washing with 0.01 M HCl solution several times to yield protonated titanate nanotubes (H2Ti3O7).
Finally, the remaining acid content was washed out from the
system with distilled water and the protonated nanotubes
were dried at 60 °C for 48 h in air.
1265
2.1.1 Nitrogen Doping
2.1.1.1 Nitrogen Incorporation by N2+ Ion Bombardment
N2 and NH3 Plasma Treatment Nitrogen was incorporated
into titanate nanotubes by N2+ bombardment and from N2
and NH3 plasma. Ion bombardment was performed within
the analysis chamber of the XPS instrument, using a Kratos MacroBeam ion gun fed with high (5N) purity N2. The
ion beam (spot size of about 2 mm, non mass-selected,
incident at mean angle 55° to the surface normal) was rastered over the sample area of about 8 × 8 mm2. The N2+
ions were accelerated by 3 kV, producing N projectiles of
1.5 keV energy. The plasma treatment was performed in
the stainless steel sample preparation chamber of the XPS
instrument (base pressure < 1 × 10⁻⁴ Pa). The high purity N2
(5N) or NH3 flow of a few ml/min (STP) was regulated by a
bleeding valve that set the pressure to 5–7 Pa. Constant RF
power of 100 W at 13.56 MHz was applied through a matching circuit to a copper coil fixed on the outside of a glass
dome attached to the preparation chamber. The sample bias
was set to negative values between 100 and 300 V. Treatment time was varied from 5 to 30 min. The sample was
transferred to the analysis chamber after treatment without
exposing it to the ambient air.
2.1.1.2 Thermally Activated Nitrogen Incorporation
Method Two kinds of thermally activated doping processes were applied. Firstly, urea was used as dopant source
as reported earlier [45]. In this setup, 12 g urea (99.46%,
Molar) and 1 g titanate nanotubes were kept in a PTFE-lined
stainless steel autoclave, where the two compounds were
separated from each other by a cylindrical PTFE spacer. The
system was kept at 200 °C for 24 h. The thermal decomposition of urea yielded the NH3 gas that acted as the effective
nitrogen dopant source.
The second thermal doping method was similar to the
previous one. The same system was used to modify the
nanotubes, however, 15 g NH4F was used instead of urea
to dope 0.5 g of titanate nanotubes. In this case, thermal
decomposition simultaneously yields HF and NH3 gas that
create a potentially more aggressive doping environment.
2.2 Characterization
2.2.1 TEM and SEM Investigation
The morphology of pristine TiONTs and thermally doped
nanostructures was analyzed by transmission electron
microscopy (TEM) using an FEI Tecnai G 2 20 X-Twin
instrument operated at 200 kV accelerating voltage. Samples were drop-casted from their ethanol suspensions onto
copper mounted holey carbon grids. The morphological
changes of NH3 plasma modified TiONTs on Al foil were
13
�1266
studied by scanning electron microscopy using a HITACHI
S-4700 Type II instrument operated at 30 kV accelerating
voltage.
2.2.2 XPS Analysis
X-ray photoelectron spectra of N2+ ion bombarded and N2
and NH3 plasma treated titanates were recorded on a Kratos XSAM 800 spectrometer operating in fixed analyzer
transmission mode, using Mg Kα1,2 (1253.6 eV) excitation. The pressure in the analysis chamber was lower than
1 × 10⁻⁷ Pa. Survey spectra were recorded in the kinetic
energy range of 150–1300 eV in 0.5 eV steps. Photoelectron lines of the main constituent elements, i.e. O1s, Ti2p,
N1s and C1s, were recorded in 0.1 eV steps and 1 s dwell
time. Spectra were referenced to the energy of the C1s line
of the carbon contamination, set at 284.6 ± 0.1 eV binding
energy (B.E.). A Gaussian–Lorentzian peak shape (70/30
ratio) was used for peak decomposition. Quantitative
analysis, based on peak area intensities after removal of
the Shirley-type background, was performed by the Kratos Vision 2 and by the XPS MultiQuant programs [52,
53] using the experimentally determined photo-ionization cross-section data of Evans et al. and the asymmetry
parameters of Reilman et al. [54]. In all cases, unless otherwise stated, the conventional infinitely thick layer model
was employed, where all components are supposed to be
homogeneously distributed within the sampling depth
detected by XPS. Chemical shifts, representing different
bonding states of the nitrogen and oxygen to titanium,
were evaluated by applying an accurate peak decomposition procedure. In order to prepare samples for the above
treatments, ethanol suspension of TiONT was drop casted
onto Al foil to obtain a consistent film-like structure with
homogenous nanotube distribution. Films were dried at
100 °C to remove the bulk water from the surface.
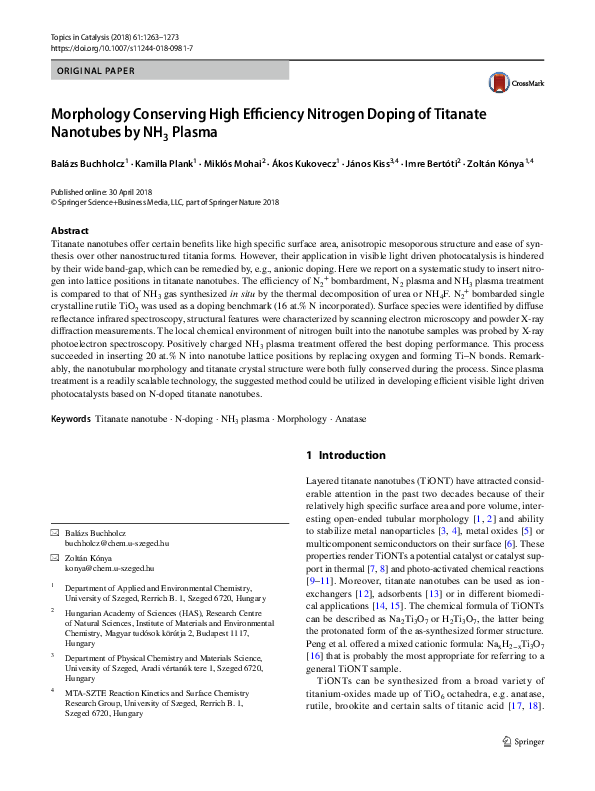
Fig. 1 TEM images of pristine
protonated TiONTs in different
magnifications (a, b). The inner
pore channels of nanotubes are
clearly seen in panel b
13
Topics in Catalysis (2018) 61:1263–1273
2.2.3 XRD Analysis
The crystal structure of TiONTs before and after different
nitridation processes was investigated using a Rigaku Miniflex powder X-ray diffractometer with Cu Kα irradiation
(λ = 1.5418 Å) operating at 30 kV and 15 mA. The scanning
rate was 4°/min in the 5–60° 2θ range.
2.2.4 DRIFTS Measurements
Infrared spectroscopic measurements were carried out in an
Agilent Cary-670 FTIR spectrometer equipped with a Harrick Praying Mantis diffuse reflectance attachment. The sample holder had BaF2 windows in the IR light path. The spectrometer was purged with dry nitrogen. Typically, 32 scans
were recorded at a spectral resolution of 2 cm−1. Either the
spectrum of the pristine nanotubes or a commercial anatase
reference (Hombikat UV-100) was used as background.
3 Results and Discussion
Figure 1 shows pristine protonated TiONTs at different
magnifications. The as-synthesized elongated nanotubes are
open-ended with a layered, rolled-up structure. In Fig. 1b the
inner pore channel of these nanotubular materials is visible.
The average TiONT length is 100–130 nm, the inner diameter is 5–6 nm and the outer diameter is 11–12 nm.
Previously we investigated the urea based ammonia doping of titanate nanotubes, similarly to those reported in [28,
35, 46]. During this process we observed that nanotubes
completely morph into 25 nm long isotropic (cuboid and
octahedral) nanoparticles. In Fig. 2. TEM images of pristine
TiONT (a), and urea based NH3 doped nanotubes (b) are
compared. We successfully reproduced our previous results
as demonstrated in Fig. 2b. NH4F treatment also resulted
�Topics in Catalysis (2018) 61:1263–1273
1267
Fig. 2 TEM images of pristine titanate nanotubes (a) and after urea (b) and NH4F (c) treatment at 200 °C
in the collapse of the nanotubes. It seems plausible that the
acidic media enhanced TiONT degradation in this case [55].
As mentioned earlier, single crystal TiO2 (scTiO2) favors
N embedding into its lattice upon N2+ ion bombardment
[49]. XPS results corresponding to this ion implantation
method are depicted in Fig. 3. The signal at 396.7 eV is
characteristic for substitutional nitrogen bonded to metal.
Peaks at 397.3 and 398.3 eV are due to N-containing ions
in O–Ti–N bond on the surface (Fig. 3b). Reduced titania
states are also formed during nitridation. Both Ti2+ and Ti3+
exist under these conditions [48]. This nitridation process
took 20 min and the overall built-in nitrogen content was
16.1 at.%.
This experiment was repeated using TiONTs instead of
scTiO2. Interestingly, only 2.7 at.% nitrogen content was
achieved by the similar 20 min long N2+ bombardment process. Figure 4a shows a doping-induced change in the Ti2p
XP line shape. The small shoulder at around 456.0 eV is
characteristic for the Ti3+ state. Figure 4b reveals N at B.E.
of 396.3 eV that is, in position substituting lattice oxygen
[28, 35, 56–58], while other lines between 398 and 402 eV
are characteristic for nitrogen trapped in different lattice
defects surrounded by varying number of oxygens. Features at 398–400 eV are due to interstitial N [47], while
photoemission peaks above 400 eV are typically attributed
to either embedded N2 or to nitrate/nitrite species [28].
Since the extent of nitrogen incorporation into TiONTs
by N2+ bombardment is limited to low levels (approximately
3 at.%), the application of plasma treatment was considered.
The first dopant source was N2 plasma at 600 V bias voltage
for 20 min. The positively charged N2+ plasma ions dissociate to two N atoms with an average energy of 300 eV
each upon hitting the surface, thus the process is capable of
building various types of nitrogen into the lattice. Figure 5a
shows that essentially no reduced Ti states appear in this
case, which also indicates that N incorporation in substitutional position is minimal. Indeed, only a weak N signal at
B.E. 396 eV is observable (Fig. 5b) and N–O–Ti bonds are
Fig. 3 XP lines of Ti2p (a) and N1s (b) of scTiO2 before and after N2+ implantation process
13
�1268
Topics in Catalysis (2018) 61:1263–1273
Fig. 4 XP lines of Ti2p (a) and N1s (b) of TiONT before and after N2+ implantation
Fig. 5 XP lines of Ti2p (a) and N1s (b) of TiONT before and after N2 plasma treatment process
formed besides other entrapped N species appearing in the
398–402 eV B.E. range. The explanation to the low degree
of formation of Ti–N via ion bombardment and N2 plasma
treatment on TiONTs lies in the structure of the nanotubes.
Unlike single crystal titania, titanates—even in their protonated forms—contain significant amounts of OH groups and
structural water [5]. We suggest that this oxygen rich local
surface environment hinders substitutional N incorporation
in titanate nanotubes compared to single crystal TiO2 [41].
To verify this hypothesis, TiONTs were treated in positively charged NH3 plasma for 10 and 30 min at 300 V bias
voltage. This bias condition ensured that the energy of N
atoms actually interacting with the surface closely matched
that relevant for N2 plasma at 600 V bias. Figure 6a, b
shows that indeed, more nitrogen is incorporated into the
nanotubes from NH3 plasma then from N2 plasma. The
achieved nitrogen content increased by one order of magnitude to 20.4 at.%. Three types of nitrogen are observable
in the N1s region: the 396 eV photoemission belongs to the
13
substitutional (Ti–N) form, while the peaks at 398–399.5 and
400.5 eV can be attributed to different NH species [56, 59]
and/or interstitial N [47]. The Ti2p XP lines also changed
during the process: the Ti3+ peak developed at 456.0 eV
indicating a successful, Ti–N bond forming N incorporation.
Figure 6c, d depict XP spectra of TiONTs N-doped by
NH3 generated in situ by urea decomposition. There are
no significant differences in the Ti2p region between pristine and doped samples and one dominating type of N is
observable in the N 1 s region at about 400 eV BE. This
one is characteristic for N species built, most probably, into
different defect sites surrounded by oxygen (400 eV B.E.).
Such nitrogen bonding states were tentatively assigned to
an N⋯H complex interstitially bound in the TiO2 lattice
[56, 57] and linked to the enhanced photocatalytic activity,
even though the observed photo-threshold energy decrease
was associated earlier exclusively with substitutional N at
396.5 eV B.E [35]. N doping was suggested to introduce
localized N2p states within the band gap close to the top
�Topics in Catalysis (2018) 61:1263–1273
1269
Fig. 6 XP lines of Ti2p and N1s of TiONT before and after NH3 plasma nitridation (a, b) and urea based thermic doping (c, d) process
of the valence band, facilitating the production of oxygen
vacancies and Ti3d states within the bandgap at elevated
temperatures [60]. In the case of NH4F treatment no photoemission at ~ 396 eV due to subtitutional N was detected.
The Ti2p line remained unaltered.
Summarizing, XPS measurements depicted in Fig. 6.
suggest that NH3 plasma treatment is the most effective
way to incorporate substitutional nitrogen into the lattice
of TiONTs.
Fourier transform infrared spectroscopy (DRIFTS)
was utilized to identify surface specimens formed during the doping process, i.e. to reveal the nature of the
so-called “adsorbed nitrogen” species. Figure 7 depicts
the DRIFTS spectra of TiONTs treated in NH3 plasma for
30 min, as well as their urea-based and NH4F thermally
doped counterparts. IR bands were observed after NH 3
plasma treatment at around 3000, 1700–1560, 1434, and
1257 cm−1. When urea was the precursor molecule, the
same peaks with much higher intensities were detected
between 3200–2800 cm −1 (3201, 3037, 2967, 2928, and
2854 cm−1) and 1700–1200 cm−1 (1703, 1627, 1563, 1443,
and 1257 cm−1). A very similar IR spectrum was recorded
earlier on ammonium trititanate nanotubes (NH4TNT) produced from sodium trititanate nanotubes by ion exchange
using NH4NO3 [46]. The observed peaks were assigned to
the N–H steching mode and the asymmetric bending mode
of NH 4+. Similar NH vibration features were observed
after NH3 adsorption on TiO2 [61]. Bands at 1703, 1563
and 1257 cm−1 for NH4 species were detected after adsorption of NH4F on TNT (Fig. 7). Summarizing, the DRIFTS
experiments confirmed the XPS results insofar as Ti–N
formation is always accompanied by NH4+ group development in the studied processes [58]. It is important to
emphasize that no bands indicative of nitrosyl species
were detected in the 1950–1850 cm−1 range after NH 3
plasma treatment [62].
13
�1270
Topics in Catalysis (2018) 61:1263–1273
The characteristic reflections are indicated in the figure.
Characteristic reflections of TiONT (2θ = 9.66°, 24.49°,
28.08° and 48.5°) match the literature data well [16]. The
first broad reflection corresponds to the 0.74 nm interlayer
distance between the rolled-up titanate sheet layers. It is
clear that none of the plasma treatments affects the trititanate structure and there are no new phases in the system. In
contrast, titanate reflections disappeared when either of the
thermal doping processes was attempted, and new reflections with Miller indices of (101), (004), (200), (105), (211)
and (204) appeared at 2θ = 25.45°, 37.06°, 37.89°, 38.74°,
48.22°, 53.97°, and 55.17°, respectively. This confirms that
the trititanate structure recrystallized into anatase TiO2 during the synthesis. However, the crystallinity degree of commercial anatase is higher than that of its thermal doping
derived counterparts.
4 Conclusions
Fig. 7 DRIFT spectra of a NH3 plasma treated sample and two thermally doped (urea and NH4F decomposition) TiONT samples
Figure 8 depicts the morphology of pristine and N-doped
titanate nanotubes on Al foil. It is remarkable that even
though NH3 plasma treatment was the best way to impose
structural changes on TiONTs by incorporating nitrogen
into the lattice, it left the tubular morphology intact. Indeed,
SEM images in Fig. 8b, c. do not show any signs of nanotube
morphing or collapse—the tubular structure was maintained
during and after nitrogen incorporation.
The structure conserving nature of NH3 plasma doping
was confirmed by analyzing the crystallinity of the doped
samples using XRD. Figure 9 depicts the XRD patterns of
TiONT before and after the different nitridation processes.
We presented a systematic study on N-doping in protonated
titanate nanotubes utilizing N2+ bombardment, thermal and
plasma based methods. NH4+ was detected on the surface
in all cases. Single crystalline rutile TiO2 bombarded with
N2+ served as a doping benchmark. Methods based on the
thermal decomposition of urea or NH4F generate NH3 in
situ, but neither of them is capable of inserting substitutional
nitrogen into the lattice. On the other hand, N2+ bombardment as well as N2 and NH3 plasma based methods can all
yield N-doped nanotubes with the desired Ti–N bonds. This
was clearly confirmed by monitoring the N XPS peak at
around 396 eV, which is characteristic for nitrogen in this
position and also by a low B.E. shoulder on the Ti2p line.
The extent of nitridation depends on the type of the plasma
and the duration of the treatment. Positively charged NH3
plasma was found to be the most powerful way to incorporate nitrogen into the nanotube lattice in over 20 at.% loading. Surprisingly, this incorporation technique left both the
Fig. 8 FE-SEM images of pristine (a) and NH3 plasma modified titanate nanotubes (b–c) on Al foil. The scale bar corresponds to 500 nm in all
three images
13
�Topics in Catalysis (2018) 61:1263–1273
1271
7.
8.
9.
10.
Fig. 9 XRD patterns of titanate nanotubes before and after different
nitridation processes
tubular morphology and the titanate crystal structure of the
nanotubes intact. Considering the high specific surface area
of titanate nanotubes as well as the technological feasibility
and scalability of the NH3 plasma treatment, we believe that
the reported results represent a step forward in the systematic
design of highly efficient titanate based VLD photocatalysts.
11.
12.
13.
14.
Acknowledgements The financial support of the Hungarian Research
Development and Innovation Office through Grants NKFIH OTKA
K 126065 (Á.K.), K 120115 (Z.K.) and GINOP-2.3.2-15-2016-0013
(Á.K., Z.K.) is acknowledged.
References
1. Bavykin DV, Parmon VN, Lapkin AA, Walsh FC (2004) The
effect of hydrothermal conditions on the mesoporous structure
of TiO2 nanotubes. J Mater Chem 14(22):3370–3377. https://doi.
org/10.1039/b406378c
2. Kasuga T, Hiramatsu M, Hoson A, Sekino T, Niihara K (1998)
Formation of titanium oxide nanotube. Langmuir 14(12):3160–
3163. https://doi.org/10.1021/la9713816
3. Pótári G, Madarász D, Nagy L, László B, Sápi A, Oszkó A, Kukovecz A, Erdohelyi A, Kónya Z, Kiss J (2013) Rh-induced support
transformation phenomena in titanate nanowire and nanotube
catalysts. Langmuir 29(9):3061–3072. https://doi.org/10.1021/
la304470v
4. Kukovecz Á, Kordás K, Kiss J, Kónya Z (2016) Atomic scale
characterization and surface chemistry of metal modified titanate
nanotubes and nanowires. Surf Sci Rep 71(3):473–546. https://
doi.org/10.1016/j.surfrep.2016.06.001
5. Buchholcz B, Haspel H, Boldizsár T, Kukovecz Á, Kónya Z
(2017) pH-regulated antimony oxychloride nanoparticle formation on titanium oxide nanostructures: a photocatalytically active
heterojunction. CrystEngComm 19(10):1408–1416. https://doi.
org/10.1039/c6ce02340a
6. Buchholcz B, Haspel H, Oszkó A, Kukovecz A, Kónya Z (2017)
Titania nanotube stabilized BiOCl nanoparticles in visible-light
15.
16.
17.
18.
19.
20.
21.
22.
23.
photocatalysis. RSC Adv 7(27):16410–16422. https ://doi.
org/10.1039/c6ra28490f
Sluban M, Cojocaru B, Parvulescu VI, Iskra J, Korošec RC,
Umek P (2017) Protonated titanate nanotubes as solid acid catalyst for aldol condensation. J Catal 346:161–169. https ://doi.
org/10.1016/j.jcat.2016.12.015
Kuwahara Y, Fujie Y, Yamashita H (2017) Poly-(ethyleneimine)tethered Ir complex catalyst immobilized in titanate nanotubes for
hydrogenation of CO2 to formic acid. ChemCatChem 9(11):1906–
1914. https://doi.org/10.1002/cctc.201700508
Aouadi I, Touati H, Tatibouët J-M, Bergaoui L (2017) Titanate
nanotubes as ethanol decomposition catalysts: effect of coupling
photocatalysis with non-thermal plasma. J Photochem Photobiol A
346:485–492. https://doi.org/10.1016/j.jphotochem.2017.06.030
Sandoval A, Hernández-Ventura C, Klimova TE (2017) Titanate
nanotubes for removal of methylene blue dye by combined adsorption and photocatalysis. Fuel 198:22–30. https://doi.org/10.1016/j.
fuel.2016.11.007
László B, Baán K, Varga E, Oszkó A, Erdőhelyi A, Kónya Z,
Kiss J (2016) Photo-induced reactions in the CO2-methane system on titanate nanotubes modified with Au and Rh nanoparticles. Appl Catal B 199:473–484. https://doi.org/10.1016/j.apcat
b.2016.06.057
Bavykin DV, Walsh FC (2007) Kinetics of alkali metal ion
exchange into nanotubular and nanofibrous titanates. J Phys Chem
C 111(40):14644–14651. https://doi.org/10.1021/jp073799a
Bavykin DV, Lapkin AA, Plucinski PK, Friedrich JM, Walsh FC
(2005) Reversible storage of molecular hydrogen by sorption into
multilayered TiO2 nanotubes. J Phys Chem B 109(41):19422–
19427. https://doi.org/10.1021/jp0536394
Paris J, Bernhard Y, Boudon J, Heintz O, Millot N, Decréau R
(2015) Phthalocyanine–titanate nanotubes: a promising nanocarrier detectable by optical imaging in the so-called imaging
window. RSC Adv 5(9):6315–6322. https://doi.org/10.1039/c4ra1
3988g
Yang D, Wang X, Ai Q, Shi J, Jiang Z (2015) Performance comparison of immobilized enzyme on the titanate nanotube surfaces
modified by poly-(dopamine) and poly-(norepinephrine). RSC
Adv 5(53):42461–42467. https://doi.org/10.1039/c5ra02420j
Chen Q, Du G, Zhang S, Peng L-M (2002) The structure of trititanate nanotubes. Acta Crystallogr Sect B 58(4):587–593. https
://doi.org/10.1107/S0108768102009084
Dmitry V, Walsh C (2010) Titanate and titania nanotubes: synthesis, properties and applications. Royal Society of Chemisty,
Cambridge, https://doi.org/10.1039/9781849730778
Kukovecz Á, Hodos M, Horváth E, Radnóczi G, Kónya Z, Kiricsi
I (2005) Oriented crystal growth model explains the formation of
titania nanotubes. J Phys Chem B 109(38):17781–17783. https://
doi.org/10.1021/jp054320m
Diebold U (2003) The surface science of titanium-dioxide.
Surf Sci Rep 48(5):53–229. https ://doi.org/10.1016/S0167
-5729(02)00100-0
Wang L, Sasaki T (2014) Titanium-oxide nanosheets: graphene
analogues with versatile functionalities. Chem Rev 114(19):9455–
9486. https://doi.org/10.1021/cr400627u
Houas A, Lachheb H, Ksibi M, Elaloui E, Guillard C, Herrmann
J-M (2001) Photocatalytic degradation pathway of methylene blue
in water. Appl Catal B 31(2):145–157. https://doi.org/10.1016/
S0926-3373(00)00276-9
Thiruvenkatachari R, Vigneswaran S, Moon IS (2008) A review
on UV/TiO2 photocatalytic oxidation process (Journal Review).
Korean J Chem Eng 25(1):64–72. https://doi.org/10.1007/s1181
4-008-0011-8
Halasi G, Schubert GB, Solymosi F (2012) Photodecomposition
of formic acid on N-doped and metal-promoted TiO2 production
13
�1272
24.
25.
26.
27.
28.
29.
30.
31.
32.
33.
34.
35.
36.
37.
38.
39.
40.
41.
Topics in Catalysis (2018) 61:1263–1273
of CO-free H2. J Phys Chem C 116(29):15396–15405. https://doi.
org/10.1021/jp3030478
Kumar SG, Devi LG (2011) Review on modified TiO2 photocatalysis under UV/visible light: selected results and related mechanisms on interfacial charge carrier transfer dynamics. J Phys Chem
A 115(46):13211–13241. https://doi.org/10.1021/jp204364a
Rehman S, Ullah R, Butt A, Gohar N (2009) Strategies of making
TiO2 and ZnO visible light active. J Hazard Mater 170(2):560–
569. https://doi.org/10.1016/j.jhazmat.2009.05.064
Qin W, Zhang D, Zhao D, Wang L, Zheng K (2010) Near-infrared photocatalysis based on YF3: Yb3+, Tm3+/TiO2 core/shell
nanoparticles. Chem Commun 46(13):2304–2306. https ://doi.
org/10.1039/b924052g
Tang Y, Di W, Zhai X, Yang R, Qin W (2013) NIR-responsive
photocatalytic activity and mechanism of NaYF4: Yb, Tm@ TiO2
core–shell nanoparticles. ACS Catal 3(3):405–412. https://doi.
org/10.1021/cs300808r
Henderson MA (2011) A surface science perspective on photocatalysis. Surf Sci Rep 66(6):185–297. https://doi.org/10.1016/j.surfr
ep.2011.01.001
Park MS, Kwon S, Min B (2002) Electronic structures of doped
anatase TiO2: Ti1–xMxO2 (M = Co, Mn, Fe, Ni). Phys Rev B
65(16):161201. https://doi.org/10.1103/PhysRevB.65.161201
Kočí K, Matějů K, Obalová L, Krejčíková S, Lacný Z, Plachá D,
Čapek L, Hospodková A, Šolcová O (2010) Effect of silver doping on the TiO2 for photocatalytic reduction of CO2. Appl Catal B
96(3):239–244. https://doi.org/10.1016/j.apcatb.2010.02.030
Dozzi MV, Selli E (2013) Doping TiO2 with p-block elements:
effects on photocatalytic activity. J Photochem Photobiol C 14:13–
28. https://doi.org/10.1016/j.jphotochemrev.2012.09.002
Devi LG, Kavitha R (2013) A review on non metal ion doped titania for the photocatalytic degradation of organic pollutants under
UV/solar light: role of photogenerated charge carrier dynamics
in enhancing the activity. Appl Catal B 140:559–587. https://doi.
org/10.1016/j.apcatb.2013.04.035
Serpone N (2006) Is the band gap of pristine TiO2 narrowed by
anion- and cation-doping of titanium dioxide in second-generation
photocatalysts? J Phys Chem B 110(48):24287–24293. https://doi.
org/10.1021/jp065659r
Gracia F, Holgado JP, Caballero A, Gonzalez-Elipe AR (2004)
Structural, optical, and photoelectrochemical properties of Mn+–
TiO2 model thin film photocatalysts. J Phys Chem B 108(45):17466–
17476. https://doi.org/10.1021/jp0484938
Asahi R, Morikawa T, Ohwaki T, Aoki K, Taga Y (2001) Visiblelight photocatalysis in nitrogen-doped titanium oxides. Science
293(5528):269–271. https://doi.org/10.1126/science.1061051
Sato S (1986) Photocatalytic activity of NOx-doped TiO2 in the visible light region. Chem Phys Lett 123(1–2):126–128. https://doi.
org/10.1016/0009-2614(86)87026-9
Jagadale TC, Takale SP, Sonawane RS, Joshi HM, Patil SI, Kale
BB, Ogale SB (2008) N-doped TiO2 nanoparticle based visible light
photocatalyst by modified peroxide sol–gel method. J Phys Chem C
112(37):14595–14602. https://doi.org/10.1021/jp803567f
Hanaor DA, Sorrell CC (2011) Review of the anatase to rutile phase
transformation. J Mater Sci 46(4):855–874. https://doi.org/10.1007/
s10853-010-5113-0
Buchholcz B, Varga E, Varga T, Plank K, Kiss J, Kónya Z (2017)
Structure and stability of boron doped titanate nanotubes and
nanowires. Vacuum 138:120–124. https://doi.org/10.1016/j.vacuu
m.2016.11.038
Pusztai P, Puskás R, Varga E, Erdőhelyi A, Kukovecz Á, Kónya Z,
Kiss J (2014) Influence of gold additives on the stability and phase
transformation of titanate nanostructures. Phys Chem Chem Phys
16(48):26786–26797. https://doi.org/10.1039/c4cp04084h
Halasi G, Schubert G, Solymosi F (2012) Comparative study on
the photocatalytic decomposition of methanol on TiO2 modified
13
42.
43.
44.
45.
46.
47.
48.
49.
50.
51.
52.
53.
54.
55.
56.
57.
58.
59.
by N and promoted by metals. J Catal 294:199–206. https://doi.
org/10.1016/j.jcat.2012.07.020
Joung S-K, Amemiya T, Murabayashi M, Itoh K (2006) Relation
between photocatalytic activity and preparation conditions for nitrogen-doped visible light-driven TiO2 photocatalysts. Appl Catal A
312:20–26. https://doi.org/10.1016/j.apcata.2006.06.027
Wang Z, Cai W, Hong X, Zhao X, Xu F, Cai C (2005) Photocatalytic
degradation of phenol in aqueous nitrogen-doped TiO2 suspensions
with various light sources. Appl Catal B 57(3):223–231. https://doi.
org/10.1016/j.apcatb.2004.11.008
Di Valentin C, Finazzi E, Pacchioni G, Selloni A, Livraghi S,
Paganini MC, Giamello E (2007) N-doped TiO2: theory and experiment. Chem Phys 339(1):44–56. https://doi.org/10.1016/j.chemp
hys.2007.07.020
Buchholcz B, Haspel H, Kukovecz Á, Kónya Z (2014) Low-temperature conversion of titanate nanotubes into nitrogen-doped TiO2
nanoparticles. CrystEngComm 16(32):7486–7492. https ://doi.
org/10.1039/c4ce00801d
Chang J-C, Tsai W-J, Chiu T-C, Liu C-W, Chao J-H, Lin C-H (2011)
Chemistry in a confined space: characterization of nitrogen-doped
titanium oxide nanotubes produced by calcining ammonium trititanate nanotubes. J Mater Chem 21(12):4605–4614. https://doi.
org/10.1039/c0jm03058a
Maeda M, Watanabe T (2006) Visible light photocatalysis of
nitrogen-doped titanium oxide films prepared by plasma-enhanced
chemical vapor deposition. J Electrochem Soc 153(3):C186-C189.
https://doi.org/10.1149/1.2165773
Bertóti I (2012) Nitrogen modified metal oxide surfaces. Catal
Today 181(1):95–101. https://doi.org/10.1016/j.cattod.2011.06.017
Sullivan JL, Saied SO, Bertoti I (1991) Effect of ion and neutral
sputtering on single crystal TiO2. Vacuum 42(18):1203–1208. https
://doi.org/10.1016/0042-207X(91)90131-2
Bertóti I, Kelly R, Mohai M, Tóth A (1992) A possible solution to
the problem of compositional change with ion-bombarded oxides.
Surf Interface Anal 19(1–12):291–297. https://doi.org/10.1002/
sia.740190155
Bertóti I, Kelly R, Mohai M, Tóth A (1993) Response of oxides to
ion bombardment: the difference between inert and reactive ions.
Nuclear Instrum Methods Phys Res Sect B 80–81 (Part 2):1219–
1225. https://doi.org/10.1016/0168-583X(93)90770-7
Mohai M (2004) XPS MultiQuant: multimodel XPS quantification software. Surf Interface Anal 36(8):828–832. https ://doi.
org/10.1002/sia.1775
Mohai M, Bertoti I (2004) Calculation of overlayer thickness on
curved surfaces based on XPS intensities. Surf Interface Anal
36(8):805–808. https://doi.org/10.1002/sia.1769
Reilman RF, Msezane A, Manson ST (1976) Relative intensities in photoelectron spectroscopy of atoms and molecules. J
Electron Spectrosc Relat Phenom 8(5):389–394. https ://doi.
org/10.1016/0368-2048(76)80025-4
Bavykin DV, Friedrich JM, Lapkin AA, Walsh FC (2006) Stability of aqueous suspensions of titanate nanotubes. Chem Mater
18(5):1124–1129. https://doi.org/10.1021/cm0521875
Diwald O, Thompson TL, Zubkov T, Walck SD, Yates JT (2004)
Photochemical activity of nitrogen-doped rutile TiO2(110) in visible
light. J Phys Chem B 108(19):6004–6008. https://doi.org/10.1021/
jp031267y
Thompson TL, Yates JT (2006) Surface science studies of the photoactivation of TiO2—new photochemical processes. Chem Rev
106(10):4428–4453. https://doi.org/10.1021/cr050172k
Beranek R, Kisch H (2008) Tuning the optical and photoelectrochemical properties of surface-modified TiO2. Photochem Photobiol
Sci 7(1):40–48. https://doi.org/10.1039/B711658F
Souto S, Alvarez F (1997) The role of hydrogen in nitrogen-containing diamondlike films studied by photoelectron spectroscopy. Appl
Phys Lett 70(12):1539–1541. https://doi.org/10.1063/1.118611
�Topics in Catalysis (2018) 61:1263–1273
60. Batzill M, Morales EH, Diebold U (2006) Influence of nitrogen
doping on the defect formation and surface properties of TiO2 rutile
and anatase. Phys Rev Lett 96(2):026103. https://doi.org/10.1103/
PhysRevLett.96.026103
61. Jung SM, Grange P (2000) The investigation of mechanism of
SCR reaction on a TiO2-SO42– catalyst by DRIFTS. Appl Catal B
27(1):L11-L16. https://doi.org/10.1016/S0926-3373(00)00145-4
1273
62. Ramis G, Busca G, Lorenzelli V, Forzatti P (1990) Fourier transform infrared study of the adsorption and coadsorption of nitric
oxide, nitrogen dioxide and ammonia on TiO2 anatase. Appl Catal
64:243–257. https://doi.org/10.1016/S0166-9834(00)81564-X
13
�
 Zoltan Konya