Anal. Chem. 2009, 81, 3911–3918
Contributions by a Novel Edge Effect to the
Permselectivity of an Electrosynthesized Polymer
for Microbiosensor Applications
Sharon A. Rothwell,† Michael E. Kinsella,† Zainiharyati M. Zain,†,‡ Pier A. Serra,†,§
Gaia Rocchitta,†,§ John P. Lowry,| and Robert D. O’Neill*,†
UCD School of Chemistry and Chemical Biology, University College Dublin, Belfield, Dublin 4, Ireland, Pusat
Pengajian Sains Kimia, Universiti Sains Malaysia, Pulau Pinang, Malaysia, Department of Neuroscience, Medical
School, University of Sassari, Viale S. Pietro 43/b, 07100 Sassari, Italy, and Department of Chemistry, National
University of Ireland, Maynooth, Co. Kildare, Ireland
Pt electrodes of different sizes (2 × 10⁻⁵-2 × 10⁻² cm2)
and geometries (disks and cylinders) were coated with
the ultrathin non-conducting form of poly(o-phenylenediamine), PPD, using amperometric electrosynthesis.
Analysis of the ascorbic acid (AA) and H2O2 apparent
permeabilities for these Pt/PPD sensors revealed that
the PPD deposited near the electrode insulation (Teflon or glass edge) was not as effective as the bulk
surface PPD for blocking AA access to the Pt substrate.
This discovery impacts on the design of implantable
biosensors where electrodeposited polymers, such as
PPD, are commonly used as the permselective barrier
to block electroactive interference by reducing agents
present in the target medium. The undesirable “edge
effect” was particularly marked for small disk electrodes which have a high edge density (ratio of PPDinsulation edge length to electrode area), but was
essentially absent for cylinder electrodes with a length
of >0.2 mm. Sample biosensors, with a configuration
based on these findings (25 µm diameter Pt fiber
cylinders) and designed for brain neurotransmitter
L-glutamate, behaved well in vitro in terms of Glu
sensitivity and AA blocking.
The design of biosensors for implantation in functioning
biological tissues is an important area of research with significant
socioeconomic impact.1-4 Depending on the target analyte,
different signal transduction pathways have been exploited in the
design of enzyme-based biosensors, including direct oxidation of
* To whom correspondence should be addressed. E-mail: robert.oneill@ucd.ie.
Fax: +353-1-7161178. Phone: +353-1-7162314.
†
University College Dublin.
‡
Universiti Sains Malaysia.
§
University of Sassari.
|
National University of Ireland, Maynooth.
(1) Wang, J. Chem. Rev. 2008, 108, 814–825.
(2) O’Neill, R. D.; Lowry, J. P.; Rocchitta, G.; McMahon, C. P.; Serra, P. A.
Trends Anal. Chem. 2008, 27, 78–88.
(3) Grieshaber, D.; MacKenzie, R.; Voros, J.; Reimhult, E. Sensors 2008, 8,
1400–1458.
(4) Privett, B. J.; Shin, J. H.; Schoenfisch, M. H. Anal. Chem. 2008, 80, 4499–
4517.
10.1021/ac900162c CCC: $40.75 2009 American Chemical Society
Published on Web 04/16/2009
reduced oxidases,5-7 dehydrogenase chemistries,8-10 redox
mediators,11-13 and spectrophotometric approaches.14-16 However, “first generation” electrochemical biosensors, based on
reactions 1-3, remain the most common design for many
applications.1,2,17-19 The majority of these are oxidase-based
devices designed to operate in amperometric mode, detecting
H2O2 generated by the reaction of the co-substrate (dioxygen)
with the reduced form of the enzyme.
Substrate + Ox/FAD f Products + Ox/FADH2
(1)
Ox/FADH2 + O2 f Ox/FAD + H2O2
(2)
H2O2 f O2 + 2H+ + 2e-
(3)
First-generation biosensors in general, and especially those
designed for tissue implantation,20-24 must be capable of effective
rejection of electroactive interference by endogenous reducing
agents in the target medium because these devices are normally
operated at a high applied overpotential for efficient H2O2
(5)
(6)
(7)
(8)
(9)
(10)
(11)
(12)
(13)
(14)
(15)
(16)
(17)
(18)
(19)
(20)
(21)
(22)
(23)
(24)
Bernhardt, P. V. Aust. J. Chem. 2006, 59, 233–256.
Xu, Z.; Chen, X.; Dong, S. J. Trends Anal. Chem. 2006, 25, 899–908.
Murphy, L. Curr. Opin. Chem. Biol. 2006, 10, 177–184.
Stoica, L.; Ludwig, R.; Haltrich, D.; Gorton, L. Anal. Chem. 2006, 78,
393–398.
Tang, X. J.; Xie, B.; Larsson, P. O.; Danielsson, B.; Khayyami, M.;
Johansson, G. Anal. Chim. Acta 1998, 374, 185–190.
Cosford, R. J. O.; Kuhr, W. G. Anal. Chem. 1996, 68, 2164–2169.
Kuwabata, S. Chem. Lett. 2008, 37, 230–235.
Chakraborty, S.; Raj, C. R. Electrochem. Commun. 2007, 9, 1323–1330.
Lin, Y. Q.; Liu, K.; Yu, P.; Xiang, L.; Li, X. C.; Mao, L. Q. Anal. Chem.
2007, 79, 9577–9583.
Wei, H.; Wang, E. Anal. Chem. 2008, 80, 2250–2254.
Doong, R. A.; Shih, H. M. Biosens. Bioelectron. 2006, 22, 185–191.
Davis, F.; Higson, S. P. J. Biosens. Bioelectron. 2005, 21, 1–20.
Pernot, P.; Mothet, J. P.; Schuvailo, O.; Soldatkin, A.; Pollegioni, L.; Pilone,
M.; Adeline, M. T.; Cespuglio, R.; Marinesco, S. Anal. Chem. 2008, 80,
1589–1597.
Foxx, D.; Kalu, E. E. Electrochem. Commun. 2007, 9, 584–590.
Maalouf, R.; Chebib, H.; Saikali, Y.; Vittori, O.; Sigaud, M.; Garrelie, F.;
Donnet, C.; Jaffirezic-Renault, N. Talanta 2007, 72, 310–4.
Khan, A. S.; Michael, A. C. Trends Anal. Chem. 2003, 22, 503–508.
Wilson, G. S.; Gifford, R. Biosens. Bioelectron. 2005, 20, 2388–2403.
Wilson, G. S.; Hu, Y. B. Chem. Rev. 2000, 100, 2693–2704.
O’Neill, R. D.; Lowry, J. P.; Mas, M. Crit. Rev. Neurobiol. 1998, 12, 69–
127.
Pantano, P.; Kuhr, W. G. Electroanalysis 1995, 7, 405–16.
Analytical Chemistry, Vol. 81, No. 10, May 15, 2009
3911
�detection (reaction 3). Thus, the analyte specificity of enzymebased amperometric biosensors can be seriously undermined
when the interference species is present in high concentration,
which is the case for ascorbic acid (AA), a ubiquitous reducing
agent in biological fluids.25 This is particularly true when the target
molecule is present at low concentrations, such as when monitoring the key neurotransmitters, glutamate26,27 and acetylcholine.28,29
Even when significantly lower applied overpotentials can be used
for direct H2O2 oxidation,30,31 AA interference can persist because
of its very low redox potential,32,33 and the use of redox-mediated
HRP-based biosensors may suffer from indirect AA interference
because HRP has been reported to catalyze the reaction between
AA and H2O2.13 The alternative strategy of H2O2 electroreduction34-36 is also prone to interference, in this case by reduction
of molecular oxygen in the target medium.37 Therefore, there is
a real need for improvements in biosensor selectivity for biological
applications, including real-time brain monitoring during behavior.2,23,29,38,39
We recently reported preliminary data on the effects of
electrode size for implantable model biosensors incorporating a
globular protein (GP) entrapped in a poly-o-phenylenediamine
(PPD) interference-rejecting layer electrosynthesized onto 125 µm
diameter Pt cylinders (PtC) and disks (PtD).40 The PtD/PPD-GP
electrodes showed a 10-fold poorer selectivity compared with
the corresponding PtC/PPD-GP design. Although that study
raised the important issue of the influence of sensor size/
geometry on the properties of surface-deposited permselective
polymers, it failed to elucidate the underlying cause of this
phenomenon. In the present work, we extend the range of
electrode size of PPD-coated sensors, and simplify the design
by omitting the GP to focus on the Pt/PPD properties. A novel
analysis of permeability parameters for a wide range of Pt/
PPD sensors revealed an “edge effect” as the source of
variability in the polymer permselectivity, findings that have
important implications for the choice of the size and geometry
of implantable biosensors.
(25) Li, Y.; Schellhorn, H. E. J. Nutr. 2007, 137, 2171–2184.
(26) Hascup, K. N.; Hascup, E. R.; Pomerleau, F.; Huettl, P.; Gerhardt, G. A.
J. Pharmacol. Exp. Ther. 2008, 324, 725–731.
(27) Morales-Villagran, A.; Medina-Ceja, L.; Lopez-Perez, S. J. J. Neurosci. Meth.
2008, 168, 48–53.
(28) Du, D.; Ding, J. W.; Cai, J.; Zhang, A. D. J. Electroanal. Chem. 2007,
605, 53–60.
(29) Dale, N.; Hatz, S.; Tian, F. M.; Llaudet, E. Trends Biotechnol. 2005, 23,
420–428.
(30) Lee, C. H.; Wang, S. C.; Yuan, C. J.; Wen, M. F.; Chang, K. S. Biosens.
Bioelectron. 2007, 22, 877–884.
(31) Rahman, M. A.; Kwon, N. H.; Won, M. S.; Choe, E. S.; Shim, Y. S. Anal.
Chem. 2005, 77, 4854–4860.
(32) Kulys, J.; Drungiliene, A. Electroanalysis 1991, 3, 209–214.
(33) Perone, S. P.; Kretlow, W. J. Anal. Chem. 1966, 38, 1760–1763.
(34) Wang, J.; Liu, J.; Chen, L.; Lu, F. Anal. Chem. 1994, 66, 3600–3603.
(35) Wang, J.; Lu, F.; Angnes, L.; Liu, J.; Sakslund, H.; Chen, Q.; Pedrero, M.;
Chen, L.; Hammerich, O. Anal. Chim. Acta 1995, 305, 3–7.
(36) Rahman, M. A.; Won, M. S.; Shim, Y. B. Electroanalysis 2007, 19, 631–
637.
(37) Tatsuma, T.; Oyama, N. Anal. Chem. 1996, 68, 1612–1615.
(38) Wilson, G. S.; Ammam, M. FEBS J. 2007, 274, 5452–5461.
(39) Burmeister, J. J.; Gerhardt, G. A. Trends Anal. Chem. 2003, 22, 498–
502.
(40) McMahon, C. P.; Killoran, S. J.; Kirwan, S. M.; O’Neill, R. D. J. Chem.
Soc., Chem. Commun. 2004, 2128–2130.
3912
Analytical Chemistry, Vol. 81, No. 10, May 15, 2009
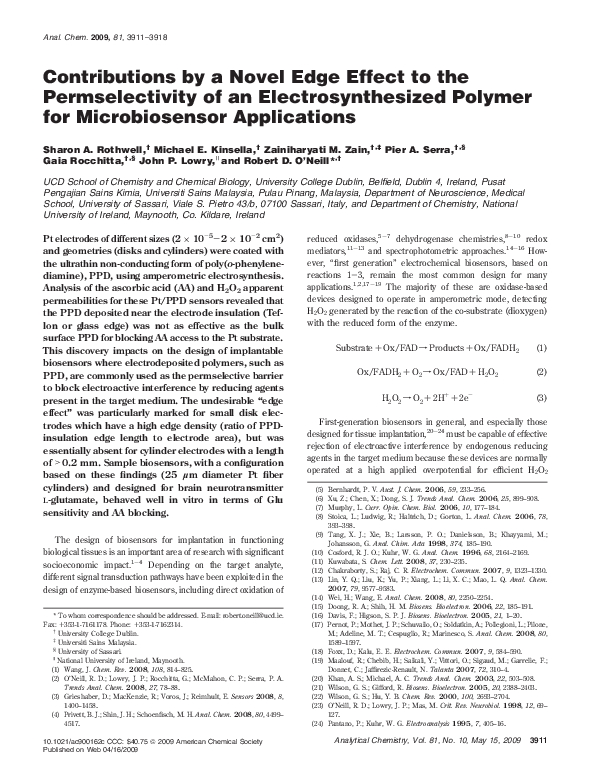
Figure 1. Schematic representation of the tips of the three main
designs of working electrodes investigated here: PtC (Teflon-coated
cylinder: 50 or 125 µm diameter, with a length of 1 mm in both cases;
left); PtD (Teflon-coated disk: 50 or 125 µm diameter; center); and
PtF (glass-supported Pt fiber: 25 µm diameter, with a length ranging
from 0.1 to 2.0 mm; right). T is Teflon and G is glass.
EXPERIMENTAL SECTION
Chemicals and Solutions. The monomer o-phenylenediamine
(oPD) was obtained from Sigma, as were the two calibration
analytes: ascorbic acid (AA); and H2O2 (30% w/w aqueous
solution). All chemicals were used as supplied, although the
exact H2O2 concentration was determined by titration against
an oxalate-standardized permanganate solution. Calibrations
were carried out in vitro in phosphate-buffered saline (PBS,
pH 7.4) that consisted of NaCl (Sigma, 150 mM), NaH2PO4
(Fluka, 40 mM) and NaOH (Fluka, 40 mM). Solutions of oPD
monomer (300 mM) were made up in PBS. Stock solutions of
10 mM H2O2 and 100 mM AA were prepared in doubly distilled
water and 0.01 M HCl respectively.
Working Electrode Preparation. Pt-Ir cylinders (PtC) of 1
mm length were prepared by cutting sections of 50 or 125 µm
diameter Teflon-coated wire (90% Pt, 10% Ir from Advent
Research Materials, Eynsham, England) as described previously.41-44 Pt-Ir disks (PtD) were fabricated by cutting the
Teflon-coated wire transversely, using a single rolling action
of a new sharp scalpel blade, to produce 50 µm and 125 µm
diameter disks (see Figure 1). The Pt fiber (PtF) electrodes were
prepared from 25 µm diameter bare Pt wire (Goodfellow
Cambridge Ltd., purity 99.9%, hard temper) as follows. A glass
capillary (diameter 1 mm, Hawksley Ltd.) was pulled using a
Kopf Vertical Pipette puller (David Kopf Instruments) to a
narrow tip. An approximate 5 cm length of Teflon-insulated
silver wire (Advent Research Materials Ltd.) was stripped of
about 2 mm of its insulation at both ends. A 2 cm length of the
fiber was attached to one end of the wire using silver
conductive paint (Radionics Ltd.), allowed to dry, and then
inserted, fiber end first, into the capillary tube so that the Pt
protruded from the tip of the capillary. The other end of the
silver wire was soldered into a gold clip. The fiber was sealed
into the capillary by quickly rotating the tip of the capillary in
(41) Kirwan, S. M.; Rocchitta, G.; McMahon, C. P.; Craig, J. D.; Killoran, S. J.;
O’Brien, K. B.; Serra, P. A.; Lowry, J. P.; O’Neill, R. D. Sensors 2007, 7,
420–437.
(42) McMahon, C. P.; Rocchitta, G.; Kirwan, S. M.; Killoran, S. J.; Serra, P. A.;
Lowry, J. P.; O’Neill, R. D. Biosens. Bioelectron. 2007, 22, 1466–1473.
(43) McMahon, C. P.; Rocchitta, G.; Serra, P. A.; Kirwan, S. M.; Lowry, J. P.;
O’Neill, R. D. Anal. Chem. 2006, 78, 2352–2359.
(44) McMahon, C. P.; Killoran, S. J.; O’Neill, R. D. J. Electroanal. Chem. 2005,
580, 193–202.
�a small flame for a few seconds so that the glass melted around
the fiber, sealing the capillary-fiber junction. The opposite end
of the glass capillary, with the silver wire protruding, was sealed
using an epoxy resin (Araldite, Bostik) and allowed to dry for
24 h at room temperature. The protruding tip of the fiber was
then cut to the desired length (0.1-2.0 mm).
Stock 300 mM solutions of oPD monomer were used in the
electro-oxidative polymerization, carried out amperometrically at
+700 mV versus SCE for 15 min to produce PtC/PPD, PtD/PPD
and PtF/PPD modified electrodes. Because of the self-sealing
nature of this process, longer amperometric polymerization
times do not improve interference rejection of the coating.45
The relevant electrochemical properties of PPD-coated sensors
based on the Pt-Ir alloy used in this study are indistinguishable
from those based on pure Pt wire,41 and so the representation
Pt is used in preference to Pt-Ir for simplicity in modified
electrode nomenclature: PtC/PPD, and so on, as discussed
previously.2
Glutamate Biosensor Fabrication. Biosensors were prepared by first pre-coating the metal surface of PtF electrodes (see
Working Electrode Preparation above) with the polycation
polyethyleneimine (PEI, Aldrich, MWr ∼750 kDa, 1% aqueous
solution) by dip evaporation before enzyme deposition to boost
enzyme activity, as described previously.31,42,46 The enzyme
glutamate oxidase, GluOx (EC 1.4.3.11, 200 U mL-1, Yamasa
Corp., Japan) was deposited onto the PtF/PEI by five dipevaporation steps45 and immobilized by amperometric electropolymerization, as described above for the enzyme-free
sensors, to form PtF/PEI/GluOx/PPD biosensors.
Instrumentation and Software. Electropolymerizations and
calibrations were performed in a standard three-electrode glass
electrochemical cell. A saturated calomel electrode (SCE) was
used as the reference electrode and a stainless steel needle served
as the auxiliary electrode. Constant potential amperometry was
performed at +700 mV versus SCE, using Chart (v5.2) software
(AD Instruments Ltd., Oxford, U.K.) and a low-noise potentiostat
(Biostat IV, ACM Instruments, Cumbria, U.K.).
Amperometric Calibrations. All H2O2 and AA calibrations
on bare and PPD-modified electrodes were performed amperometrically in a standard three-electrode glass electrochemical
cell containing 20 mL of PBS at room temperature. The applied
potential for calibrations was +700 mV versus SCE, a common
value for anodic detection of H2O2 in biosensor applications
involving smooth Pt substrates.2,47,48 The H2O2 calibrations were
carried out in the range 0-0.1 mM, prior to an AA calibration
in the range 0-1 mM. The H2O2 calibration plots of the steadystate responses were linear at all modified surfaces, as reported
previously for electrodes modified with a variety of PPD-based
matrixes.41,49,50 The steady-state calibration response of AA at
Pt/PPD-type electrodes is distinctively non-linear, typically forming
(45) Ryan, M. R.; Lowry, J. P.; O’Neill, R. D. Analyst 1997, 122, 1419–1424.
(46) McMahon, C. P.; Rocchitta, G.; Serra, P. A.; Kirwan, S. M.; Lowry, J. P.;
O’Neill, R. D. Analyst 2006, 131, 68–72.
(47) Hamdi, N.; Wang, J. J.; Walker, E.; Maidment, N. T.; Monbouquette, H. G.
J. Electroanal. Chem. 2006, 591, 33–40.
(48) Guilbault, G. G. Analytical Uses of Immobilised Enzymes; Marcel Dekker:
New York, 1984.
(49) Lowry, J. P.; McAteer, K.; El Atrash, S. S.; Duff, A.; O’Neill, R. D. Anal.
Chem. 1994, 66, 1754–1761.
(50) Lowry, J. P.; O’Neill, R. D. Electroanalysis 1994, 6, 369–379.
a plateau at AA concentrations greater than 0.5 mM, either
hyperbolically or after a relative maximum is observed (see Data
Analysis below).40,49-51 The PtF/PEI/GluOx/PPD biosensors
were calibrated with L-glutamic acid (Glu, Sigma), H2O2, and
AA to determine the Glu slope in the linear response region
(up 100 µM Glu), as well as their sensitivity to H2O2 and AA.
Data Analysis. The transport of analytes from solution,
through an insulating polymer coating on an electrode, to the
underlying metal substrate where the electrochemical reactions
occur, is a complex process. Two distinct transport mechanisms
have been identified: movement of the analyte through “pinhole”
or channel imperfections in the polymer; and diffusion of thermodynamically dissolved analyte in the polymer.52,53 Parameters
involved in membrane transport include the permeant’s partition
and diffusion coefficients in the polymer, as well as polymer
thickness.54,55 Because the thickness of the non-conducting form
of PPD generated under the electrodeposition conditions used in
the present work is not known accurately (estimates range from
5-30 nm56-60), the “true permeability” of an analyte cannot be
determined in a straightforward manner.54 Instead, we have
defined the “apparent permeability” of an analyte (eqs 4 and 5)
as the ratio of the analyte currents recorded with the same
electrode before and after deposition of the polymer. This apparent
permeability is a relative, normalized measure of the analyte flux
to the metal surface when the polymer coating is present, and
this parameter has proved useful in comparing the properties of
permselective polymers for biosensor applications.2,56
Slopes of the linear calibration plots were used to quantify the
sensitivity of the bare metal to H2O2 and AA, and of the PPDmodified electrodes to H2O2.50 Apparent analyte permeabilities
have been defined (eqs 4 and 5)2,56 to quantify and compare the
ability of the various non-conducting polymers to allow H2O2
through while inhibiting transport of AA to the underlying
electrode surface, where the electro-oxidation reactions occur:50,55
P(HP)% )
slope(HP) at Pt/PPD
× 100%
slope(HP) at bare Pt
(4)
where the slopes (nA mM-1) for H2O2 (HP) were obtained from
linear regression analysis of the respective calibration plots for
H2O2 at the same Pt electrodes, before and after polymer
modification.
The typical AA calibration profile, obtained by plotting the near
steady-state AA responses versus AA concentration for Pt/PPD
electrodes, is non-linear (see Figure 2), and a number of
parameters have been defined to quantify this behavior.51 The
(51) Craig, J. D.; O’Neill, R. D. Analyst 2003, 128, 905–911.
(52) Ikeda, T.; Schmehl, R.; Denisevich, P.; Willman, K.; Murray, R. W. J. Am.
Chem. Soc. 1982, 104, 2683–2691.
(53) Saveant, J. M. J. Electroanal. Chem. 1991, 302, 91–101.
(54) Pyati, R.; Murray, R. W. J. Phys. Chem. 1994, 98, 11129–11135.
(55) Centonze, D.; Malitesta, C.; Palmisano, F.; Zambonin, P. G. Electroanalysis
1994, 6, 423–429.
(56) Killoran, S. J.; O’Neill, R. D. Electrochim. Acta 2008, 53, 7303–7312.
(57) Cooper, J. M.; Pritchard, D. J. J. Mater. Sci.: Mater. Electron. 1994, 5,
111–116.
(58) Malitesta, C.; Palmisano, F.; Torsi, L.; Zambonin, P. G. Anal. Chem. 1990,
62, 2735–2740.
(59) Ohnuki, Y.; Matsuda, H.; Ohsaka, T.; Oyama, N. J. Electroanal. Chem.
1983, 158, 55–67.
(60) Myler, S.; Eaton, S.; Higson, S. P. J. Anal. Chim. Acta 1997, 357, 55–61.
Analytical Chemistry, Vol. 81, No. 10, May 15, 2009
3913
�AA in H2O2 detection; thus the optimum value of S% defined in
this way is zero for biosensor applications. The use of equimolar
concentrations in this definition allows S% to be interpreted as
a permselectivity for two analytes with the same z-value
(electrons transferred per molecule), as is the case for AA and
H2O2 (z ) 2):
S% )
IAA(1 mM) at Pt/PPD
IHP(1 mM) at Pt/PPD
× 100%
(6)
where IAA(1 mM) at Pt/PPD was the same as for eq 5, and
IHP(1 mM) was determined as the numerical value of the slope
(nA mM-1) of the linear calibration plots for H2O2 at Pt/PPD.
Values of parameters are presented as mean ± standard error
(SEM), with n ) number of electrodes. Differences observed in
parameters measured under different conditions were analyzed
statistically using Student’s two-tailed unpaired t tests (GraphPad
Prism 4, San Diego, CA), with values of p < 0.05 considered to
indicate statistical significance of the difference.
Figure 2. Samples of averaged AA calibrations for the three main
designs of polymer-coated electrodes investigated here: PtC/PPD
(cylinder: 125 µm diameter, 1 mm length; n ) 20); PtD/PPD (disk:
125 µm diameter; n ) 6); and PtF/PPD (fiber: 25 µm diameter, 1 mm
length; n ) 6). The data are expressed as current density to compare
the AA response at these electrodes of different areas, calculated
geometrically (cm2): 4.05 × 10⁻³, 1.23 × 10⁻⁴ and 7.9 × 10⁻⁴,
respectively.
main AA sensitivity parameter used here for PPD-modified
electrodes was the limiting current at 1 mM (Ilim(AA) or its
current-density form Jlim(AA); see Figure 2) because the plateau
region is the best measure of absolute interference-rejection
capacity of the polymer, and because baseline brain AA levels are
∼0.5 mM,61 reaching millimolar levels during a period of behavioral stimulation.62-64 The apparent permeability of AA for Pt/
PPD was therefore defined for 1 mM AA (eq 5):
P(AA)% )
IAA(1 mM) at Pt/PPD
× 100%
IAA(1 mM) at bare Pt
(5)
where IAA(1 mM) at the bare electrode was determined as the
numerical value of the slope (nA mM-1) of the linear calibration
plots for AA, and IAA(1 mM) at Pt/PPD was the effective plateau
response (nA) for 1 mM AA at the same Pt surface following
its modification by the PPD polymer (see Figure 2). Thus, both
numerator and denominator in eq 5 correspond to AA responses
at the same concentration, imparting a dimensionless quality to
P(AA)%. In addition, the P(H2O2)% and P(AA)% values defined
by eqs 4 and 5 reflect intrinsic properties of PPD which are
normalized with respect to actual electrochemical surface area,
rather than geometrically calculated area. These two apparent
permeability parameters were determined for individual electrodes
and then averaged over populations of sensors for each design.
Polymer selectivity (S%) has been usefully defined by eq 6,41
or its equivalent,2 and represents the percentage interference by
(61) Miele, M.; Fillenz, M. J. Neurosci. Meth. 1996, 70, 15–19.
(62) Boutelle, M. G.; Svensson, L.; Fillenz, M. Neuroscience 1989, 30, 11–17.
(63) O’Neill, R. D.; Fillenz, M.; Albery, W. J. J. Neurosci. Meth. 1983, 8, 263–
273.
(64) O’Neill, R. D.; Fillenz, M. Neurosci. Lett. 1985, 60, 331–336.
3914
Analytical Chemistry, Vol. 81, No. 10, May 15, 2009
RESULTS AND DISCUSSION
Experimental Design and Calibrations. An important goal
in recent biosensor research is the fabrication of amperometric
microsensors suitable for tissue implantation in vivo,17,65-69
especially for brain neurochemical monitoring.2,29,39,70,71 In this
context, size and geometry are critical as both determine the
extent of tissue damage caused by insertion of the probe,72-74 as
well as the spatial resolution of the tissue sampled. These
implantable biosensors must also be able to reject electrochemical
interference by reducing agents present in the tissue, and a
common strategy is the incorporation of a permselective membrane on the biosensor surface, such as electropolymerized
PPD.43,75-80 This polymer is unusual81 in that it displays very high
permeability to the biosensor signal transduction molecule (H2O2,
(65) Ahmad, F.; Yusof, A. P. M.; Bainbridge, M.; Ab Ghani, S. Biosens.
Bioelectron. 2008, 23, 1862–1868.
(66) Burmeister, J. J.; Pomerleau, F.; Huettl, P.; Gash, C. R.; Wemer, C. E.;
Bruno, J. P.; Gerhardt, G. A. Biosens. Bioelectron. 2008, 23, 1382–1389.
(67) Masson, J. F.; Kranz, C.; Mizaikoff, B.; Gauda, E. B. Anal. Chem. 2008,
80, 3991–3998.
(68) Wassum, K. M.; Tolosa, V. M.; Wang, J. J.; Walker, E.; Monbouquette,
H. G.; Maidment, N. T. Sensors 2008, 8, 5023–5036.
(69) Kulagina, N. V.; Michael, A. C. Anal. Chem. 2003, 75, 4875–4881.
(70) van der Zeyden, M.; Denziel, W. H.; Rea, K.; Cremers, T. I.; Westerink,
B. H. Pharmacol., Biochem. Behav. 2008, 90, 135–147.
(71) Wilson, G. S.; Johnson, M. A. Chem. Rev. 2008, 108, 2462–2481.
(72) Fumero, B.; Guadalupe, T.; Valladares, F.; Mora, F.; O’Neill, R. D.; Mas,
M.; Gonzalez-Mora, J. L. J. Neurochem. 1994, 63, 1407–1415.
(73) Duff, A.; O’Neill, R. D. J. Neurochem. 1994, 62, 1496–1502.
(74) Peters, J. L.; Miner, L. H.; Michael, A. C.; Sesack, S. R. J. Neurosci. Meth.
2004, 137, 9–23.
(75) Fu, Y. C.; Chen, C.; Xie, Q. J.; Xu, X. H.; Zou, C.; Zhou, Q. M.; Tan, L.;
Tang, H.; Zhang, Y. Y.; Yao, S. Z. Anal. Chem. 2008, 80, 5829–5838.
(76) O’Brien, K. B.; Killoran, S. J.; O’Neill, R. D.; Lowry, J. P. Biosens.
Bioelectron. 2007, 22, 2994–3000.
(77) Reyes-De-Corcuera, J. I.; Cavalieri, R. P.; Powers, J. R.; Tang, J. M.; Kang,
D. H. J. Agr. Food Chem. 2005, 53, 8866–8873.
(78) Dai, Y. Q.; Shiu, K. K. Electroanalysis 2004, 16, 1806–1813.
(79) Yao, T.; Yano, T.; Nanjyo, Y.; Nishino, H. Anal. Sci. 2003, 19, 61–65.
(80) Bartlett, P. N.; Birkin, P. R.; Wang, J. H.; Palmisano, F.; Debenedetto, G.
Anal. Chem. 1998, 70, 3685–3694.
(81) Murphy, L. J. Anal. Chem. 1998, 70, 2928–2935.
�see reactions 2 and 3) while being remarkably effective at
blocking a variety of interference molecules,41,51,56,82-84 with, for
example, P(AA)% values (eq 5) of less than 0.1% reported recently
for PtC/PPD electrodes.82 Implanted PtC-based biosensors,
however, sample the ECF around a relatively large population
of cells, and smaller designs are needed both to reduce tissue
damage (by reducing sensor diameter), and to study small
brain regions or layers of cells within regions, for example, by
using disk sensors. In this study, we fabricated Pt/PPD
electrodes of different sizes and geometries to determine their
sensitivity to H2O2 and to the archetypal interference species,
AA. Calibration of the same electrodes for these two analytes
before and after PPD deposition allowed calculation of the
apparent permeabilities for H2O2 and AA (eqs 4 and 5). These
parameters were used to determine whether the excellent
selectivity properties, reported for the PtC/PPD design,56,82 scaled
down for smaller sensors.
Ascorbate Calibrations at Bare Electrodes. The response
of bare 125 µm diameter Pt-Ir electrodes to AA was linear in the
range tested (0-1 mM) for both PtC (140 ± 6 µA cm-2 mM-1, n
) 60, R2 ) 0.9995) and PtD (145 ± 8 µA cm-2 mM-1, n ) 69,
R2 ) 0.998) with no statistical difference observed between
these averaged individual slopes for the two geometries (p >
0.66). These new determinations for PtC are in line with other
populations determined previously.41,51 The similarity between
the AA slopes for PtC and PtD electrodes demonstrates that
neither subtle differences in the radial diffusion profiles for
these two geometries nor the different condition of the metal
surface (pristine cut for PtD vs the Teflon-stripped origin of
the PtC cylinder; see Figure 1)44,85 significantly affected AA
sensitivity for the bare electrodes under the recording conditions
used.
A different approach was taken with the linear AA calibration
slopes for PtF electrodes. Because it was difficult to determine
exactly where the thin glass seal ended and the bare metal
started (Figure 1), the length of the exposed fibers was
ascertained electrochemically. Previous work has shown that the
AA sensitivity is the same at pure Pt and the Pt-Ir alloy used
here, measured both cyclic voltammetrically and amperometrically
(Pt: 147 ± 27 µA cm-2 mM-1, n ) 10; Pt-Ir: 148 ± 7 µA cm-2
mM-1, n ) 20; p > 0.96).41 Benchmark AA current-density
slope (see above) was therefore combined with individual
calibration slopes to calculate the effective electrochemical
length of each PtF electrode. A plot of this electrochemical
length versus the length measured, using an optical microscope, was linear with a slope not significantly different from
unity (0.97 ± 0.02, R2 ) 0.9994, n ) 45) indicating that the
optical method was accurate enough for the present purposes,
except for very short fibers (<0.2 mm).
Ascorbate Calibrations at PPD-Modified Electrodes. Averaged steady-state AA calibrations for sample populations of PtC/
PPD, PtD/PPD, and PtF/PPD sensors (see Figure 1) are shown
(82) Rothwell, S. A.; Killoran, S. J.; Neville, E. M.; Crotty, A. M.; O’Neill, R. D.
Electrochem. Commun. 2008, 10, 1078–1081.
(83) Schuvailo, O. M.; Soldatkin, O. O.; Lefebvre, A.; Cespuglio, R.; Soldatkin,
A. P. Anal. Chim. Acta 2006, 573, 110–116.
(84) Dai, Y. Q.; Zhou, D. M.; Shiu, K. K. Electrochim. Acta 2006, 52, 297–
303.
(85) McMahon, C. P.; O’Neill, R. D. Anal. Chem. 2005, 77, 1196–1199.
in Figure 2. Although the PPD electrodeposited in this study did
not have the trapped globular proteins of previous work,40,51,86
the same distinctive behavior was evident, principally a flat plateau
in response for the major part of the concentration range up to 1
mM. This shape has been explained in terms of saturation of the
PPD with AA and its oxidation products, leading to a “selfblocking” phenomenon and an AA response which is largely
concentration independent.50,51,56 The plateau feature, which is
analytically relevant because AA levels in brain ECF can vary
spontaneously over this range,61,87,88 was observed for 1 mm
cylinder configurations of PtC and PtF (Figure 2, top), but was
not as clear-cut for PtD/PPD disk electrodes (Figure 2, bottom).
More importantly, the Jlim(AA) value for PtD/PPD (2.8 ± 0.4 µA
cm-2, n ) 6) was much greater than for PtC/PPD (0.14 ± 0.01
µA cm-2, n ) 20, p < 0.0001), as observed for a similar
comparison of Pt-Ir-coated PPD containing globular protein.
In that study,40 it was suggested that electrode size played a
role in the divergence of the PtC/PPD and PtD/PPD behavior.
The finding here, however, that this sample of PtC/PPD sensors
(4.05 × 10⁻³ cm2) behaved in a very similar way (see Figure 2,
top) to 1 mm long PtF/PPD electrodes (7.9 × 10⁻⁴ cm2) indicates
that this explanation is inadequate. Neither can minor Teflon
damage at the cut PtD surface, nor geometry per se, hold the
key to understanding this difference (e.g., more efficient
hemispherical AA diffusion to PtD versus cylindrical diffusion
to PtC) because these factors were too small to affect AA
responses at even the bare electrodes on the time scale of these
constant potential amperometric measurements (see Ascorbate
Calibrations at Bare Electrodes).
P(AA)% Analysis for PPD-Modified Electrodes. To ascertain the cause of the different AA responses shown in Figure 2,
P(AA)% was calculated, using calibration Ilim(AA) values (eq 5),
for PtC/PPD and PtD/PPD of different diameters (50 and 125
µm) and 1 mm long 25 µm diameter PtF/PPD electrodes. These
were combined with P(AA)% values calculated from literature
Ilim(AA) values for 250 µm Pt wire disks50 and 1.6 mm diameter
Pt disks89 to examine the trends in P(AA)% over an extended
range of electrode size for cylinder and disk geometries.
Table 1 shows the mean apparent AA permeability, P(AA)%,
values for seven electrode sizes (3 orders of magnitude range),
together with the corresponding geometrically calculated electrode area, edge length, and edge density (the ratio of edge length
to area). Here “edge” refers to the interface between the metal
surface and the insulation (Teflon or glass; see Figure 1). Contrary
to the expectation that this intensive property of the polymer, that
is, P(AA)%, should be similar for all cases where PPD was
electrodeposited on Pt under the same conditions, there was a
50-fold span in P(AA)% values across the range of Pt/PPD sizes
studied here. Because a number of area-normalized electrochemical signal parameters remain dependent on electrode area,90,91
P(AA)% was plotted versus Pt area to determine whether a
straightforward relationship existed between these two param(86) McAteer, K.; O’Neill, R. D. Analyst 1996, 121, 773–777.
(87) Fillenz, M.; O’Neill, R. D. J. Physiol. (London) 1986, 374, 91–101.
(88) Zhang, M. N.; Liu, K.; Xiang, L.; Lin, Y. Q.; Su, L.; Mao, L. Q. Anal. Chem.
2007, 79, 6559–6565.
(89) O’Neill, R. D.; Chang, S. C.; Lowry, J. P.; McNeil, C. J. Biosens. Bioelectron.
2004, 19, 1521–1528.
(90) Schrock, D. S.; Baur, J. E. Anal. Chem. 2007, 79, 7053–7061.
(91) Forster, R. J. Chem. Soc. Rev. 1994, 23, 289–297.
Analytical Chemistry, Vol. 81, No. 10, May 15, 2009
3915
�Table 1. Apparent Ascorbate Permeability, P(AA)%
from Equation 5 as Mean ( SEM (Number of
Electrodes), Together with Geometrically Calculated
Values of Electrode Area, Edge Length, and Edge
Density for Pt/PPD Sensors of Different Size and
Shapea
X for
PtX/PPD
125 µm C
50 µm C
25 µm F
1.6 mm D
250 µm D
125 µm D
50 µm D
P(AA)%
0.10
0.09
0.09
0.27
0.96
1.84
4.51
±
±
±
±
±
±
±
0.01
0.01
0.02
0.07
0.27
0.21
0.68
(20)
(8)
(6)
(5)
(3)
(6)
(3)
area
edge length edge density
(cm2 × 103) (cm × 102)
(cm-1)
4.05
1.59
0.79
20.1
0.490
0.123
0.020
3.93
1.57
0.78
50.3
7.85
3.93
1.57
9.70
9.88
9.90
24.9
160
319
800
a
X, column 1: C is wire cylinder, D is wire disk, and F is fiber
cylinder; see Figure 1. All cylinders (C and F) in this data set were 1
mm in length; electrode diameters are given in column 1.
Figure 3. Plots of averaged values of P(AA)% (eq 5) for seven
variations of Pt electrode geometry and size versus working electrode
area (top), edge length (middle), and edge density (bottom). R2 values
were calculated using linear regression. For the bottom plot, the slope
(0.55 ( 0.01% · m) and P(AA)% intercept (0.06 ( 0.02%) were
significant. Where the PtF fiber data overlap with wire PtC values
(middle and bottom graphs), the labels are grouped as “25-125 µm
C” for clarity; see Table 1 for all P(AA)% data and geometric
parameter values.
eters. Figure 3 (top) shows that there was no simple linear or
non-linear pattern in this plot (e.g., linear regression R2 ) 0.11),
with the smallest electrodes displaying both the lowest and
highest values of P(AA)% observed. Some electrochemical
3916
Analytical Chemistry, Vol. 81, No. 10, May 15, 2009
phenomena are also known to be affected by the edge
component of bare electrodes;92,93 P(AA)% was therefore plotted
versus Pt edge length. Figure 3 (middle) again shows that there
was no simple pattern in this plot (linear regression R2 ) 0.06),
with the smallest edge being associated with both the lowest
and highest values of P(AA)% observed.
The value of P(AA)% for any electrode is an average of the AA
permeability over the entire PPD deposit. The PPD coating can
be thought of as having two main components: a bulk region far
from any edge (PPDbulk); and PPD deposited near the insulating
glass or Teflon (see Figure 1; PPDedge) which might not offer
the same barrier to AA penetration. Thus, the apparent AA
permeability for a given sensor is an average of AA permeability
for PPDbulk and PPDedge, each weighted according to the relative
amounts of these two PPD components. For example, the 125
µm diameter PtD and PtC designs both have the same edge
length (Figure 1 and Table 1), and therefore similar amounts of
PPDedge, but very different amounts of PPDbulk. The P(AA)%
value for PtC/PPD would therefore be dominated by the ability
of AA to permeate PPDbulk. Following this reasoning, we define
here the “edge density” as the ratio of edge length to electrode
area, to quantify the relative weighting of these two regions of
the PPD coating.
The plot of P(AA)% versus edge density (Figure 3, bottom) was
linear (R2 ) 0.9996) over the entire range of sensor size studied.
Thus, when the edge density was high (e.g., small disk
electrodes) the overall P(AA)% was high because PPDedge
predominates, and this appears to offer a less effective barrier
to AA penetration. Conversely, when the edge density was low
(e.g., large disk and 1 mm long cylinder electrodes) the overall
P(AA)% was low (excellent AA blocking) because PPDbulk
predominates. These arguments are consistent with P(AA)%edge
> P(AA)%bulk, and estimates of these two permeability components can be obtained from the slope (0.55 ± 0.01% · m) and
y-intercept (zero edge density: 0.06 ± 0.02%) of the linear
regression analysis, respectively (Figure 3, bottom). Most
importantly, this analysis indicates that the limiting permeability
of bulk PPD (no edges present) was 0.06 ± 0.02%, that is, PPD
deposited under these conditions is capable of blocking 99.94%
of the AA flux to the metal surface. See below for an independent
determination of these two PPD components for PtF/PPD
sensors.
P(AA)%, P(H2O2)%, and S% Analyses for PtF/PPD Electrodes. Given the conclusions from Figure 3 above, the permeability and selectivity parameters for the fiber PtF/PPD electrodes
were analyzed only in terms of edge density. A plot of P(AA)%
values for 36 individual PtF/PPD electrodes of different lengths
(0.06-2.0 mm, determined electrochemically; see Ascorbate
Calibrations at Bare Electrodes, above) is shown in Figure 4.
This large population of individual electrodes revealed that the
edge-related increase in P(AA)% was not perceptible for small edge
densities (below 50 cm-1), corresponding to fiber lengths of
>0.2 mm. For shorter fibers, P(AA)% increased with a slope
of 0.47 ± 0.11% · m (R2 ) 0.68, p < 0.004, n ) 12), which was
not significantly different from the slope calculated from the
(92) Cope, D. K. J. Electroanal. Chem. 1997, 439, 7–27.
(93) Ju, H. X.; Chen, H. Y.; Gao, H. J. Electroanal. Chem. 1993, 361, 251–256.
�Figure 4. Plot of P(AA)% values (eq 5) for 36 individual PtF/PPD
electrodes of different lengths versus edge density. This large
population revealed that the edge-related increase in P(AA)% (see
Figure 3, bottom) was not perceptible for small edge densities (below
50 cm-1) corresponding to fiber lengths of >0.2 mm. For shorter
fibers, P(AA)% increased with a slope of 0.47 ( 0.11% · m (R2 )
0.68, p < 0.004, n ) 12). The average P(AA)% value for longer fibers
(0.2-2.0 mm) was 0.06 ( 0.01%, n ) 30.
principally wire-based averaged data in Figure 3. The coefficient
of variance was significantly higher for the slope obtained from
the plot of P(AA)% for fiber electrodes (Figure 4) compared with
that in Figure 3. This is not surprising, both because the individual
fiber P(AA)% values (affecting y-variance) were used in Figure 4
in contrast to averaged values for the different designs in Figure
3 and because the geometry of the glass edge (affecting x-variance)
in PtF/PPD electrodes is not expected to be as well-defined as
that of the Teflon edge of the wire-based sensors that
predominate in Figure 3. The finding, however, that the two
slopes (Figures 3 and 4) were indistinguishable supports the linear
regression analysis of the small subpopulation of short fibers in
Figure 4. For longer fibers (0.2-2.0 mm), P(AA)% was very
reproducible (0.06 ± 0.01%, n ) 30), the same value as for the
limiting intercept of the plot of non-fiber data in Figure 3. Thus,
the intrinsic AA permeability for the PPD polymer deposited on
Pt macro-disks, PtC, PtD, and PtF electrodes under these
conditions is 0.06 ± 0.01%, which represents an excellent
blocking of 99.94% of the AA interference for biosensor
applications. Higher P(AA)% values (poorer blocking) were
observed for sensor designs involving a significant edge
density, especially small disk electrodes, apparently because
of easier access by AA through PPD deposited near the electrode insulation.
Figure 5 shows plots of P(H2O2)% (eq 4) and S% (eq 6) values
for 30 individual PtF/PPD electrodes of different lengths
(0.06-2.0 mm) versus edge density. There was no statistically
significant trend in the P(H2O2)% data over the entire range of
fiber lengths (linear regression R2 ) 0.03). This is in line with
expectation, because the high H2O2 permeability in PPD is one
of its outstanding qualities which makes this polymer (both
ortho and meta forms)56,83,94 the permselective membrane of
choice in many first-generation biosensor designs.17,78,81,85 Thus,
the compromised structure of PPD deposited at the insulation
edge, indicated by the analysis for P(AA)% above, would not be
anticipated to impact on P(H2O2)% values already close to those
for the bare metal. We await the commissioning of a scanning
electrochemical microscope to probe the structure of the
(94) Netchiporouk, L. I.; Shram, N. F.; Jaffrezic-Renault, N.; Martelet, C.;
Cespuglio, R. Anal. Chem. 1996, 68, 4358–4364.
Figure 5. Plots of P(H2O2)% (eq 4, top) and S% (eq 6, bottom)
values for 30 individual PtF/PPD electrodes of different lengths versus
edge density. There was no statistically significant trend in the
P(H2O2)% data (linear regression R2 ) 0.03). The edge-related
increase in S%, as expected from the P(AA)% profile (Figure 4), was
again detected for edge densities above 50 cm-1 (slope of 0.51 (
0.11% · m, R2 ) 0.65, p < 0.001, n ) 12), corresponding to fiber
lengths of <0.2 mm. For longer fibers (0.2-2.0 mm), S% was very
reproducible with an average value of 0.057 ( 0.008%, n ) 24.
PPD–edge interface; scanning electron microscopy, which has
revealed interesting aspects of PPD structure in the past,50,56,95
tends to “burn” organic polymer deposits at the high magnifications needed to study this level of detail.
The edge-related increase in S%, expected from the P(AA)%
profile (Figure 4), was indeed detected for edge densities above
50 cm-1 (slope of 0.51 ± 0.11% · m, R2 ) 0.65, p < 0.001, n )
12), corresponding to fiber lengths of <0.2 mm. For longer
fibers (0.2-2.0 mm), S% was very reproducible with an average
value of 0.057 ± 0.008%, n ) 24, representing a 0.06% interference level by AA in H2O2 detection for equimolar concentrations.
Biosensor Performance of PtF/PEI/GluOx/PPD Electrodes. The excellent AA rejection properties (P(AA)%, 0.06 ±
0.01%), narrow cross-sectional area (∼5 × 10⁻⁶ cm2), and small
overall area of the >0.2 mm long PtF/PPD configuration make
this an attractive candidate for the design of an implantable
biosensor for brain Glu. PtF/PEI/GluOx/PPD biosensors,
incorporating the enzyme GluOx and sensitivity-boosting polycation PEI,31,42,46,96 were therefore fabricated and calibrated in
vitro for Glu, H2O2, and AA. The sensitivity to Glu in the linear
response region of the Michaelis-Menten calibration curve
was high (62 ± 8 µA cm-2 mM-1, n ) 14), representing 24 ±
4% of the sensitivity of the same biosensors in H2O2 calibrations
performed under the same quiescent conditions, and reflecting
efficient enzyme kinetics in these ultrathin insulating PPD
coatings (<30 nm56-60).2,42,43 The values of P(H2O2)% (119 ±
(95) Wang, J.; Chen, Q.; Renschler, C. L.; White, C. Anal. Chem. 1994, 66,
1988–1992.
(96) Varma, S.; Yigzaw, Y.; Gorton, L. Anal. Chim. Acta 2006, 556, 319–325.
Analytical Chemistry, Vol. 81, No. 10, May 15, 2009
3917
�14%, n ) 14) and P(AA)% (0.20 ± 0.04%, n ) 14) indicate that
the dip-evaporation deposition of both PEI and GluOx on the
bare PtF before PPD electrosynthesis only marginally affected
the ability of the composite polymer matrix to reject AA
interference or to enable efficient H2O2 transport to the metal
surface. Not surprisingly, as a result of incorporating these two
macromolecular species into the PPD matrix, its permeability
increased, but by only a factor of 2 for both parameters (see
Figures 4 and 5), minimizing the effects on selectivity.
CONCLUSIONS
Data and analysis of apparent AA permeability for Pt/PPD
sensors of different sizes and shapes indicate that the PPD
deposited near the electrode insulation (Teflon or glass) is not as
effective as the bulk surface PPD for blocking AA access to the
Pt surface, limiting its use as a permselective coating in certain
geometries of first-generation biosensors. This effect was particularly marked at small disk electrodes, which have a high edge
density. To some extent, the choice of a particular size and
geometry in designing implantable biosensors will depend on the
selectivity needed, that is, the ratio of target analyte concentration
to interference levels, as well as the size and shape of the tissue
(e.g., brain region) of interest. For biosensors designed to monitor
concentration dynamics of neurotransmitters present in the ECF
at low micromolar levels, such as Glu,26,31,97,98 short Pt fiber
cylinder electrodes (PtF, but g0.2 mm long), of the range studied
here, appear to offer the best balance of characteristics: minimal
tissue damage; small overall area, giving good spatial resolution;
and a negligible edge effect providing excellent interference
rejection. A sample biosensor design (PtF/PEI/GluOx/PPD)
based on this format behaved well in vitro in terms of Glu
sensitivity and AA blocking.
Full in vivo characterization of similar designs is being planned
to determine whether these properties survive the implantation
process and tissue environment. The demonstrated success of
(97) Oldenziel, W. H.; Dijkstra, G.; Cremers, T. I. F. H.; Westerink, B. H. C.
Brain Res. 2006, 1118, 34–42.
(98) Kulagina, N. V.; Shankar, L.; Michael, A. C. Anal. Chem. 1999, 71, 5093–
5100.
3918
Analytical Chemistry, Vol. 81, No. 10, May 15, 2009
PPD-based biosensors for in vivo brain glucose and lactate
monitoring during behavior is a promising indication for the PtF/
PPD devices,2,83,94,99-101 although the significantly lower concentration of brain ECF Glu relative to glucose means that the
selectivity and stability will need to be outstanding. These
properties, which have been achieved recently for other designs,
including Nafion-coated microelectrode arrays,21,26,83,102 can only
be determined reliably in vivo, which is another stage of our
ongoing program to develop simple wire-based PPD-modified
implantable microbiosensors for brain Glu.
Scanning electrochemical microscopy studies are also planned
to probe the structure of the PPD–edge interface. Further
investigations will include microband arrays to determine whether
similar edge effects are observed at this class of electrode,103 a
format finding increasing use in the design of implantable
biosensors.104,105
ACKNOWLEDGMENT
This work was funded in part by the Irish Research Council
for Science, Engineering and Technology (IRCSET), and by
Science Foundation Ireland (03/IN3/B376 and 03/IN3/B376s).
We thank Dr. Kusakabe of Yamasa Corp., Japan for a generous
gift of glutamate oxidase.
Received for review January 22, 2009. Accepted March 24,
2009.
AC900162C
(99) Dixon, B. M.; Lowry, J. P.; O’Neill, R. D. J. Neurosci. Meth. 2002, 119,
135–142.
(100) Lowry, J. P.; Miele, M.; O’Neill, R. D.; Boutelle, M. G.; Fillenz, M.
J. Neurosci. Meth. 1998, 79, 65–74.
(101) Lowry, J. P.; O’Neill, R. D.; Boutelle, M. G.; Fillenz, M. J. Neurochem. 1998,
70, 391–396.
(102) Oldenziel, W. H.; Dijkstra, G.; Cremers, T. I. F. H.; Westerink, B. H. C.
Anal. Chem. 2006, 78, 3366–3378.
(103) Porat, Z.; Crooker, J. C.; Zhang, Y. N.; Lemest, Y.; Murray, R. W. Anal.
Chem. 1997, 69, 5073–5081.
(104) Thomas, T. C.; Grandy, D. K.; Gerhardt, G. A.; Glaser, P. E. A.
Neuropsychopharmacology 2009, 34, 436–445.
(105) Dash, M. B.; Douglas, C. L.; Vyazovskiy, V. V.; Cirelli, C.; Tononi, G.
J. Neurosci. 2009, 29, 580–589.
�
 Gaia Rocchitta