Chapter 6 -- Interest Rates
Interest rates
The determinants of interest rates
Term structure of interest rates and yield curves
What determines the shape of yield curves
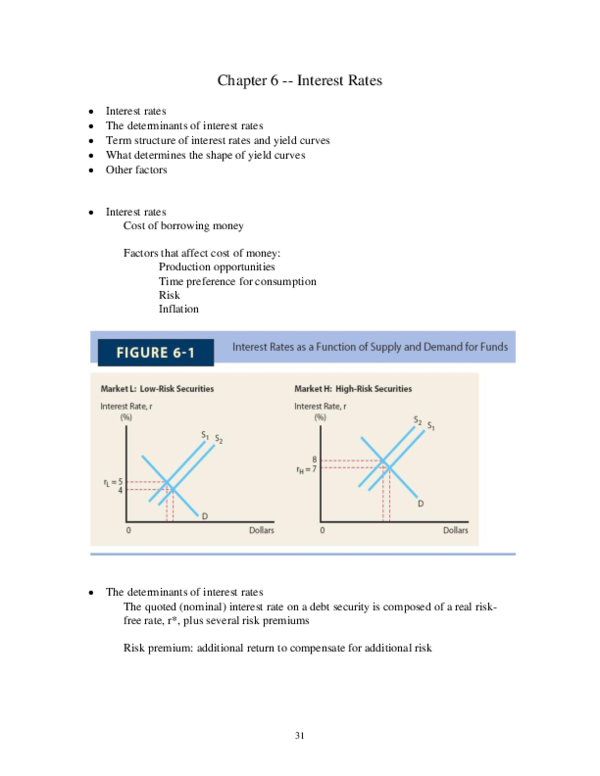
Other factors
Interest rates
Cost of borrowing money
Factors that affect cost of money:
Production opportunities
Time preference for consumption
Risk
Inflation
The determinants of interest rates
The quoted (nominal) interest rate on a debt security is composed of a real riskfree rate, r*, plus several risk premiums
Risk premium: additional return to compensate for additional risk
31
�Quoted nominal return = r = r* + IP + DRP + MRP + LP
where, r = the quoted, or nominal rate on a given security
r* = real risk-free rate
IP = inflation premium (the average expected rate of inflation over the life
time of the security)
DRP = default risk premium
MRP = maturity risk premium
LP = liquidity premium
and r* + IP = rRF = nominal risk-free rate (T-bill rate)
Examples (online)
Term structure of interest rates and yield curves
Term structure of interest rates: the relationship between yields and maturities
Yield curve: a graph showing the relationship between yields and maturities
Normal yield curve (upward sloping)
Abnormal yield curve (downward sloping)
Humped yield curve (interest rates on medium-term maturities are higher than
both short-term and long-term maturities)
Term to maturity
1 year
5 years
10 years
30 years
Interest rate
0.4%
2.4%
3.7%
4.6%
Interest rate (%)
Years to maturity
What determines the shape of yield curves
Term structure theories
(1) Expectation theory: the shape of the yield curve depends on investor’s
expectations about future interest rates (inflation rates)
Forward rate: a future interest rate implied in the current interest rates
For example, a one-year T-bond yields 5% and a two-year T-bond yields 5.5%,
then the investors expect to yield 6% for the T-bond in the second year.
(1+5.5%)2 = (1+5%)(1+X), solve for X(forward rate) = 6.00238%
Approximation: (5.5%)*2 - 5% = 6%
32
�(2) Liquidity preference theory: other things constant, investors prefer to make
short-term loans, therefore, they would like to lend short-term funds at lower rates
Implication: keeping other things constant, we should observe normal yield
curves
Other factors
Fed policy: money supply and interest rates
Increase in money supply lowers short-term interest rates and stimulates the
economy but may lead to inflation in the future
Government budget deficit or surpluses: if government runs a huge deficit and
the debt must be covered by additional borrowing, which increases the demand
for funds and thus pushes up interest rates
33
�International perspective: trade deficit, country risk, exchange rate risk
Business activity: during recession, demand for funds decreases; during
expansion, demand for funds rises
Exercise
ST-1, ST-2, and ST-3
Problems: 2, 3, 5, 7, 9, 10*, 11, and 12*
Problem 10: expected inflation this year = 3% and it will be a constant but above
3% in year 2 and thereafter; r* = 2%; if the yield on a 3-year T-bond equals the
1-year T-bond yield plus 2%, what inflation rate is expected after year 1, assuming
MRP = 0 for both bonds?
Answer: yield on 1-year bond, r1 = 3% + 2% = 5%; yield on 3-year bond,
r3 = 5% + 2% = 7% = r* + IP3; so IP3 = 5%;
IP3 = (3% + x + x) / 3 = 5%, x = 6%
Problem 12: Given r* = 2.75%, inflation rates will be 2.5% in year 1, 3.2% in year
2, and 3.6% thereafter. If a 3-year T-bond yields 6.25% and a 5-year T-bond yields
6.8%, what is MRP5 - MRP3 (For T-bonds, DRP = 0 and LP = 0)?
Answer: IP3 = (2.5%+3.2%+3.6%)/3=3.1%; IP5 = (2.5%+3.2%+3.6%*3)/5=3.3%;
Yield on 3-year bond, r3=2.75%+3.1%+MRP3=6.25%, so MRP3=0.4%;
Yield on 5-year bond, r5=2.75%+3.3%+MRP5=6.8%, so MRP5=0.75%;
Therefore, MRP5 - MRP3 = 0.35%
Example: given the following interest rates for T-bonds, AA-rated corporate
bonds, and BBB-rated corporate bonds, assuming all bonds are liquid in the
market.
(c)
Years to maturity
1 year
5 years
10 years
T-bonds
5.5%
6.1
6.8
AA-rated bonds
6.7%
7.4
8.2
BBB-rate bonds
7.4%
8.1
9.1
The differences in interest rates among these bonds are caused primarily by
a.
b.
c.
d.
Inflation risk premium
Maturity risk premium
Default risk premium
Liquidity risk premium
34
�Chapter 7 -- Bond Valuation
Who issues bonds
Characteristics of bonds
Bond valuation
Important relationships in bond pricing
Bond rating
Bond markets
Who issues bonds
Bond: a long-term debt
Treasury bonds: issued by the federal government, no default risk
Municipal bonds (munis): issued by state and local governments with some
default risk - tax benefit (returns are tax exempt)
Corporate bonds: issued by corporations with different levels of default risk
Mortgage bonds: backed by fixed assets (first vs. second)
Debenture: not secured by a mortgage on specific property
Subordinated debenture: have claims on assets after the senior debt has been paid
off
Zero coupon bonds: no interest payments (coupon rate is zero)
Junk bonds: high risk, high yield bonds
Eurobonds: bonds issued outside the U.S. but pay interest and principal in U.S.
dollars
International bonds
Characteristics of bonds
Claim on assets and income
Par value (face value, M): the amount that is returned to the bondholder at
maturity, usually it is $1,000
Maturity date: a specific date on which the bond issuer returns the par value to the
bondholder
Coupon interest rate: the percentage of the par value of the bond paid out annually
to the bondholder in the form of interest
35
�Coupon payment (INT): annual interest payment
Fixed rate bonds vs. floating rate bonds
Zero coupon bond: a bond that pays no interest but sold at a discount below par
For example, a 6-year zero-coupon bond is selling at $675. The face value is
$1,000. What is the expected annual return? (I/YR = 6.77%)
0
-675
1
2
3
4
5
1000
6
PV = -675, FV = 1,000, N = 6, PMT = 0, solve for I/YR = 6.77%
Indenture: a legal agreement between the issuing firm and the bondholder
Call provision: gives the issuer the right to redeem (retire) the bonds under
specified terms prior to the normal maturity date
Convertible bonds: can be exchanged for common stock at the option of the
bondholder
Putable bonds: allows bondholders to sell the bond back to the company prior to
maturity at a prearranged price
Income bonds: pay interest only if it is earned
Sinking fund provision: requires the issuer to retire a portion of the bond issue
each year
Indexed bonds: interest payments are based on an inflation index
Required rate of return: minimum return that attracts the investor to buy a bond;
It serves as the discount rate (I/YR) in bond valuation
Bond valuation
Market value vs. intrinsic (fair) value
Market value: the actual market price, determined by the market conditions
Intrinsic value: the fair or fundamental value
36
�(1) Intrinsic value: present value of expected future cash flows, fair value
M
INT INT INT
INT
0
1
2
3
...
N
N
INT
M
, where INT is the annual coupon payment, M is the
VB
t
(1 rd ) N
t 1 (1 rd )
face value, and rd is the required rate of return on the bond
Annual and semiannual coupon payments using a financial calculator
Example: a 10-year bond carries a 6% coupon rate and pays interest annually. The
required rate of return of the bond is 8%. What should be the fair value of the
bond?
Answer: PMT = 60, FV = 1,000, I/YR = 8% (input 8), N = 10, solve for
PV = -$865.80
What should be the fair value if the bond pays semiannual interest?
Answer: PMT = 30, FV = 1,000, I/YR = 4% (input 4), N = 20, solve for
PV = -$864.10
Should you buy the bond if the market price of the bond is $910.00?
No, because the fair value is less than the market price (the bond in the market is
over-priced)
Discount bond: a bond that sells below its par value
Premium bond: a bond that sell above its par value
(2) Yield to maturity (YTM): the return from a bond if it is held to maturity
Example: a 10-year bond carries a 6% coupon rate and pays interest
semiannually. The market price of the bond is $910.00. What should be YTM for
the bond?
Answer: PMT = 30, FV = 1,000, PV = -$910.00, N = 20, solve for I/YR = 3.64%
YTM = 3.64%*2 = 7.28%
(3) Yield to call: the return from a bond if it is held until called
Example: a 10-year bond carries a 6% coupon rate and pays interest
semiannually. The market price of the bond is $910.00. The bond can be called
after 5 years at a call price of $1,050. What should be YTC for the bond?
Answer: PMT = 30, FV = 1,050, PV = -$910.00, N = 10, solve for I/YR = 4.55%
YTC = 4.55%*2 = 9.10%
37
�(4) Current yield (CY) = annual coupon payment / current market price
Example: a 10-year bond carries a 6% coupon rate and pays interest
semiannually. The market price of the bond is $910.00. What is CY for the bond?
Answer: CY = 60/910 = 6.59%
Important relationships in bond pricing
(1)
The value of a bond is inversely related to changes in the investor’s
present required rate of return (current interest rate); or
As interest rates increase, the value of a bond decreases
Interest rate risk: the variability in a bond value caused by changing
interest rates
Interest rate price risk: an increase in interest rates causes a decrease in
bond value
Interest reinvestment risk: a decrease in interest rates leads to a decline in
reinvestment income from a bond
(2)
If the required rate of return (or discount rate) is higher than the coupon
rate, the value of the bond will be less than the par value; and
If the required rate of return (or discount rate) is less than the coupon rate,
the value of the bond will be higher than the par value
(3)
As the maturity date approaches, the market value of a bond approaches
its par value
38
�(4)
Long-term bonds have greater interest rate risk than short-term bonds
(5)
The sensitivity of a bond’s value to changing interest rates depends not
only on the length of time to maturity, but also on the pattern of cash
flows provided by the bond (or coupon rates)
39
�
Bond rating
Importance: firm’s credit
Moody’s and S&P provide bond ratings
AAA
AA
A
Investment-grade bonds
BBB
BB
B
Junk bonds
.
Criteria to consider
Financial ratios: for example, debt ratio and interest coverage ratio
Qualitative factors: for example, contract terms, subordinated issues, etc.
Other factors: for example, profitability ratios and firm size
Bond markets
OTC markets
Quotes: quoted as a % of par value of $100
Invoice price (dirty price) = quoted price (clear price) + accrued interest
0
182 days
62 days
120 days remaining until next coupon
Suppose annual coupon is $60 ($30 in 6 months) and the quoted price is 95.500,
Invoice price = 955 + (62/182)*30 = $965.22 = 955.00 + 10.22
where $955 is the quoted price and $10.22 is the accrued interest
40
�
Exercise
ST-1 and ST-2
Problems: 5, 8, 9, 10, 13, and 15*
Problem 15: bond X has 20 years to maturity, a 9% annual coupon, and a $1,000
face value. The required rate of return is 10%. Suppose you want to buy the bond
and you plan to hold the bond for 5 years. You expect that in 5 years, the yield to
maturity on a 15-year bond with similar risk will be priced to yield 8.5%. How
much would you like to pay for the bond today?
0
90
1
…
…
90
5
90
6
…
…
90
19
1,000
90
20
PV5 =1,041.52 (I/YR=8.5%, PMT=90, N=15, FV=1,000)
PV0 = 987.87 (I/YR=10%, PMT=90, N=5, FV=1,041.52)
Answer:
Step 1: figure out what should be the fair value of the bond after 5 years (PV5)
Step 2: figure out what should be the fair value of the bond now (PV0)
41
�
Chapter 8 -- Risk and Rates of Return
Investment returns
Risk
Expected rate of return and standard deviation
Diversification
Beta coefficient - market risk
Return on a portfolio and portfolio beta
Relationship between risk and rates of return
Investment returns
Dollar return vs. rate of return
If you invested $1,000 and received $1,100 in return, then
your dollar return = 1,100 - 1,000 = $100 and
your rate of return = (1,100 - 1,000) / 1,000 = 10%
Risk
The chance that some unfavorable event will occur
Stand-alone risk vs. market risk
Stand-alone risk: risk of holding one asset measured by standard deviation
Market risk: risk of holding a well-diversified portfolio measured by beta
Expected rate of return and standard deviation
Probability distribution: a list of possible outcomes with a probability assigned to
each outcome
Expected rate of return: the rate of return expected to be realized
42
�Expected rate of return = r Pi ri
Variance and standard deviation: statistical measures of variability (risk)
N
^
Variance = 2 =
P (r r )
N
i 1
^
i
i
i 1
2
and
Standard deviation = 2
Coefficient of variation (CV) = standard deviation / expected rate of return,
which measures the risk per unit of expected return
Example: probability distribution for Martin Products vs. U.S. Water
Example: calculation of standard deviation (risk) for Martin Products
43
�Using historical data to estimate average return and standard deviation
Stock returns: expected vs. realized
68. 26%
95. 44%
99. 74%
Expected return
Using Excel to calculate mean and standard deviation with historical data
Risk premium: the difference between the expected/required rate of return on a
given security and that on a risk-free asset
44
�
Diversification
As you increase the number of securities in your portfolio, the portfolio total risk
decreases
Total risk = firm’s specific risk + market risk
Total risk = diversifiable risk + nondiversifiable risk
Total risk = unsystematice risk + systematic risk
Beta coefficient - market risk
Sensitivity of an asset (or a portfolio) with respect to the market or the extent to
which a given stock’s returns move up and down with the stock market
Plot historical returns for a firm along with the market returns (S&P 500 index,
for example) and estimate the best-fit line. The estimated slope of the line is the
estimated beta coefficient of the stock, or the market risk of the stock.
45
�
Return on a portfolio and portfolio beta
Expected return on a portfolio: the weighted average of the expected returns on
the assets held in the portfolio
rp wi ri
^
N
^
i 1
46
�For example, the expected rate of return on stock A is 10% and the expected rate
of return on stock B is 14%. If you invest 40% of your money in stock A and 60%
of your money in stock B to form your portfolio then the expected rate of return
on your portfolio will be 12.4% = (0.4)*10% + (0.6)*14%*
Portfolio beta: weighted average of individual securities’ betas in the portfolio
b p wi bi
N
i 1
For example, if the beta for stock A is 0.8 and the beta for stock B is 1.2, with the
weights given above, the beta for your portfolio is 1.04 = (0.4)*0.8 + (0.6)*1.2
Relationship between risk and rates of return
Required rate of return: the minimum rate of return necessary to attract an investor
to purchase or hold a security
Market risk premium: the additional return over the risk-free rate needed to
compensate investors for assuming an average amount (market) of risk
RPM rM rRF
For example, if the required rate of return on the market is 11% and the risk-free
rare is 6% then the market risk premium will be 5%
Risk premium for a stock: the additional return over the risk-free rate needed to
compensate investors for assuming the risk of that stock
RPi ri rRF
For example, if the required rate of return on a stock is 15% and the risk-free rare
is 6% then the risk premium for that stock will be 9%
Capital Asset Pricing Model (CAPM)
ri rRF (rM rRF )bi
where ri is the required rate of return on stock i; rRF is the risk-free rate;
(rm – rRF) is the market risk premium; bi is the market risk for stock i, and
(rm – rRF) bi is the risk premium of stock i
47
�Security market line (SML): a line that shows the relationship between the
required return of an asset and the market risk
Overvalued vs. undervalued securities
If the actual return lies above the SML, the security is undervalued
If the actual return lies below the SML, the security is overvalued
Example: a stock has a beta of 0.8 and an expected rate of return of 11%. The
expected rate of return on the market is 12% and the risk-free rate is 4%. Should
you buy the stock?
Answer: required rate of return for the stock (using CAPM) is
4% + (12% - 4%)*(0.8) = 10.4% < 11% (expected rate of return)
The stock is under-valued
48
�The impact of inflation: a parallel shift in SML
Change in risk aversion: the slope of SML gets steeper
49
�Change in beta: changes the required rate of return
Some concerns about beta and the CAPM and multivariable models
Exercise
ST-1 and ST-3
Problems: 1, 2, 3, 7, 8, 9, and 13*
Problem 13: given the information about stocks X, Y, and Z below (X, Y, and Z
are positively but not perfectly correlated), assuming stock market equilibrium:
Stock
X
Y
Z
Expected Return
9.00%
10.75%
12.50%
Standard Deviation
15%
15%
15%
Beta
0.8
1.2
1.6
Fund Q has one-third of its funds invested in each of the three stocks; rRF is 5.5%
a. What is the market risk premium?
Applying CAPM to stock X and use the formula ri rRF (rM rRF )bi
9.00% = 5.50% + (rM – rRF)*0.8, solve for rM - rRF = 4.375%
b. What is the beta of Fund Q?
bQ = (1/3)*(0.8) + (1/3)*(1.2) + (1/3)*(1.6) = 1.20
c. What is the expected (required) rate of return on Fund Q?
Applying CAPM to Fund Q, rQ = 5.50% + (4.375%)*1.2 = 10.75%
d. What would be the standard deviation of Fund Q (>15%, =15%, or <15%)?
It should be less than 15% due to diversification (positive but not perfect)
50
�Chapter 9 -- Stock Valuation
Characteristics of common stock
Common stock valuation
Valuing a corporation
Preferred stock
Characteristics of common stock
Ownership in a corporation: control of the firm
Claim on income: residual claim on income
Claim on assets: residual claim on assets
Commonly used terms: voting rights, proxy, proxy fight, takeover, preemptive
right, classified stock, and limited liability
Common stock valuation
Stock price vs. intrinsic value: a revisit
Growth rate g: expected rate of growth in dividends
g = ROE * retention ratio
Retention ratio = 1 - dividend payout ratio
The growth rate, g plays an important role in stock valuation
The general dividend discount model: P0
^
t 1
Dt
(1 rs ) t
Rationale: estimate the intrinsic value for the stock and compare it with the
market price to determine if the stock in the market is over-priced or under-priced
(1) Zero growth model (the dividend growth rate, g = 0)
^
D
It is a perpetuity model: P0
rs
For example, if D = $2.00 and rs = 10%, then P0 $20
^
If the market price (P0) is $22, what should you do?
You should not buy it because the stock is over-priced
51
�(2) Constant growth model (the dividend growth rate, g = constant)
^
D * (1 g )
D1
0
P0
rs g
rs g
^
2 * (1 5%)
For example, if D0 = $2.00, g = 5%, rs = 10%, then P0
$42
0.10 0.05
If the market price (P0) is $40, what should you do?
You should buy it because the stock is under-priced
Common stock valuation: estimate the expected rate of return given the market
price for a constant growth stock
Expected return = expected dividend yield + expected capital gains yield
^
D * (1 g )
D
g
rs 1 g 0
P0
P0
In the above example,
^
D * (1 g )
2.00 * (1 0.05)
rs 0
g
0.05 0.0525 0.05 10.25%
P0
40
where 5.25% is the expected dividend yield and 5% is the expected capital gains
yield (stock price will increase at 5% per year)
What would be the expected dividend yield and capital gains yield under the zero
growth model?
Expected capital gains yield, g = 0 (price will remain constant)
Expected dividend yield = D/P0
(3) Non-constant growth model: part of the firm’s cycle in which it grows much
faster for the first N years and gradually return to a constant growth rate
Apply the constant growth model at the end of year N and then discount all
expected future cash flows to the present
D0
0
D1
1
D2
2
…
…
DN
N
Non-constant growth, gs
DN+1
N+1
…
Constant growth, gn
^
DN 1
Horizon value PN
rs g n
52
�For example N = 3 gs = 30%, gn = 8%, D0 = $1.15, and rs = 13.4%
D4 = 2.7287, P3 53.0576 , and P0 39.2134
^
^
53
�
Valuing a corporation
It is similar to valuing a stock
V = present value of expected future free cash flows
FCF = EBIT*(1-T) + depreciation and amortization – (capital expenditures + in
net working capital)
The discount rate should be the WACC (weighted average cost of capital)
Preferred stock
A hybrid security because it has both common stock and bond features
Claim on assets and income: has priority over common stocks but after bonds
Cumulative feature: all past unpaid dividends should be paid before any dividend
can be paid to common stock shareholders
Valuation of preferred stock
Expected return = rP
DP
PP
Example: if a preferred stock pays $2 per share annual dividend and has a
required rate of return of 10%, then the fair value of the stock should be $20
^
Intrinsic value = Vp = Dp / rp
and
Exercises
ST-1, ST-2, and ST-3
Problems: 10, 11, and 13*
Problem 13: given D1 = $2.00, beta = 0.9, risk-free rate = 5.6%, market risk
premium = 6%, current stock price = $25, and the market is in equilibrium
^
Question: what should be the stock price in 3 years ( P3 )?
Answer: required return = expected return = 5.6% + 6%*0.9 = 11%
Expected dividend yield = D1/P0 = 2/25 = 8%
Expected capital gains yield = g = 11% - 8% = 3%
^
Expected stock price after 3 years P3 = 25*(1+3%)3 = $27.32
Or D4 = D1*(1+g)3 = 2*(1+3%)3 = $2.1855 and then apply the constant growth
model
^
D4
2.1855
P3
$27.32
rs g 0.11 0.03
54
�Chapter 10 -- Cost of Capital
Capital components
Cost of debt
Cost of preferred stock
Cost of retained earnings
Cost of new common stock
Weighted average cost of capital (WACC)
Adjusting the cost of capital for risk
Capital components
Debt: debt financing
Preferred stock: preferred stock financing
Equity: equity financing (internal vs. external)
Internal: retained earnings
External: new common stock
Weighted average cost of capital (WACC)
Cost of debt
Recall the bond valuation formula
Replace VB by the net price of the bond and solve for I/YR
I/YR = rd (cost of debt before tax)
Net price = market price - flotation cost
If we ignore flotation costs which are generally small, we can just use the actual
market price to calculate rd
Cost of debt after tax = cost of debt before tax (1-T) = rd (1-T)
Example: if a firm can issue a 10-year 8% coupon bond with a face value of
$1,000 to raise money. The firm pays interest semiannually. The net price for
each bond is $950. What is the cost of debt before tax? If the firm’s marginal tax
rate is 40%, what is the cost of debt after tax?
Answer: PMT = -40, FV = -1,000, N = 20, PV = 950, solve for I/YR = 4.38%
Cost of debt before tax = rd = 8.76%
Cost of debt after tax = rd*(1-T) = 8.76*(1-0.4) = 5.26%
55
�
Cost of preferred stock
Recall the preferred stock valuation formula
Replace Vp by the net price and solve for rp (cost of preferred stock)
Net price = market price - flotation cost
If we ignore flotation costs, we can just use the actual market price to calculate rp
D
rP P
PP
Example: a firm can issue preferred stock to raise money. The net price is $40 and
the firm pays $4.00 dividend per year. What is the cost of preferred stock?
Answer: 4/40 = 10%
Cost of retained earnings
CAPM approach
ri rRF (rM rRF )bi
DCF approach
^
D (1 g )
D
g
rs 1 g 0
P0
P0
Bond yield plus risk premium approach
rs = bond yield + risk premium
When must a firm use external equity financing?
R/E
Retained earning breakpoint = ----------------% of equity
It is the dollar amount of capital beyond which new common stock must be issued
For example, suppose the target capital structure for XYZ is 40% debt, 10%
preferred stock and 50% equity. If the firm’s net income is $5,000,000 and the
dividend payout ratio is 40% (i.e., the firm pays out $2,000,000 as cash dividend
and retains $3,000,000), then the retained earning breakpoint will be
3,000,000
--------------- = $6,000,000,
50%
which means that if XYZ needs to raise more than $6,000,000 it has to issue new
common stock
56
�
Cost of new common stock
D (1 g )
D1
re
g , where F is the flotation cost
g 0
P0 (1 F )
P0 (1 F )
Weighted average cost of capital (WACC)
Target capital structure: the percentages (weights) of debt, preferred stock, and
common equity that will maximize the firm’s stock price
WACC = wd rd (1-T) + wp rp + wc (rs or re)
Comprehensive example
Rollins Corporation is constructing its MCC schedule. Its target capital structure
is 20% debt, 20% preferred stock, and 60% common equity. Its bonds have a
12% coupon, paid semiannually, a current maturity of 20 years, and a net price of
$960. The firm could sell, at par, $100 preferred stock that pays a $10 annual
dividend, but flotation costs of 5% would be incurred. Rollins’ beta is 1.5, the
risk-free rate is 4%, and the market return is 12%. Rollins is a constant growth
firm which just paid a dividend of $2.00, sells for $27.00 per share, and has a
growth rate of 8%. Flotation cost on new common stock is 6%, and the firm’s
marginal tax rate is 40%.
a) What is Rollins’ component cost of debt before and after tax?
Answer:
Cost of debt before tax = 12.55%
Cost of debt after tax = 7.53%
b) What is Rollins’ cost of preferred stock?
Answer:
Cost of P/S = 10.53%
c) What is Rollins’ cost of R/E using the CAPM approach?
Answer:
Cost of R/E = 16%
d) What is the firm’s cost of R/E using the DCF approach?
Answer:
Cost of R/E = 16%
e) What is Rollins WACC if it uses debt, preferred stock, and R/E to raise money?
Answer:
WACC (R/E) = 13.21%
f) What is Rollins’ WACC once it starts using new common stock financing?
Answer:
Cost of N/C = 16.51%
WACC (N/C) = 13.52%
57
�
Adjusting the cost of capital for risk
Exercise
ST-1 and ST-2
Problems: 6, 7, 8, and 10
58
�
 noname untell