African Journal of Geo-Science Research, 2013, 1(2):07-11
ISSN: 2307-6992
Available Online: http://ajgr.rstpublishers.com/
BASIC ANALYTICAL EXAMINATION OF SELECTED STREAMS AND THEIR
WATER QUALITY IN ADO-EKITI (SOUTHWESTERN NIGERIA) AND ITS
NEIGHBOURING VILLAGES.
Siyanbola T.O1*, Olanipekun E.O2, Edobor-Osoh A1, Adekoya J.A1., Akinsiku A. A1, Ehi-Eromosele C. O1.
1.Department of Chemistry, Covenant University, P.M.B. 1023, Ota, Ogun State, Nigeria.
2.Chemistry Department, Ekiti State University, P.M.B. 5363, Ado-Ekiti, Ekiti State, Nigeria.
E-mail: tolusiyanbola@gmail.com
Received:24 th , Apr,2013’
Revised: 29 th, Apr,2012;
Accepted:07 th, May,2013.
Abstract
Water samples were collected from ten (10) streams at different locations within Ado-Ekiti and its environ in Ekiti State, South Western
Nigeria. The samples were evaluated for their physico-chemical properties. The samples under investigation has pH within the range 7.6 to 8.2;
total hardness 8.0 mg/l to 196.0 mg/l; Calcium and Magnesium hardness 1.6 mg/l to 76.0 mg/l and 0.49 mg/l to 19.93 mg/l respectively; total
solids 0.2 mg/l to 1.2 mg/l; total suspended and total dissolved solids 0.00 to 0.06 mg/l, 0.14 mg/l to 1.16 mg/l respectively; free carbondioxde
3.74 × 10⁻³ mg/l to 5.72 × 10⁻³ mg/l; phenolphthalein acidity 9.0 mg/l to 15.0 mg/l; conductivity 4.0 µScm -1 to 570 µScm-1. The metal analysis
results from atomic absorption spectroscopy (AAS) are as follows: Sodium (2.7 mg/l to 60.1 mg/l), Potassium (4.0 mg/l to 52.0 mg/l), Zinc (0.80
mg/l to 1.51 mg/l), Calcium (1.60 mg/l to 76.0 mg/l), Iron and Lead were not detected in the sample considered.
Keywords: Physico-chemical, Atomic absorption spectroscopy, Ado-Ekiti and Nigeria.
INTRODUCTION
Water is one of the most important substances needed by human,
animals and plants for their day to day activities and survival. Dubey
and Maheshwari, (2006) defined water as a very essential part of
protoplasam and that it creates a state for metabolic activities to
occur effortlessly; therefore, no life can exist without water. But the
prevailing lack of infrastructures in the rural areas of Nigeria has
made this resource material (water) from the streams and rivers the
major source through which the inhabitants in these areas get water
(Siyanbola et al., 2011, Nikoladze and Akastal, 1989; Lemo, 2002;
Eze & Madumere, 2012). However, the industrialization of urban
areas and the non conformity of the industries with regulatory
standards for effluent discharge are hampering the portability of the
streams and river sources. Due to these increasing antienvironmental human activities (e.g. discharging of effluents into
municipal drains) there is a vivid posing/up-setting the natural
composition of the aquatic habitats and to the individuals that
consume the aquatic matter as well as drinking from such water.
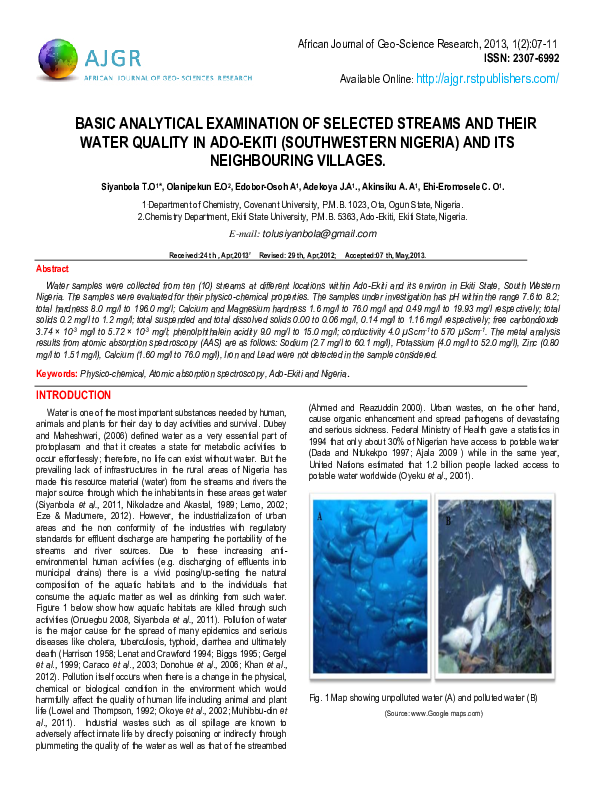
Figure 1 below show how aquatic habitats are killed through such
activities (Onuegbu 2008, Siyanbola et al., 2011). Pollution of water
is the major cause for the spread of many epidemics and serious
diseases like cholera, tuberculosis, typhoid, diarrhea and ultimately
death (Harrison 1958; Lenat and Crawford 1994; Biggs 1995; Gergel
et al., 1999; Caraco et al., 2003; Donohue et al., 2006; Khan et al.,
2012). Pollution itself occurs when there is a change in the physical,
chemical or biological condition in the environment which would
harmfully affect the quality of human life including animal and plant
life (Lowel and Thompson, 1992; Okoye et al., 2002; Muhibbu-din et
al., 2011). Industrial wastes such as oil spillage are known to
adversely affect innate life by directly poisoning or indirectly through
plummeting the quality of the water as well as that of the streambed
(Ahmed and Reazuddin 2000). Urban wastes, on the other hand,
cause organic enhancement and spread pathogens of devastating
and serious sickness. Federal Ministry of Health gave a statistics in
1994 that only about 30% of Nigerian have access to potable water
(Dada and Ntukekpo 1997; Ajala 2009 ) while in the same year,
United Nations estimated that 1.2 billion people lacked access to
potable water worldwide (Oyeku et al., 2001).
Fig. 1 Map showing unpolluted water (A) and polluted water (B)
(Source: www.Google maps.com)
�8
Siyanbola et al.
The impact of the activities of man has been so widespread that
the water bodies have lost their self-purification capability to a large
extent (Sood et al., 2008; Anyanwu, 2012, Ranjini et al., 2010).
The World Health Organization therefore has recommended
continuous surveillance of water supplies, which should involve
monitoring of the water supplies, from public health point of view, for
safety and the ability to sustain water supplies. This is to be achieved
through sanitary inspection and water quality analysis (World Health
Organization, 2002, Drinking Water Guidelines; Bacteriological
Parameters. World Health Organization, Geneva 5, 2)Stream water
is the main source of water supply in Ekiti State, Southwestern
Nigeria, the urban and towns depend on the surface water such as
streams, springs, dug well and bore hole for their daily activities. The
quality and purity forms of these sources are very uncertain. The
quality of natural water is generally governed by various physicochemical and microbiological parameters. The physical and chemical
characteristics of water bodies affect the species, composition,
abundance, productivity and physiological conditions of aquatic
organisms in it (Bagenal, 1978). It is therefore very necessary to
understand the physico-chemical and bacteriological qualities of
these stream water bodies. The presence of coliforms, total
dissolved solids, conductivity, pH, hardness, dissolved oxygen (DO),
biological oxygen demand (BOD) and chemical oxygen demand
(COD) are some of the significant parameters to study the water
quality (Kumar et al., 2012).
The objective of this study is to determine basic physico-chemical
properties of selected streams in Ado-Ekiti and its environs.
MATERIAL AND METHODS
Sampling and Sample Sites
Water samples were collected in triplicate from eight (10) different
streams as shown in the study location map (Figure 2). The samples
were collected mid stream about five (5) meters away from the bank.
The representative sample for each location was drawn out after
mixing the three samples for each location together. The pH and
conductivity of each sample were determined almost immediately on
arrival at the laboratory. Samples collected were labeled accordingly
showing the time and location.
Table. 1: Description of Water Samples
Sample
Code
Description
Ogbese Stream
Location
Ireje Stream
Federal Polytechnic Road,
Ado-Ekiti
Federal Polytechnic Road,
Ado-Ekiti
Bamigboye, Ado-Ekiti
Eku Stream
Bashiri, Ado-Ekiti
Awedele Stream
Bashiri, Ado-Ekiti
Elemi Stream
University of Ado, Ado-Ekiti
Ofin Stream
Adehun, Ado-Ekiti
Omisanjana
Stream
Omisanjana, Ado-Ekiti
Awedele Stream
Textile, Ado-Ekiti
Omoosuo Stream
Iworoko Ekiti
T1
Ireje Stream
T2
T3
T4
T5
T6
T7
T8
T9
T10
PHYSICO-CHEMICAL ANALYSIS OF THE SAMPLES
The parameters analyzed for the determination of the quality of
the stream water are: pH, odour and appearance, conductivity, free
carbondioxide in the sample, acidity of the sample, total solids (TS),
Total suspended solids dried (TSS), Total hardness, Calcium
Hardness by EDTA, Magnesium hardness by EDTA.
pH was determined by use of a pH meter, the electrode was
dipped into a beaker containing 100 mL of buffer solution of pH 9
and later pH 4 in order to calibrate the instrument. The electrode was
dipped into the sample after calibration of the instrument.
Odour of the sample was determined by smelling the water
samples for any foulness in the odour.
Conductivity was measured with a conductivity measuring bridge.
The sample was poured into a cup-like material in the conductivity
meter and the conductivity is read from the electronic meter in
µScm-1.
Free carbondioxide in the water sample was determined by
adding five (5) drops of phenolphthalein to 100 mL of the water
sample until the appearance of a pink colour that persists for about
30 minutes after titrating with sodium carbonate. Concordant reading
were taken and recorded.
The expression for calculating free CO2 in the samples is given
below:
Free CO2 =
A x 22 x 100
mg/L
50 x 100
A = volume of the sample used.
Fig. 2: Study Location Map
Acidity of the water sample was determined via two methods;
methyl orange acidity and phenolphthalein acidity. Methyl orange
acidity was determined by pipetting 100 mL of the sample into a
conical flask and adding one drop of the sodium thiosulphate solution
so as to react with residual chlorine. Two drops of methyl orange
�9
African Journal of Geo-Science Research, 2013, 1(2):07-11
indicator was added and titrated with N/50 sodium hydroxide until the
red colour changes to yellow. Phenolphthalein acidity was done as
above, but two drops of phenolphthalein indicator was added instead
of methyl orange. The sample was titrated until the pink colour
persisted for thirty minutes.
T5
7.83
300
0.2
0.14
0.06
T6
7.68
130
0.1
0.08
0.02
T7
7.86
310
0.2
0.16
0.04
The Total Solid (TS) of the sample was determined by transferring
aliquots of the sample to a dried and pre-weighed nickel crucible, the
sample was then dried at 103˚C for one hour, cooled in a dessicator
and weighed, the process of drying, cooling and re-weighing was
done until the weight loss was less than 4% of the previous weight.
T8
7.81
120
0.2
0.16
0.04
T9
7.96
270
0.4
0.40
0.00
T10
7.89
280
0.4
0.16
0.04
W W1
Total solids 2
x 106 mg / L
V
Total suspended solid was determined by measuring 50 mL of the
sample. It was sieved by using a filter paper and dried in an oven at
103˚C. The dried sample is cooled in a dessicator and reweighed.
The process was repeated until the weight is constant.
TS: Total Solids
TDS: Total Dissolved Solids
TSS: Total Suspended Solids
Table 3: Analysis of Water Sample for Methyl Orange, Acidity,
Free Carbondioxide,Phenolphalein, Acidity and Chloride
W W1
Total Suspended Solids (TSS) 2
x 106 mg / Ls Content.
V
Total hardness was determined by pipetting 50 mL of the sample
Sampe Methyl
Free
Phenolphthalein Chloride
and adding two drops of indicator. This was titrated against EDTA till
Code
Orange
CO
(mg/l)
(mg/l)
2
the wine colour changed to a pure blue colour.
(mg/l)
(mg/l)
V o l . o f E D T A x t i t r e v a l u e x3 xm .1m0 0
H a r d n es s
mL of sample
Calcium hardness was determined by addition of 2 mL of NaOH to
50 mL of the sample and titrating against EDTA until the colour
changed from pink to purple.
Ca 2 mg/L =
mL of 0.01 EDTA x 1000 x 0.4008
vol. of sample
Magnesium hardness was also determined adding 2 mL of
ammonium chloride/ammonia solution; 0.1g Erichrome black T was
added as the indicator. It was titrated immediately with EDTA until it
turned from red to blue.
Mg 2 =
(Total hardness titre of 0.01M of EDTA) x 1000 x 0.243
Volume of sample
T1
N.D
T2
N.D
T3
N.D
T4
N.D
T5
N.D
T6
N.D
T7
N.D
T8
N.D
T9
N.D
T10
N.D
N.D: Not Detectable
3.96
10.7
N.D
4.53
3.74
5.72
3.96
5.59
3.74
3.96
4.97
3.96
12.0
12.0
10.0
11.0
10.0
12.3
9.0
15.0
11.3
N.D
N.D
N.D
N.D
N.D
N.D
N.D
N.D
N.D
Table. 4: Physical Properties of Water Sample
RESULTS
Table 2: Analysis of Stream water samples for pH,
Conductivity, Total Solids, Dissolved
Solids, and
Suspended Solids.
Sampl
e Code
pH
T1
7.68
Co
nduct
ivity
µS
cm-1
210
TS
(mg/L)
TDS
(mg/L)
TSS
(mg/L)
0.4
0.36
0.04
T2
8.21
570
0.2
0.14
0.06
T3
7.82
260
1.2
0.16
0.04
T4
7.55
40
0.8
0.76
0.04
Sample
Code
T1
T2
T3
T4
T5
T6
T7
T8
T9
T10
N.D: Not Detected
Appearance
Odour
Clear and Bright
Clear and Bright
Slightly Turbid
Clear and Bright
Slightly Bright
Clear and Bright
Clear and Bright
Clear and Bright
Clear and Bright
Clear and Bright
N.D
N.D
Faintly Perceived
N.D
Faintly Perceived
N.D
N.D
N.D
N.D
N.D
�10
Siyanbola et al.
Table 5: Metal Analysis of Water Samples
Samp
le
code
T1
Na
(mg/L)
12.1
K
(mg/L)
Zn
(mg/L)
Fe
(mg/L)
Pb
(mg/L)
Ca
(mg/L)
13.2
1.51
N.D
N.D
24.0
T2
60.1
52.0
0.91
N.D
N.D
76.0
T3
13.2
6.8
0.90
N.D
N.D
6.40
T4
2.7
4.0
0.92
N.D
N.D
1.60
T5
11.2
7.5
0.92
N.D
N.D
60.0
T6
8.4
7.8
1.01
N.D
N.D
13.6
T7
10.4
6.0
0.82
N.D
N.D
8.8
T8
6.0
8.1
0.80
N.D
N.D
40.0
T9
11.8
9.6
0.75
N.D
N.D
24.0
T10
10.6
6.4
0.85
N.D
N.D
24.0
N.D: Not Detected
TABLE 6: World Health Organization (W.H.O) Standards of
Some of the Parameters(W.H.O, 2001)
Parameters
Concentration
Lead (Pb) (mg/L)
Calcium (Ca) (mg/L)
Zinc (Zn) (mg/L)
Iron (Fe) (mg/L)
Sodium (Na) (mg/L)
Colour / Turbidity
pH
Hardness as CaCO3 (mg/L)
0.1
0.01
10
7.5
3.0
5 NTU
6.5 – 8.5
100
TDS (mg/L)
0.2
The physico-chemical analysis of eights streams in Ado-Ekiti
showed that the highest pH of 8.21 was found in the Ireje stream
around Federal Polytechnic road in Ado-Ekiti (T2), while the lowest
pH value 7.55 was found in Eku stream (T4). The result revealed that
Ireje stream (T2) also had the highest conductivity value of 570
µScm-1. The highest TS of 0.8 mg/L was found in the Eku stream
(T4)
DISCUSSION
The physico-chemical analyses of the eight streams are given in
Tables 3 – 6, while the names of the streams with their acronyms are
given in Table 1. Table 2 shows that pH values of the streams were
within the W.H.O standards with the highest pH value being 8.21
from T2 and the lowest pH value of 7.55 from T4, this is because pH
is determined by the amount of dissolved free carbon dioxide (CO2)
in water (Hem, 1985; Abdullah and Musta, 1999). The Total
Dissolved Solid of the streams calculated was found to be below
W.H.O standards. The range of Total Solid was between 0.1 mg/L
(T6) and 1.2 mg/L (T3). The Total Suspended Solid had its range
between 0.00 (T2) and 0.06 mg/L (T5). Table 3 shows that methyl
orange acidity was not detected for any of the samples. So also,
there was no chloride content detected in the samples. But when
phenolphthalein was used as the indicator in determining the acidity,
it was found to be in the range of 9.0 mg/L and 12.3 mg/l. The free
carbondioxide was also found to be in the range of 3.74 mg/l and
5.72 mg/l.
Table 4 shows the calcium and magnesium hardness, and the
total hardness of samples (T1 - T10). The tables show that 40% of the
samples will not be good for domestic (disinfection or filtration)
purposes because of the concentration of the total hardness of the
samples. The concentration of calcium and magnesium hardness
was lower than that stipulated by the W.H.O standard.
Table 5 shows the physical properties of the streams, for samples
T1, T2, T4, T6, T7, T8, T9 and T10 were clear, while T3 and T5 appeared
to be slightly turbid. Most of the samples did not have offensive
odour except for samples T3 and T5, which had a mild offensive
odour.
The metal analysis of the samples as shown in Table 6 shows that
the level of the metals ranges for the samples as follow: sodium (2.7
- 60.1 mg/L), Zinc (0.75 – 60.1 mg/L), potassium (4.0 – 52.0 mg/L),
Calcium (1.60 – 76.0 mg/L). Iron and lead were not detected in the
samples.
Conclusion
Due to the results obtained from the analyses of the streams in
Ado-Ekiti, it is clear that the parameters measured in the water
samples collected from the streams were within the confines specific
limits of World Health Organization (W.H.O, 2001). Therefore most of
the streams could serve for domestic purposes such as drinking,
cooking, bathing, and washing. These results can be due to the fact
that Ado-Ekiti and its environs have very few industries, but as the
town begins to develop, the environmental condition might gradually
change. It is therefore paramount that the streams under study be
monitored periodically.
References
1)Abdullah M.H. and Musta B. (1999) Phreatic water quality of the
Turtle Island of West Malaysia: Pulau Hill Inc. New York. Selingan
Pulau Bakungan Kechil. Borneo Science., 6: 1-9.
2)Ahmed A.U., Reazuddin, M., (2000) Industrial Pollution of Water
Systems in Bangladesh, Environmental System of Surface Water
Systems of Bangladesh, University Press Limited, Dhaka,
Bangladesh pp 175-178.
3)Ajala L., Ibrahim T., Adetuyi F. (2009) Preliminary Investigations
On The Physio-Chemical And Microbiological Analysis Of Water
From Streams Used For Drinking In Owo Local Government Area Of
Ondo State.. The Internet Journal of Nutrition and Wellness. Volume
8 Number 2.
4)Anyanwu E.D (2012) Physico-Chemical And Some Trace Metal
Analysis Of Ogba River, Benin City, Nigeria, Jordan Journal of
Biological Sciences, Volume 5 , Number 1, Pages 47 – 54.
5)Bagenal T.B. (1978) Fecundity in Eggs and Early Life History (Part
1) In: Bagenal TB (Ed), Methods for Assessment of Fish Production
in Freshwaters. 3rd Edition, 166 -178.
6)Biggs B.J.F. (1995) The contribution of disturbance, catchment
geology and land use to the habitat template of periphyton in stream
ecosystem. Freshwater Biology, 33: 419438.
�11
African Journal of Geo-Science Research, 2013, 1(2):07-11
7)Caraco N.F., Cole J.J., Likens G.E., Lovett G.M., Weathers K.C.
(2003) Variation in nitrate export from flowing waters of vastly
different sizes: Does one model fit it? Ecosystems, 6: 344-352.
19)Lowel Thompson F. (1992) Biodiversity of vibrios. Microbiol. Mol.
Biol. Rev., 68: 403-431.
8)Dada A., Ntukekpo D.S. (1997) Pure Water: How Safe? Ultimate
Water Technology and Environment. Vol. 1 No. 3, pp 8-11.
20)Muhibbu-din O. I., Aduwo A.O., Adedeji A. A. (2011) Study of
physiochemical parameter of effluent impacted stream in Obafemi
Awolowo University, Ile-Ife, Nigeria.
9)Donohue I. McGarrigle, M. L., Mills P. (2006) Linking catchment
characterstics and water chemistry with the ecological status of Irish
rivers. Water Research, 40: 91-98.
21)Nikoladze G.D.M., Akastal S. (1989) Water Treatment for Public
and Industrial Supply MIR Publisher, Moscow, pp. 163.
10)Dubey, R.C. and Maheshwari, D.K. (2006) Practical Microbiology.
2nd ed., S. Chand & Co. Ltd, Ram Nagar, New Delhi, p. 352.
11)Eze S.O., Madumere I.C. (2012)
Physicochemical And
Microbiological Analysis of Water Bodies In Uturu, Abia State-Nigeria,
Asian Journal of Natural & Applied Sciences Vol. 1 No. 4, pp 58-65.
12)Gergel S.E., Turner M.G., Kratz T.K. (1999) Dissolved organic
carbon as an indicator of the scale of watershed influence on lakes
and rivers. Ecological Application, 9: 1377-1380.
13)Harrison A.D., Elseworth J.F. (1958) Hydrological studies on the
great Berg River, Western Cape Province. Part I. General description,
chemical studies and main features of the flora and fauna. Trans. R.
Soc. S. Afr., 35:125-126.
14)Hem J.D. (1985) Study and interpretation of the chemical
characteristics of natural water. 3rd edition, Department of the Interior,
U. S. Geological Survey: p 263.
15)Khan M.Y., Shabeer M., Raja, I.A., Wani N.A. (2012) PhysicoChemical Analysis of River Jhelum (Kashmir) Global Journal of
Science Frontier Research Interdiciplinary Vol. 12 (11).
16)Kumar A., Rawat M., Srivastava S., Bhushan V. (2012) Volume
7, Number 3: 161-166.
17)Lenat D.R. Crawford J. K. (1994) Effects of land use on water
quality and aquatic biota of three North Carolina Piedmont streams.
Hydrobiologia, 294:185-189.
18)Lemo O.O. (2002) Man’s Control of Water Quality: The Chemical
Control of Human Environment.International symposium on human
environment. pp. 389.
22)Oyeku O.M., Omowumi O.J., Kupoluyi C.F., Toye E.O. (2001)
Wholesomeness Studies of Water Produced and Sold in Plastic
Sachets (Pure Water) in Lagos Metropolis. Nigerian Food Journal 19.
Pp 63 – 69.
23)Okoye P.A.C., Enemuoh R. E., Ogunjiofor J.C. (2002) Traces of
heavy metals in Marine crabs. J. Chem. Soc. Nigeria, vol. 27 (1) 7677.
24)Rajini K., Roland P., John C., Vincent R. (2010) Microbiological
and physicochemical analysis of drinking water in George town.
Nature and Science, 8 (8), 261-265.
25)Siyanbola T.O., Ajanaku K.O., James O.O., Olugbuyiro J.A.O.,
Adekoya J.O. (2011) Physico-Chemical Characteristics of Industrial
Effluents in Lagos State, Nigeria. G. J. P&A Sc and Tech., Vol. 01,
49-54.
26)Sood A., Singh K.D., Pandey P., Sharma S. (2008) Assessment
of bacterial indicators and physicochemical parameters to investigate
pollution status of Gangetic river system of Uttarakhand (India).
Ecological Indicators, 8: 709-717.
27)Onuegbu T.U., Okoye L.O., Dioha I.J., Okoye P.A.C., Nwako P.M.
(2008) Treated effluents and sludges samples. J. Chem. Soc.
Nigeria, Vol. 33 No. 1 pp 6-9.
28)World Health Organization (2002) Drinking Water Guidelines;
Bacteriological Parameters. World Health Organization, Geneva 5, 2.
29)World Health Organization (2001) Drinking Water Guidelines;
Heavy Metal Parameters. World Health Organization.
�
 Tolutope Siyanbola