Cerebral Cortex June 2011;21:1223--1230
doi:10.1093/cercor/bhq233
Advance Access publication November 10, 2010
FEATURE ARTICLE
Endogenous Auditory Spatial Attention Modulates Obligatory Sensory Activity in Auditory
Cortex
Alan J. Power1, Edmund C. Lalor1,2 and Richard B. Reilly1,2
Trinity Centre for Bioengineering and 2Trinity College Institute of Neuroscience, Trinity College Dublin, Dublin 2, Ireland
1
Address correspondence to Edmund C. Lalor. Email: edlalor@tcd.ie.
Keywords: AESPA, auditory evoked potential, continuous and competing
stimuli, dichotic listening
Introduction
In natural everyday environments, we are typically bombarded
with a convoluted mixture of competing sound sources. The
auditory system has evolved, however, to be able to complete
the highly complex task of allowing us to focus, with relative
ease, on a constituent source among the combination of
sources reaching the ears. There are 2 broad classes of
attentional mechanisms: exogenous attention and endogenous
attention (e.g., Hopfinger and West 2006). Exogenous attention
is the attraction of attentional focus by an environmentally
salient stimulus, whereas endogenous attention is the selfdirected focus of attention to a particular region or feature of
the environment. Extensive research investigating the intriguing phenomenon of endogenous auditory attention has been
carried out using the electroencephalogram (EEG) and the
magnetoencephalogram (Hillyard et al. 1973; Näätänen et al.
1992; Woldorff et al. 1993). These studies throw up an
interesting debate as to the generators affected by endogenous
attention. Hillyard et al. (1973), in their seminal study, found
the N1 wave of the auditory evoked potential (AEP) to be
enhanced by auditory selective attention. They suggested that
this was due to increased sensory processing of the attended
stimulus. This view is supported by others (Woldorff et al.
Ó The Author 2010. Published by Oxford University Press. All rights reserved.
For permissions, please e-mail: journals.permissions@oup.com
1993). However, the idea that obligatory sensory components
of the AEP are affected by endogenous attention has been
challenged by Näätänen and Picton (1987) and Näätänen et al.
(1992). They suggest that the N1 enhancement is likely due to
the engagement or enhancement of separate components of
the N1 wave that are not related to obligatory processes but to
a matching process between the sensory input and an
‘‘attentional trace.’’ Although they suggest that under some
conditions, obligatory components may possibly be affected by
endogenous attention (Näätänen and Picton 1987), they remain
somewhat skeptical about obligatory sensory involvement in
endogenous auditory attention (Näätänen et al. 1992; Alho et al.
1994). Research into this question is ongoing (Bidet-Caulet
et al. 2007; Ross et al. 2010).
The majority of EEG studies investigating endogenous
auditory attention, such as those mentioned above, have
employed the standard event-related potential (ERP) technique. These studies, although informative, are somewhat
hampered by the fact that they use discrete stimuli that may
not be best suited to the investigation of endogenous attention.
Specifically, the assertion that attentional effects to discrete
onset stimuli are entirely due to endogenous top-down
attention is complicated by the exogenous attention grabbing
effects of onset stimuli. It has been suggested, in the visual
domain, that endogenous and exogenous attention may be
separate systems (Hopfinger and West 2006). Whether these
proposed separate systems affect sensory processing in the
same manner, however, is still unknown, as is how they interact
when both are engaged. That said, despite the fact that the
attention grabbing nature of discrete stimuli is well established
in both visual (Jonides 1981) and auditory (Escera et al. 2000)
modalities there have been very few studies that attempt to
eliminate the possible confounding exogenous attentional
influence on the investigation of endogenous attention.
The continuous nature of steady-state response (SSR) stimuli
likely minimizes the influence of exogenous attention on the
SSRs. Studies employing SSR to investigate sustained auditory
attention have had mixed results, however: One study using
simultaneously presented click trains presented at a rate of
either 37 or 40 Hz found a transient N1 effect to stimulus onset
but no steady-state effect (Linden et al. 1987), which suggests
that sustained responses are not affected by endogenous
attention. A more recent study using amplitude modulated
tone bursts of 800 ms duration, however, found a steady-state
effect but no transient N1 effect (Ross et al. 2004), which
suggests that sustained responses are affected by endogenous
attention. The latter study did not employ a stimulus competition design however and used a visual task in the unattended
condition. Thus, we are unable to discern, from this
Downloaded from https://academic.oup.com/cercor/article-abstract/21/6/1223/349063 by guest on 30 October 2018
Endogenous attention is the self-directed focus of attention to
a region or feature of the environment. In this study, we assess the
effects of endogenous attention on temporally detailed responses to
continuous and competing auditory stimuli obtained using the novel
auditory evoked spread spectrum analysis (AESPA) method. There
is some debate as to whether an enhancement of sensory
processing is involved in endogenous attention. It has been
suggested that attentional effects are not due to increased sensory
activity but are due to engagement of separate temporally
overlapping nonsensory attention-related activity. There are also
issues with the fact that the influence of exogenous attention
grabbing mechanisms may hamper studies of endogenous attention.
Due to the nature of the AESPA method, the obtained responses
represent activity directly related to the stimulus envelope and thus
predominantly correspond to obligatory sensory processing. In
addition, the continuous nature of the stimuli minimizes exogenous
attentional influence. We found attentional modulations at ~136 ms
(during the Nc component of the AESPA response) and localized
this to auditory cortex. Although the involvement of separate
nonsensory attentional centers cannot be ruled out, these findings
clearly demonstrate that endogenous attention does modulate
obligatory sensory activity in auditory cortex.
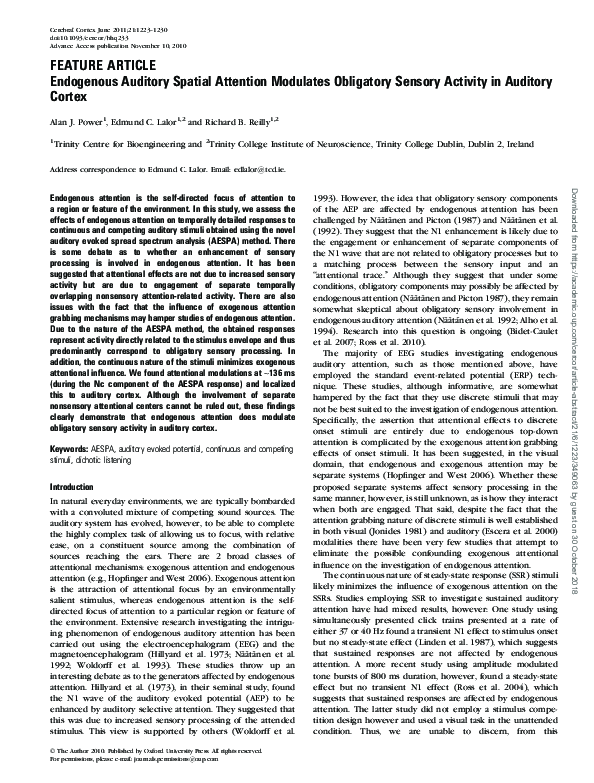
�Figure 1. An AESPA response obtained, at Fz, using a modulated broadband noise
carrier with equal power in the range 0--22.05 kHz.
1224 Endogenous Auditory Spatial Attention
d
Power et al.
continuous auditory streams concurrently, one to the left and
one to the right ear, and subjects are instructed to attend either
to the left or right.
Materials and Methods
Subjects and Data Acquisition
Seventeen subjects aged 21--33 (15 males) participated in the study.
The experiment was undertaken in accordance with the Declaration of
Helsinki. The Ethics Committee of the School of Psychology at Trinity
College Dublin approved the experimental procedures, and each
subject provided written informed consent. Subjects reported no
history of hearing impairment or neurological disorder. EEG data were
recorded from 130 electrode positions, filtered over the range 0--134
Hz, and digitized at the rate of 512 Hz using a BioSemi Active Two
system. EEG data were then digitally filtered off-line with a high-pass
filter, where the passband was above 2 Hz and with a –60 dB response at
1 Hz and a low-pass filter with passband below 35 Hz and a –50 dB
response at 45 Hz. The data at each channel were re-referenced to the
average of the responses at the left and right mastoids.
Stimuli
The AESPA stimulus consists of a carrier stimulus amplitude modulated
by a spread spectrum signal. In this case, 2 root mean square (RMS)
normalized band-pass noise carriers of bandwidth 1 kHz centered at 1
kHz (LOW stream) and 5 kHz (HIGH stream), respectively, were
employed. These center frequencies were chosen on the basis that 1
kHz and 5 kHz tones are perceived with approximately the same
loudness (ISO:226) and also because they are far enough apart in
frequency that they are perceived separately. These carriers were then
modulated by independent spread spectrum signals, and the low- and
high-frequency streams were concurrently presented to the left and
right ears, respectively (Fig. 2a,b,c). The reason that the stimuli were
separated in location as well as carrier stimulus center frequency is
because, 1) it is spatial attention that is under investigation and 2) if
both the left and right streams had identical carriers, the stimuli may
have been perceived as 1 auditory object varying in interaural intensity
difference as opposed to 2 spatially separate objects.
Figure 2. The stimulation setup. (a) LOW and HIGH streams were presented
dichotically. A segment of the (b) LOW and (c) HIGH frequency carrier stimuli,
respectively. Examples of (d) target and (e) distracter events.
Downloaded from https://academic.oup.com/cercor/article-abstract/21/6/1223/349063 by guest on 30 October 2018
experimental protocol, whether one competing stimulus
would result in increased activity relative to another. The
somewhat contradictory results suggest that the effects of
sustained endogenous auditory attention on competitive
continuous stimuli have yet to be adequately elucidated.
A further issue relates to the simultaneity of stimuli in most
ERP-based studies. In such studies, the discrete stimuli are not
presented truly simultaneously in the attended and unattended
channels (Hillyard et al. 1973; Näätänen et al. 1992). Thus, the
argument that the effects found are due to competing stimuli is
somewhat weakened. In an attempt to overcome this
drawback, paradigms where simultaneous stimulation is
employed have been carried out. A recent study assessed the
transient onset responses of subjects who were asked to detect
an occasional change in modulation frequency of amplitude
modulated sounds presented to one ear while ignoring
concurrent sounds in the other ear (Ross et al. 2010).
Interpretation of these results, however, is complicated by
the fact that any increase in the transient response to the
attended stimulus would be superimposed on the unaffected
(or even possibly inhibited) response to the unattended
stimulus perhaps diluting any attention effect. Indeed,
researchers investigating auditory scene analysis have been
forced to go to great lengths to create the perception of
auditory streaming using discrete stimuli (Sussman et al. 1999;
Ritter et al. 2006; De Sanctis et al. 2008). Recently, however,
there has been a move toward employing more natural stimulus
paradigms to assess auditory function (Lalor et al. 2009; Kerlin
et al. 2010; Lalor and Foxe 2010). Lalor and Foxe (2010)
obtained temporally detailed responses to natural speech
stimuli and Kerlin et al. (2010) found attentional modulation
of activity in auditory cortex (AC) when using competing
speech stimuli and a template-matching analysis method.
In an attempt to further address some of the concerns
outlined above, we employ a novel method for obtaining
temporally detailed responses to continuous stimuli: The
auditory evoked spread spectrum analysis (AESPA) method
(Lalor et al. 2009). Figure 1 shows a typical AESPA response
obtained using a continuous amplitude modulated broadband
noise stimulus. The AESPA response represents obligatory
sensory activity directly related to the input stimulus (Lalor
et al. 2009). The AESPA method also allows for the extraction of
separate responses to simultaneously presented continuous
stimuli. Furthermore, the continuous nature of the stimuli
minimizes exogenous attentional influence. Exploiting this
method, we employed a cocktail party-like experimental
approach to investigate the effects of endogenous attention
on sensory processing in the auditory system. We present 2
�The spread spectrum signals consisted of Gaussian noise with energy
uniformly distributed between 0 and 30 Hz. Taking into account, the
logarithmic nature of auditory stimulus intensity perception, the values
of these modulating signals, x, were then mapped to the amplitude of
the audio stimulus, x#, using the following exponential relationship:
x# = 102x ;
and normalized to between 0 and 1. It was expected that this would
result in a more linear perception of audio intensity modulation.
Transitions between levels were smoothed by using a 5-ms ramp
consisting of half a period of a 100-Hz sine wave. Using the Nyquist
sampling theorem and given that EEG power above 30 Hz is low, the
modulation rate of each signal was set to be 60 Hz.
Signal Processing
We obtain the AESPA by performing a linear least squares fit of the
response model
Quantification of Results
When calculating task performance any response occurring within a 1 s
period after an event was considered to be a response to that event. We
calculated the percentage of correct responses, percentage of
responses to distracters in the attended stream, and also percentage
of responses to events in the to-be ignored stream, which are shown in
Table 1. To test the behavioral results statistically, they were submitted
to a 2 3 2 repeated measures analysis of variance (ANOVA) using
factors of stimulus (LOW-LEFT vs. HIGH-RIGHT) and event in the
attended stream (target vs. distracter).
The Global Field Power (GFP, Lehmann and Skrandies 1980) was
obtained for the grand average responses to each stimulus condition.
The GFP is a reference free measure of the response power over the
whole scalp. The GFP was used for preliminary visualization of the data
and to indicate possible periods of attentional modulation of the
responses. The periods of interest were obtained by submitting the
GFPs to running t-tests. A component was considered to be of interest if
responses were significantly different (P < 0.01) for a period of at least
11 consecutive samples (~20 ms). In order to investigate how different
areas are affected by attention, we also partitioned the scalp into 4
regions (Frontal, Central, Left Temporal, and Right Temporal) and
averaged over responses at electrodes within each region. Later, AESPA
components (i.e., Nc and Pd) have been shown to have very low signalto-noise ratio in parietal--occipital regions (Lalor et al. 2009), and thus
this region was not included in analysis. Figure 3 shows the responses
in the included regions as well as the GFPs for the HIGH-RIGHT and
LOW-LEFT responses when attended and unattended. In the GFP plots,
the areas identified as being of significant interest by the running t-tests
are shaded gray. Topographic maps of the Nc component when
attended and unattended are also shown, as are difference topographies.
Statistical differences in components identified as being possibly
effected by attention were tested using a repeated measures ANOVA.
The RMS values in a ~10 ms window around the component peak were
used in the statistical analysis. Topographic maps of affected
components were also obtained using the average amplitude in the
relevant windows. Component topographies were compared using the
topographic ANOVA (TANOVA) method (Murray et al. 2008). This
method assesses whether 2 topographies are statistically different using
a nonparametric randomization procedure. Given that topographic
maps reflect source configuration, this was done in order to assess
whether the attentional modulation of any component was due to an
engagement of additional generators or whether it was merely due to
enhanced activity of generators already engaged in the unattended
condition (i.e., if topographies are not statistically different, then we
can assert that they are likely due to the same generators). A further
more detailed investigation of the component generators was also
carried out using the BESA (5.2) source analysis package.
Table 1
Behavioral results
yðt Þ = wðsÞ � xðt Þ + noise;
where y(t) is the measured EEG response, x(t) is the amplitude
envelope of the stimulus, the symbol * indicates convolution, w(s) is
the impulse-response function to the amplitude of the stimulus, and the
noise is assumed to be Gaussian (Lalor et al. 2009). In other words,
the AESPA response, w (s), is analogous to a filter that describes how
the brain transforms the auditory input into the EEG output. Keeping
p(T) ± standard deviation%
p(D) ± standard deviation%
p(TBI) ± standard deviation%
LOW-LEFT
HIGH-RIGHT
82.89 ± 11.59
57.83 ± 26.81
1.79 ± 1.29
86.75 ± 9.35
65.41 ± 26.84
1.41 ± 1.07
Note: Percentage of correct responses (p(T)), percentage of responses to distracters in the
attended stream (p(D)), and percentage of events responded to in the to-be-ignored stream
(p(TBI)) are shown for each condition.
Cerebral Cortex June 2011, V 21 N 6 1225
Downloaded from https://academic.oup.com/cercor/article-abstract/21/6/1223/349063 by guest on 30 October 2018
Experimental Procedure and Tasks
While abstaining completely from eyeblinks is not possible for long
periods, subjects were instructed to keep the number of eyeblinks to
a minimum during each session. Subjects were also instructed to keep
all other types of motor activity to a minimum during testing. Testing
was carried out in a dark room, and in order to minimize eye
movements, subjects were asked to keep their eyes open and to fixate
on a small cross presented in the center of their visual field.
Each subject undertook 10 trials where they were asked to attend to
the HIGH stream in the right ear (attend-HIGH-RIGHT condition) and
10 trials where they were asked to attend to the LOW stream in the left
ear (attend-LOW-LEFT condition). Each trial was 120 s in duration. The
sequence of conditions was randomized for each subject. Stimuli were
presented at an intensity level deemed comfortable by the subject
before beginning the experiment.
In order to monitor each subject’s progress, targets and distracters
were inserted randomly in each stream. These events consisted of
a specific pattern of amplitude modulation imposed on the random
process. Targets consisted of a modulation level of –2.5 dBfs for 25.5 ms
followed by –12 dBfs for 16 ms followed by –2.5 dBfs for 25.5 ms, giving
a total length of 67 ms, whereas distracters consisted of a flat
modulation of –6 dBfs for 67 ms. dBfs refers to decibels full scale and
represents a dB value relative to the maximum modulation level for
each subject (see Fig. 2d,e). Although the events are embedded in the
stimulus, they are still distinguishable from the ongoing amplitude
modulations. This is due to the fact that the events are generally
somewhat louder than the ongoing modulation. The reason for this is
because of the exponential mapping outlined above that restricts the
modulating waveform to spend ~90% of its time below –12 dBfs.
Furthermore, due to the random nature of the modulating waveform,
nonevent-related amplitudes exceeding –12 dBfs generally have a short
duration compared with the 67 ms duration of events.
Subjects were instructed to respond only when a target in the
attended stream was heard. Each trial contained a total of 24 events
(i.e., both targets and distracters). The proportion of targets and
distracters in each trial was randomly assigned ranging from 8 targets
(and therefore 16 distracters) to 16 targets (and therefore 8
distracters). On average, 48.75% of events were targets and 51.25%
were distracters. No event, either within or between streams, could
occur within 1 s of another and the maximum separation between
events within streams could not be more than 9 s. EEG was recorded
for later analysis where both the responses to the HIGH-RIGHT and
LOW-LEFT streams for each condition were extracted. The stimulation
paradigm and the stimuli are outlined in Figure 2.
this in mind, the time axis for the AESPA carries a different meaning
than the time axes in traditional ERP studies. Each point on the time
axis can be interpreted as being the relative time between the
continuous EEG and the continuous input intensity signal. Therefore,
the AESPA at –100 ms, for example, indexes the relationship between
the input intensity signal and the EEG 100 ms earlier; obviously this
should be 0. As another example, the AESPA at 100 ms indexes how the
input intensity signal affects the EEG 100 ms later.
�Results
Behavioral Results
In order to keep subjects highly engaged in the attentional task,
discriminating between targets and distracters in the attended
stream was deliberately made difficult. The difficulty of the task
was evidenced by the relatively high number of distracters to
which subjects responded (see Table 1). However, the fact that
subjects responded to a significantly greater percentage of
targets than distracters (main effect of event, F1,16 = 28.088, P <
0.001) shows that subjects were capable of performing the
task. Furthermore, the very low percentage of events
responded to in the ignored stream indicates that attention
1226 Endogenous Auditory Spatial Attention
d
Power et al.
to the intended stream was taking place. Despite the fact that
we found a significant main effect of stimulus (F1,16 = 14.203,
P = 0.002), due to higher number of event responses when the
right ear was attended than when the left ear was attended,
there was no stimulus 3 event interaction (P > 0.05). This
suggests the ability to carry out the task (i.e., to distinguish
between targets and distracters) did not differ depending on
which ear was attended.
Electrophysiology Results
Based on the running t-tests carried out on the GFPs, we
identified the Nc and Pd components as being of particular
interest for further investigation. Nc and Pd were defined as the
Downloaded from https://academic.oup.com/cercor/article-abstract/21/6/1223/349063 by guest on 30 October 2018
Figure 3. Responses for indicated regions and GFPs for the stimuli presented at the left and right ears when attended and unattended (upper panels). Time intervals of interest
identified by running t-tests are shaded gray in the GFPs. Topographic maps of the Nc component when attended and unattended as well as difference topographies are shown in
lower panel.
�stimulus type (P > 0.05 for both). This tells us that there was
no hemispheric bias due to the spatial nature of the stimuli.
The possibility that increased activity in the Nc component
window may be due to an engagement of additional nonobligatory generators and not increased activity of the sensory
activity was investigated using the TANOVA method (Murray
et al. 2008). Topographies in attended and unattended
conditions for the LOW-LEFT response were not found to be
statistically different (LOW-LEFT attended vs. unattended: P =
0.5855). This suggested that the same generators were involved
in both attended and unattended conditions for the responses
to the LOW-LEFT stimulus. In the case of the HIGH-RIGHT
responses, however, the TANOVA did suggest that the topographies were statistically different between conditions (P =
0.0147). That said, the TANOVAs did not indicate statistically
dissimilar topographies between the LOW-LEFT unattended
and HIGH-RIGHT unattended responses (P = 0.3365) or
between the LOW-LEFT attended and HIGH-RIGHT attended
responses (P = 0.0874) suggesting that regardless of stimulus
similar generators were engaged.
To further investigate the location and strength of the Nc
generators and the possible attention affects, a dipole analysis
was carried out on the Nc component. Starting with the Nc
component of the unattended LOW-LEFT responses, we
attempted to fit 2 symmetrical regional sources (a regional
source in BESA consists of 3 orthogonal dipoles at the same
location). Fitting the sources to a window encompassing the
whole Nc component (111--154 ms: identified from the GFPs)
placed the sources at Talairach coordinates x = –32.6, y = –16.8,
z = 13.6. This configuration accounted for 98.88% of the
variance in the fitted window, and the sources are located
within 1 cm of Heschl’s gyrus (HG). In fact fixing the source
locations to the center of the auditory core (at talairach x = –46,
y = –24, z = 12) only slightly reduced the variance explained to
98.12%. Applying this same model to the attended LOW-LEFT
responses accounted for 96.76% of the variance. Thus, bilateral
sources in AC provided an excellent model of the Nc
component in both the attended and unattended conditions.
This coupled with the insignificant dissimilarity in topographies shown by the TANOVA indicates that the same sources
were involved when the stimulus was attended and unattended. Following the same procedure for the HIGH-RIGHT
responses resulted in an initial localization of the unattended
Nc to talairach coordinates x = –37.7, y = –24.9, z = 18.5 with
97.73% of the variance explained. Again this is within 1 cm of
HG and fixing the sources to the center of the auditory core as
before only slightly reduced the variance explained to 97.24%.
Applying this model to the attended HIGH-RIGHT responses
accounted for 93.36% of the variance. Although the model
accounted for slightly lower variance than in the case of the
LOW-LEFT stimuli bilateral sources in AC again provided an
excellent model of the Nc component. Employing the same
model for the LOW-LEFT and HIGH-RIGHT responses is backed
up by the TANOVA results, which suggest that both the LOWLEFT and HIGH-RIGHT stimuli employ similar generators when
unattended as well as when attended. Indeed, it is possible that
the lower signal power of the HIGH-RIGHT responses (indicated by the main effect of stimulus mentioned above)
may have played a part in TANOVA results that suggested
topographical differences between HIGH-RIGHT conditions.
These noisier responses may also account for the slightly lower
explained variance in the BESA model. Thus, the fact that
Cerebral Cortex June 2011, V 21 N 6 1227
Downloaded from https://academic.oup.com/cercor/article-abstract/21/6/1223/349063 by guest on 30 October 2018
RMS amplitude in a ~10 ms interval around the mean latency of
each component of the grand averages of the LOW-LEFT and
HIGH-RIGHT responses (i.e., Nc: 136 ms and Pd: 208 ms, see
Fig. 3). In order to test the effects of attention for each
stimulation condition, we performed a 4-way 2 3 2 3 4 3 2
repeated measures ANOVA using factors of stimulation (LOWLEFT stream vs. HIGH-RIGHT stream), attention (Attended vs.
Unattended), electrode region (left, right, central, and frontal),
and component (Nc vs. Pd). Greenhouse--Geisser corrections
were applied to the repeated measures factors where the
sphericity assumption was violated with the corrected degrees
of freedom reported.
First and most importantly, there was a main affect of
attention (F1,16 = 27.75, P < 0.001), indicating that components
of the responses to the attended stream were enhanced. There
was also a significant effect of stimulus (F1,16 = 54.004, P <
0.001). This is due to the fact that the later cortical responses
(i.e., Nc and Pd) to the LOW-LEFT stream are greater in
amplitude than responses to the HIGH-RIGHT stream. This is
likely due to the logarithmic nature of frequency representation in auditory cortex, that is, the higher the frequency the
smaller the amount of cortex devoted to it (Romani et al. 1982).
Using a wider carrier stimulus bandwidth for the higher
frequency stream may result in more similar HIGH and LOW
responses. There was no stimulus 3 attention interaction (P >
0.05), suggesting that both the HIGH-RIGHT and LOW-LEFT
streams were similarly affected by attention. A significant
attention 3 region 3 component interaction (F1.98,31.71 = 7.636,
P = 0.002) was found. To further interrogate the components
driving this interaction, we performed separate 2-way 2 3 4
repeated measures ANOVAs on Nc and Pd with factors of
attention (attended vs. unattended) and region (left, right,
frontal, and central). In the case of Nc, we found a significant
effect of attention (F1,16 = 20.28, P < 0.001) as well as
a significant attention 3 region interaction (F3,48 = 3.44, P =
0.024). In the case of Pd, the effect of attention was not
significant (P > 0.05), although there was an attention 3 region
interaction (F3,48 = 7.41, P < 0.001). In order to ascertain the
regions driving these interactions, post hoc t-test were carried
out and identified the Nc effect to be driven by attention in left
(t16 = 5.21, P < 0.001), right (t16 = 4.1, P = 0.001), central (t16 =
4.6, P < 0.001), and frontal (t16 = 2.4, P = 0.027) regions. The Pd
interaction was driven by an effect in the frontal region (t16 =
2.4, P = 0.027). Employing bonferonni correction, however,
resulted in a significant Nc effect only in left, right, and central
regions but no Pd effect. This suggests that the Pd effect
indicated by the running t-test performed on the GFP is
marginal, whereas the Nc effect is robust. This is further
indicated by an attention 3 component interaction in the initial
4-way ANOVA that approached significance (F1,16 = 3.138, P =
0.096).
Just because both left and right regions are similarly affected
by attention does not rule out the possibility that responses
may be biased to one hemisphere over the other. Since it has
been suggested that spatial processing may by lateralized
(Zatorre and Penhune 2001; Spierer et al. 2009), we sought
investigate whether this was the case here. The initial 4-way
ANOVA resulted in a stimulus 3 region interaction (F3,48 =
10.02, P < 0.001). This allowed us to perform post hoc t-tests
on the LEFT-LOW and HIGH-RIGHT responses to inspect the
regional differences driving this interaction. We found no
difference between the right and left regions for either
�the responses with the higher signal-to-noise ratio (i.e., the
responses to the LOW-LEFT stimulus) did not result in
statistically significant topographical differences combined
with the fact that the Nc component in all stimulus conditions
is well explained by sources located in AC suggests that the Nc
modulation results from an enhancement of the obligatory
sensory activity in AC and not the engagement of supplementary nonobligatory activity.
Discussion
1228 Endogenous Auditory Spatial Attention
d
Power et al.
Downloaded from https://academic.oup.com/cercor/article-abstract/21/6/1223/349063 by guest on 30 October 2018
In this study, we used continuous and simultaneous competing
stimuli to assess endogenous auditory attention in a cocktail
party-like environment. The use of continuous stimuli has
eliminated possible confounding effects associated with
exogenous attention and discrete stimulation. We found
a strong attentional effect of the Nc component in left and
right hemispheres as well as central areas. Since the AESPA
response primarily represents obligatory sensory processing
and since Nc generators have been localized to AC, we have
shown that sensory processing in AC is modulated by
endogenous top-down attention.
Our results are at odds with Näätänen’s attentional trace
hypothesis (Näätänen 1982), which suggests that obligatory
sensory components are not affected by attention. He proposes
that attention acts by way of an endogenous processing
negativity (PN), which is due to a comparison process between
the neural representation of the stimulus and the relevant
attentional trace. This PN overlaps and is superimposed on true
sensory processes giving the impression of modulation of
sensory activity in many cases. Näätänen et al. (1992) do
concede that in some instances simultaneous effects on
sensory activity cannot be ruled out entirely due to the
inability of current methods to distinguish between obligatory
sensory activity and overlapping voluntary activity. They remain
skeptical, however, of the involvement of sensory processes in
attention effects (Näätänen et al. 1992). Although we have
isolated an endogenous attention effect on obligatory sensory
processes, due to the nature of AESPA responses we are
precluded from investigating the undeniably important voluntary components, such as the PN, which are not well
synchronized to stimulus fluctuations. Our results do agree
with Hillyard et al. (1973), however, who suggests that sensory
processes are affected by attention. The results also agree with
the findings of Woldorff et al. (1993), who found attentional
modulation of activity localized to AC in the ranges 20--50 ms
and 80--130 ms and argue that these effects are due to
attentional modulation of sensory processes.
Recently, evidence has been emerging that the majority of
sound feature processing is achieved subcortically and that AC
represents sounds in terms of auditory objects (Nelken 2004).
Furthermore, it has been suggested that AC is involved in
sensory memory (Näätänen and Winkler 1999; Näätänen 2001;
Ulanovsky et al. 2003). A suggested mechanism for sensory
memory is stimulus-specific adaptation (SSA; Ulanovsky et al.
2003), which has been posited as a possible neuronal correlate
both of the decreased N1 to repeated stimuli and of the
mismatch negativity. SSA is the process by which neurons
decrease their responses to sequences of identical stimuli, i.e.,
the activity of neurons is affected by stimulus history.
Furthermore, activity of sustained responses has been shown
to be significantly affected by SSA (Ulanovsky et al. 2003) and
thus, due to the continuous nature of the AESPA stimulus, it is
likely that our responses primarily represent activity of the
subset of neurons that are least susceptible to SSA. That is to say
those cells most susceptible to SSA would contribute minimal
activity in response to a continuous stimulus, whereas those
least susceptible to SSA, that is, the neurons least involved in
sensory memory and most involved in feature processing,
would contribute most to the response. This would suggest
that the attention effect found here is due to enhanced feature
processing and not related to sensory memory representation.
Also, the fact that SSA has been shown to be more prominent
for sustained responses than for onset responses of neurons in
primary AC (Ulanovsky et al. 2003) may account for the smaller
size of the Nc components relative to the AEP-N1 component
(Lalor et al. 2009).
Although we only found attentional effects around 136 ms, it
is possible that earlier AESPA components, especially the Nb
and Pc components, may be affected by attention and but these
components are somewhat ill defined. This may be due to the
frequency content of the carrier stimuli: Previously, these
components were seen to be ill defined when a 1 kHz tone was
used as the carrier stimulus as opposed to broadband noise
(Lalor et al. 2009). A wider carrier stimulus bandwidth may
allow for a more detailed investigation of these components.
The lack of an early effect on well-defined components such as
Pa may be due to the nature of the task employed here. It has
been shown that the locus of attention is flexible and varies
depending on the processing stage most heavily loaded by the
task in question (Vogel et al. 2005; Kelly et al. 2008). We
employed a difficult event discrimination task (i.e., discrimination between targets and distracters), which is likely to load
later processes as opposed to simpler frequency deviant
identification tasks (e.g., Woldorff et al. 1993).
Recent efforts at assessing attention to simultaneously
presented stimuli have looked at transient responses to the
onset of amplitude-modulated sounds (Ross et al. 2010).
Attentional modulation was found as early as 143 ms and was
localized to AC. However, whether this is due to increased
sensory activity or a separate endogenous effect is not clear.
Furthermore, whether this effect has been diluted by unaffected or inhibited responses to the simultaneous unattended
stimulus is unclear. Thus, not only has employing the AESPA
method allowed for the investigation of endogenous attention
effects on obligatory sensory processes that are unaffected by
simultaneous voluntary components, it has also allowed for the
isolation of truly separate responses to concurrent stimuli. That
said, however, we can only assert that sensory processes are
affected by endogenous attention and cannot investigate the
certain effects of endogenous attention on nonsensory
cognitive processes.
A recent attempt was made to examine attention in
a competing stimulus environment using an intricate paradigm
(Bidet-Caulet et al. 2007). The authors of that study assessed
both transient responses and SSRs from depth electrode
recordings in patients with epilepsy. While the results from
this study were encouraging, they exhibited a number of
inconsistencies: Responses to certain stimuli were enhanced
when attended in some conditions and reduced when attended
in other conditions, and no attention effects were found in
a significant number of subjects. Furthermore, the use of onsets
and SSRs precluded the assessment of the timing of attentional
enhancement during sustained attention. This study also
�Funding
Irish Research Council for Science, Engineering and Technology.
Notes
We thank Dr Simon P. Kelly for useful comments on the manuscript and
Dr Robert Whelan for assistance with the statistical analysis. Conflict of
Interest: None declared.
References
Ahveninen J, Jääskeläinen IP, Raij T, Bonmassar G, Devore S,
Hämäläinen M, Levänen S, Lin F-H, Sams M, ShinnCunningham BG, et al. 2006. Task-modulated ‘‘what’’ and ‘‘where’’
pathways in human auditory cortex. Proc Natl Acad Sci.
103:14608--14613.
Alho K, Teder W, Lavikainen J, Näätänen R. 1994. Strongly focused
attention and auditory event-related potentials. Biol Psychiatry.
38:73--90.
Bidet-Caulet A, Fischer C, Besle J, Aguera PE, Giard MH, Bertrand O.
2007. Effects of selective attention on the electrophysiological
representation of concurrent sounds in the human auditory cortex.
J Neurosci. 27:9252--9261.
Cohen YE, Knudsen EI. 1999. Maps versus clusters: different representations of auditory space in the midbrain and forebrain. Trends
Neurosci. 22:128--135.
De Sanctis P, Ritter W, Molholm S, Kelly SP, Foxe JJ. 2008. Auditory
scene analysis: the interaction of stimulation rate and frequency
separation on pre-attentive grouping. Eur J Neurosci. 27:
1271--1276.
Escera C, Alho K, Schröger E, Winkler I. 2000. Involuntary attention and
distractability as evaluated with event-related potentials. Audiol
Neurootol. 5:151--166.
Hillyard SA, Hink RF, Schwent VL, Picton TW. 1973. Electrial signs of
selective attention in the human brain. Science. 182:177--180.
Hopfinger JB, West VM. 2006. Interactions between endogenous and
exogenous attention on cortical visual processing. Neuroimage.
31:774--789.
Jonides J. 1981. Voluntary versus automatic control over the mind’s eye
movement. Atten Perform. 9:187--203.
Kelly SP, Gomez-Ramirez M, Foxe JJ. 2008. Spatial attention modulates
initial afferent activity in human primary visual cortex. Cereb
Cortex. 18:2629--2636.
Kerlin JR, Shahin AJ, Miller LM. 2010. Attentional gain control of
ongoing cortical speech representations in a ‘‘Cocktail Party’’.
J Neurosci. 30:620--628.
Lalor EC, Foxe JJ. 2010. Neural responses to uninterrupted natural
speech can be extracted with precise temporal resolution. Eur J
Neurosci. 31:189--193.
Lalor EC, Power AJ, Reilly RB, Foxe JJ. 2009. Resolving precise temporal
processing properties of the auditory system using continuous
stimuli. J Neurophysiol. 102:349--359.
Lehmann D, Skrandies W. 1980. Reference-free identification of
components of checkerboard-evoked multichannel potential fields.
Electroencephalogr Clin Neurophysiol. 48:609--621.
Linden RD, Picton TW, Hamel G, Campbell KB. 1987. Human auditory
steady-state evoked potentials during selective attention. Electroencephalogr Clin Neurophysiol. 66:145--159.
Murray MM, Brunet D, Michel CM. 2008. Topographic ERP analyses:
a step-by-step tutorial review. Brain Topogr. 20:249--264.
Näätänen R. 1982. Processing negativity: an evoked-potential reflection
of selective attention. Psychol Bull. 92:605--640.
Näätänen R. 2001. ‘‘Primitive Intelligence’’ in the auditory cortex.
Trends Neurosci. 24:283--288.
Näätänen R, Picton T. 1987. The N1 wave of human electric and
magnetic response to sound: a review and analysis of component
structure. Psychophysiology. 24:375--425.
Näätänen R, Teder W, Alho K, Lavikainen J. 1992. Auditory attention and
selective input modulation: a topographical ERP study. Neuroreport.
3:493--496.
Näätänen R, Winkler I. 1999. The concept of auditory stimulus
representation in cognitive neuroscience. Psychol Bull.
125:826--859.
Nelken I. 2004. Processing of complex stimuli and natural scenes in the
auditory cortex. Curr Opin Neurobiol. 14:474--480.
Pinek B, Duhamel JR, Cavé C, Brouchon M. 1989. Audio-spatial deficits
in human: differential effects associated with left versus right
hemisphere parietal damage. Cortex. 25:175--186.
Rauschecker JP, Tian B. 2000. Mechanisms and streams for processing
of ‘‘what’’ and ‘‘where’’ in auditory cortex. Proc Natl Acad Sci U S A.
97:11800--11806.
Cerebral Cortex June 2011, V 21 N 6 1229
Downloaded from https://academic.oup.com/cercor/article-abstract/21/6/1223/349063 by guest on 30 October 2018
posited a dominant role for left hemisphere in attentional
selection with right hemisphere being inhibited as a function of
attentional load. This is at odds with our results that show
voluntary attentional enhancement effects over both left and
right hemispheres and no lateralization of responses. However,
further inspection of their results reveals attentional enhancement in right hemisphere for a number of attentional
conditions, suggesting that it may be premature to make strong
conclusions about the hemispheric specialization of auditory
attention in sensory areas.
There is much debate relating to lateralization of attentional
and spatial processing with some studies favoring a right
hemisphere dominance (Tanaka et al. 1999; Spierer et al.
2009), others a left lateralization (Pinek et al. 1989), others
a bias to the hemisphere contralateral to the stimulus (Zatorre
et al. 1995), others whole field neglect following unilateral
lesions, that is, no difference between left and right lesion
subjects (Zatorre and Penhune 2001). Indeed, in their study that
encountered mixed lateralization results when studying patients
with unilateral temporal lobe excisions either encroaching on or
sparing HG Zatorre and Penhune (2001) summed up the
observed variation succinctly: ‘‘the existence of individual
differences likely illustrates differential patterns of functional
lateralization.’’ Thus, the possibility of a predominant lateralization of spatial processing in auditory cortex is still an open
question. Our results suggest that intensity processing is not
affected by the spatial properties of a stimulus. This does not rule
out the possibility of the involvement of spatially sensitive
centers, not represented in the intensity processing characterized by the AESPA responses, which may be lateralized:
Frequency-specific interaural time differences, interaural level
differences as well as monaural amplitude spectrum cues are
thought to integrate in a nonlinear fashion to create a map of
space represented by location-specific neurons (Cohen and
Knudsen 1999). Thus, since the activity of these location-specific
neurons is not linearly related to the intensity of the stimulus
then it is unlikely to be accounted for in the AESPA response.
This would further back up our assertion that the AESPA
response is due to the activity of intensity processing neurons
only (Lalor et al. 2009). In light of this, the current results,
although enlightening as to the effect of endogenous attention
on intensity processing, are not directly comparable with
previous studies on the lateralization of spatial processing.
Furthermore, there has been much interest in the purported
separation of ‘‘what’’ and ‘‘where’’ streams in the auditory system
(Rauschecker and Tian 2000; Tian et al. 2001; Ahveninen et al.
2006). Given that amplitude modulation is the driving feature of
the stimulus employed here (i.e., a likely what feature), it may be
that the what stream is preferentially driven by the current
implementation of the AESPA method and thus activity of the
location relevant where stream is not represented. Implementation of a paradigm whereby the intensity of a stimulus is kept
constant but the location of the stimulus is modulated would
shed further light on this possibility.
�1230 Endogenous Auditory Spatial Attention
d
Power et al.
unilateral visuospatial neglect. J Neurol Neurosurg Psychiatry.
67:481--486.
Tian B, Reser D, Durham A, Kustov A, Rauschecker JP. 2001. Functional
specialization in rhesus monkey auditory cortex. Science.
292:290--293.
Ulanovsky N, Las L, Nelken I. 2003. Processing of low-probability
sounds by cortical neurons. Nat Neurosci. 6:391--398.
Vogel EK, Woodman GF, Luck SJ. 2005. Pushing around the locus of
selection: evidence for the flexible-selection hypothesis. J Cogn
Neurosci. 17:1907--1922.
Woldorff M, Gallen CC, Hampson SA, Hillyard SA, Pantev C, Sobel D,
Bloom FE. 1993. Modulation of early sensory processing in human
auditory cortex during selective attention. Proc Natl Acad Sci U S A.
90:8722--8726.
Zatorre RJ, Penhune VB. 2001. Spatial localization after excision of
human auditory cortex. J Neurosci. 21:6321--6328.
Zatorre RJ, Ptito A, Villemure JG. 1995. Preserved auditory spatial
localization following cerebral hemispherectomy. Brain. 118:
879--889.
Downloaded from https://academic.oup.com/cercor/article-abstract/21/6/1223/349063 by guest on 30 October 2018
Ritter W, De Sanctis P, Molholm S, Javitt DC, Foxe JJ. 2006.
Preattentively grouped tones do not elicit MMN with respect to
each other. Psychophysiology. 43:423--430.
Romani GL, Williamson SJ, Kaufman L. 1982. Tonotopic organization of
the human auditory cortex. Science. 216:1339--1340.
Ross B, Hillyard SA, Picton TW. 2010. Temporal dynamics of
selective attention during dichotic listening. Cereb Cortex.
20:1360--1371.
Ross B, Picton TW, Herdman AT, Hillyard SA, Pantev C. 2004. The effect
of attention on the auditory steady-state response. Neurol Clin
Neurophysiol. 22:1--4.
Spierer L, Bellmann-Thiran A, Maeder P, Murray MM, Clarke S. 2009.
Hemispheric competence for auditory spatial representation. Brain.
132:1953--1966.
Sussman E, Ritter W, Vaughan HG, Jr. 1999. An investigation of the
auditory streaming effect using event-related brain potentials.
Psychophysiology. 36:22--34.
Tanaka H, Hachisuka K, Ogata H. 1999. Sound lateralisation in patients
with left or right cerebral hemispheric lesions: relation with
�
 Richard Reilly