Innovation, Indicators and Developmental Challenges for the BRICS
RASIGAN MAHARAJH, PHD
1. Introduction
In the period subsequent to the Fifth Academic Forum of BRICS in South Africa in
2013, many of the individual members of this six-year old multilateral association of
countries have experienced rapid changes with respect to the value of their
respective national currencies. Currency prices play a significant role in calculating
the gross domestic product of any country and rapid fluctuations may generate
adverse impacts, including cost effects in debt servicing obligations. Longer-term
investment planning is significantly influenced.
Figure 1
South African Paper for Technical Session 5 ‐ Innovation Challenges in the BRICS, 6th BRICS Academic Forum:
City Palace, Rio De Janeiro, Brazil, 18 – 19 March 2014.
Founding Chief Director: Institute for Economic Research on Innovation (IERI), Tshwane University of
Technology, RSA; Visiting Scholar: George Perkins Marsh Institute (GPMI), Clark University, USA; Associate
Research Fellow: Tellus Institute, Boston, USA; and Nodal Head: Department of Science and Technology and
National Research Foundation Centre of Excellence in Scientometrics and Science, Technology and
Innovation Policy, RSA.
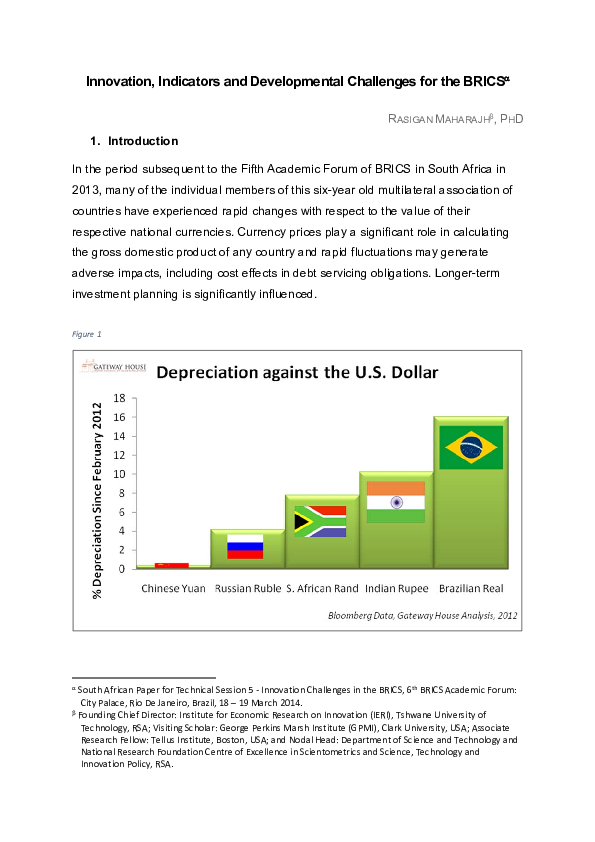
�Figure 1 provides a graphic illustration of the changes during the previous two years.
Three of the constituent members of BRICS have subsequently been included
amongst counties labelled as the ‘fragile five’ (Morgan Stanley: 2013: 1). According
to their Global Currency Research Team: India, Brazil and South Africa had amongst
the “most vulnerable currencies over the medium term” (ibid.: 2). Their analysis
suggests that the Real, Rupee and Rand would “face headwinds over the medium
term from various factors ranging from high inflation, high Real Effective Exchange
Rates, external vulnerability from initial conditions, and vulnerability to further
external deterioration based on a heavy reliance on fixed income flows and/or China
related risks” (ibid.: 16). The value of currencies of Brazil, India, and South Africa
have all significantly devalued against the US Dollar.
Most orthodox economists ascribe this to a return to longer term trends whereby
capital sought refuge in the US Dollar. This tendency was particularly enhanced
when the Federal Reserve of the United States of America began reducing its
“quantitative easing” mechanism. Financial markets, ostensibly globalised,
responded with speed and mobility. Little consideration if any, it would appear, was
afforded to the deeper structural transformative activities being undertaken in the
BRICS. Under such circumstances, the capacity of national regulatory institutions to
defend their sovereignty through policy interventions aimed at responding to the
rapidity of capital surges (both inflows and outflows) was severely curtailed.
Structural reform in all of the BRICS remain a critical necessity as they seek to
improve the general quality of living of their populations within the parameters of
sustainable development and the threat of planetary ecological tipping points (UN:
2012). This forces massive outlays in extending public infrastructures and building
the necessary human capabilities for progressive development. Such initiatives must
therefore become more resilient and each country will need to pay more attention to
the quality of investments. Even Morgan Stanley seemingly agree as they argue that
Page 2 of 16
�the “most sustainable way to improve capital flow prospects is for governments to
engage in structural reform, enhance competitiveness and boost growth potential”
(2013: 19).
Mobilising and utilising a country’s national science, technology and innovation (STI)
resources provides fundamental building blocks towards unleashing the forces of
‘creative destruction’ and its innovation potential. This intervention argues that the
BRICS should renew, upgrade and improve their STI performance as a critical
contributor towards the maintenance of their momentum as fast emerging
economies. Besides the rather self-fulfilling prophecy as articulated in Item Eleven of
the Founding Declaration that reaffirmed the BRICS commitment to “advance
cooperation among our countries in science and education with the aim, inter alia, to
engage in fundamental research and development of advanced technologies”
(BRICS: 2009), there is an emergent recognition that the BRICS collectively (albeit
unevenly and imperfectly) represent an alternative to the conventional orthodoxies of
capitalist growth models (Cassiolato and Vitorino: 2011).
This brief paper presents some of the recent dynamics in the BRICS countries as
represented in their STI Indicators. After this introduction, section two presents some
of the most recent STI data from South Africa. Section three provides some of the
recently published comparative STI performance data and selected recent
collaborative studies. Section four concludes the brief intervention by drawing the
together the argument for the formulation of an enhanced research agenda based on
increased intra-BRICS collaboration with the object of generating shared learning in
the praxis of STI implementation.
2. Innovation Systems, Indicators and the South African Data
The general objective sought by utilising a National System of Innovation (NSI)
framework to organise the productive structure of a country is to increase the rate of
Page 3 of 16
�generating novel solutions to developmental constraints. Effectively, this means
encouraging ‘creative destruction’ and optimising the performance of STI actors.
Such a conceptual construction presents the NSI paradigm a critical policy and
strategy instrument for improving the generation, deployment, utilisation and
diffusion of STI capacities, capabilities, and competences across an economy. When
the NSI is thoroughly interlinked with the productive and reproductive structures of
the political economy, the emergence of new products, services, enterprises and
even markets becomes realisable (IERI: 2014).
In its original formulation, ‘creative destruction’ formed the crucial dynamic of the
capitalist mode of production. According to this perspective, the dynamic economy
incessantly destroys its older version whilst constantly creating a new variety.
Joseph Schumpeter had defined ‘innovation’ as being the result of the: 1)
introduction of a new good or a new quality of the good; 2) introduction of a new
method of production; 3) opening of a new market; 4) conquest of a new source of
supply; and 5) carrying out of the new organisation of an industry (1934). The NSI
framework subsequently systematised these concepts and initiated a policy
discourse that can be conducted in a structured format utilising shared definitions,
tools and methodologies. Thereby, a commonly employed NSI framework potentially
improves the quality of policy discourse. Commensurately, the deployment of the
NSI framework enables the building of critical capacities and capabilities for
conducting policy research and analysis whilst simultaneously expanding
competencies for managing implementation through comparative measurements of
outcomes, impacts and indicators of change. Forged as a competency, the NSI
framework provides for continuous improvements in public policy through
transparent research and enhanced participation by stakeholders, role-players and
the citizenry at large.
It should be noted that the adoption of any defined framework for understanding a
socio-economic and political dynamic also affords that it be utilised to advance
certain agendas and repress alternatives. As these capabilities improve, so too does
the capacity for more advanced formulations and opportunities for learning in
Page 4 of 16
�simulations, cases and comparative studies. Based on the processes being
collaboratively determined and open to contestation, both progressive and
reactionary outcomes and impacts are possible.
Guided by the consensus of the BRICS in seeking an equitable, sustainable, just and
harmonious global future, the NSI framework additionally provides tools for
redefining development and reconstructing appropriate institutional arrangements
and rebuilding the necessary agencies for transformation. The progressiveness of
these new institutions will largely be determined by their capacity to deliver
improvements in the material conditions of the vast majority of people, redressing the
metabolic rift with the planetary ecosystem, and the provision of social, economic
and political innovations (Maharajh: 2013).
A crucial aspect of the NSI framework is the representation of stylised facts derived
from a commonly held set of indicators that reflect changes over time. South Africa
has since the advent of its constitutional democracy in 1994 utilised the NSI
framework as its heuristic device (RSA: 1996). The White Paper on Science and
Technology represented a major innovation in governance as it sought to
concurrently redress historical injustices, afford contemporary reform whilst building
a normatively better system that was futures orientated1. The development of the
STI sector and the stand-alone status of the Ministry of Science and Technology
achieved in 2002, saw increasing attention being devoted to data gathering,
information collation and indicators generation. The ninth in a dataset series derived
from a National Survey of Research and Experimental Development (R&D Survey)
was published in South Africa at the end of 2013. The DST argues that the R&D
Survey provides it with data that is “vitally important in monitoring the performance of
the National System of Innovation” (RSA: 2013: 1).
11
For various reviews of the transformation of post‐apartheid science and technology policy, see: Adam;
Bawa; Kahn; Kaplan; Maharajh (2011); Marie; Mjware; Mouton; Mullin; Scerri (2009); and Singh amongst
others.
Page 5 of 16
�The results were generated utilising a survey that was compiled according to
guidelines established in “The Measurement of Scientific and Technological
Activities: Proposed Standard Practice for Surveys on Research and Experimental
Development” by the Organisation for Economic Cooperation and Development
(OECD: 2002)2.
The South African version of the Survey was adopted and adapted through a careful
and deliberate act of international scientific collaboration. In this process, the national
Department of Science and Technology (DST) acted as the political centre of the
exercise, vested implementation through the provision of ‘ring-fenced’ funding and
created the Centre for Science Technology and Innovation Indicators (CeSTII) which
is housed within one of the country’s Science Councils: the Human Sciences
Research Council. A Reference Group which brought together some of the service
provider’s from the previous regime, science policy activists and academics helped
guide the initial efforts of CeSTII.
The agency responsible for maintaining national statistics, Statistics South Africa has
also become more involved in the quality assurance of the process. CeSTII has
played a significant role in improving the measurement instruments and now delivers
better quality data that is safeguarded from the vagaries of private sector service
provider distortions, the exigencies of public policy changes and makes available
verifiable data to policy analysts and scholars. With the recent announcement by the
Minister of Science and Technology of a new national Centre of Excellence in
Scientometrics and STI Policy in 2014, the further protection and development of this
field of study is being institutionalised and capabilities deepened (RSA: 2014).
2
Frascati Manual. The OECD had adopted the methodology in 1963 at a meeting in Frascati, Italy and the first
version of the survey was drafted by Christopher Freeman, then affiliated with the National Institute of
Economic and Social Research in London, and “who was assigned at the time to improving the survey on
industrial R&D conducted by the Federation of British Industries” (Godin: 2008: 15).
Page 6 of 16
�The published STI data is considered part of the country’s official national statistics.
According to the Minister of Science and Technology, the R&D Survey “provides
information on R&D funding and performance in South Africa. The data help to
profile the size and shape of the R&D landscape and support the production of
statistics for use in system-level planning, monitoring and evaluation” (RSA: 2013:
iii). These are indeed laudable intentions and speak to the core of utilising credible
evidence in the support of planning, monitoring and evaluation. Based on the R&D
Survey, the DST discerns five critical indicators. These are:
1. Gross domestic expenditure on research and development
2. Flows of funding for R&D
3. R&D expenditure by economic sector, field of research and socio-economic
objectives
4. R&D personnel by category (researchers, technicians and related skilled R&D
personnel) and the time that they devote to R&D
5. R&D involving local and international collaborations.
Table 1: Summary of NSI Indicators from South African R&D Surveys
1993/94
1997/98
2001/02
2003/04
2004/05
2005/06
2006/07
2007/08
2008/09
2009/10
2010/11
Total
Researchers7
Total
Researchers
per 1000 of
Total
Employment8
1991/92
GERD3
GERD/GDP4
Total R&D
Personnel5
Total R&D
Personnel per
1000 Total
Employment6
3
1.04
3
0.75
4
0.69
8
0.76
34
10
0.81
25
12
0.87
30
14
0.92
29
17
0.95
31
19
0.93
31
21
0.92
31
21
0.87
31
20
0.76
29
2.3
2.2
2.6
2.4
2.5
2.4
2.2
2.3
2.2
9
14
18
17
19
19
19
20
19
1.9
1.2
1.6
1.5
1.5
1.5
1.4
1.5
1.4
3
Gross domestic Expenditure on Research and Development in nearest billion Rand. “GERD is total intramural
expenditure on R&D performed on the national territory during a given period” (OECD: 2002: 121)
4
Gross domestic Expenditure on Research and Development as a percentage of Gross Domestic Product.
5
Full‐Time Equivalents of Research and Development Personnel in thousands.
6
Full‐Time Equivalents.
7
Full‐Time Equivalents of Researchers in thousands.
8
Full‐Time Equivalents.
Page 7 of 16
�Total
Researchers9
% Women
Researchers10
Source: Maharajh: 2011 & RSA: 2013
19
31
37
39
40
40
40
41
38
35
38
38
39
40
40
40
41
42
Table 1 clearly displays an initial upward trend with respect to the key NSI Indicators
in South Africa. These have however tapered towards the end of the period and are
now in decline. The DST had failed to achieve its declared target of one percent of
GERD by its original goal date of 2010. As the 1% target had become part of the
African Union objectives for Science and Technology on the continent, the DST had
revised its target to 1.5% by the year 2014 (RSA: 2011). Unfortunately, the DST
could again miss its revised target in this year, but that will only be determined when
the 10th Survey Results are published. It continues to learn and utilise the target as a
crucial reference point for budgetary allocations from the National Treasury.
The total FTE R&D personnel has stabilised after a major decline in 2003. In real
money terms, it is obvious that, although GERD rose at a phenomenal pace, the rate
of growth has plateaued and is now in decline. These features hold significant
implications for current NSI planning and the utilisation of indicators. As quantitative
indicators they however do not provide sufficient explanatory insights for a nuanced
understanding of South Africa’s transformation process that is now all of two
decades in the making. In the next section, we will look at some broader mixed
method studies whose focus was sectorial and comparative across the BRICS.
2. BRICS Comparative Indicators and Studies
The field of measuring performance in STI is dynamic and growing. Subsequent
developments have spawned a range of additional instruments although they largely
remain anchored to the Frascati Family of Manuals (Gault: 2013). By 2011, the
OECD had recognised that “(w)ithin the developing world, R&D is also concentrated
9
Headcount in thousands of Researchers.
Expressed as a percentage of Total Researchers.
10
Page 8 of 16
�in a relatively small group of countries in each region, notably the BRICS” (OECD:
2012: 3). The first BRICS Science, Technology and Innovation Ministerial Meeting
took place in February 2014 and recognised that “the sharing and exchange of
information on science, technology and innovation policies and strategies and the
formulation of joint long-term problem focused cooperation programmes will
constitute the central modalities of this cooperation” (BRICS: 2014: 2). It is expected
that these plans are endorsed by the Sixth Summit in Fortaleza in 2014.
Consolidating planning across five countries however demands improved
comparative reflections on the relative performance of each of the BRICS countries
and the collaborative efforts between them. Table 2 presents the GERD data for the
BRICS.
Table 2: Gross Domestic Expenditure on Research and Development in BRICS (Millions of current PPP$)
2008/09
2009/10
2010/11
Brazil
22.2
23.4
25.3
Russia
30.1
33.5
32.8
India
Nd
Nd
Nd
China
120.7
154.0
178.2
South Africa
4.7
4.4
4.0
Source: RSA: 2013: 33
The quantum differences are stark in Table 2, but then so is the economic size of the
different countries and their individual circumstances. Three of the BRICS display a
very strong upward trajectory with significant resources being devoted to research
and development. These three countries are also reaping the benefits of these
investments by the expansion of productive capabilities and improvements in their
respective domestic markets.
Table 3 presents the GERD/GDP ratio of the five countries for the latest year for
which data is available. Only India and South Africa remain under the 1% marker. On
the basis of the scale of China’s GDP relative to the other members of BRICS, its
1.77% is indeed and exemplary and remarkable achievement.
Page 9 of 16
�Table 3: Gross Domestic Expenditure on Research and Development in BRICS as a percent of GDP (2010/11)
Brazil
1.16
Russia
1.16
India (2007)
0.76
China
1.77
South Africa
0.76
Source: RSA: 2013: 32
Table 4 looks at the number of full-time equivalent researchers per 1000 of the
country’s population that are employed. In this regard and on the basis of a
significant historical advantage due largely to nearly a century of state public
investments in S&T, Russia’s current ratio is incredibly strong. This could prove of
particular value to the global challenges of the conjuncture and as well for intraBRICS collaboration.
Table 4: FTE Researchers per 1000 Employment in BRICS (2010/11)
Brazil
1.46
Russia
6.33
India (2005)
0.35
China
1.59
South Africa
1.40
Source: RSA: 2013: 35
While quantitative comparisons serve the purpose of providing discrete data in an
immediately understandable form, explaining the reasons for some performances
requires more detailed and mixed-method appraisals. In 2005, a group of
researchers who were affiliated with the Global Network for the Economics of
Learning, Innovation and Competence-building Systems (GLOBELICS) further
developed an ambitious research proposal to study the five countries of BRICS. The
announcement of the Project at 3rd Annual Conference of GLOBELICS held in South
Africa in 2005 was followed by a workshop convened at Aalborg University early in
2006. All of the government departments responsible for science and technology in
all five of the BRICS indicated their support for the research project which also
received funding from the International Research Development Centre (IDRC)11.
11
IDRC Grant Number 104227‐011: ‘National Innovation Systems of BRICS Countries.’
Page 10 of 16
�In the volume on the role of the State, Mario Scerri and Helena Maria Martins
Lastres show how the specific cases of the five systems recognised that the five
countries of BRICS were and are undergoing rapid processes of structural
transformation. Scerri and Lastres therefore suggest that all five cases “assess the
relationship between innovation policy and development policy, its convergence or
dissonance, and even more fundamentally the degree of differentiation between the
two” (Scerri and Lastres: 2013: 14).
In the volume on the role of SMEs in the National Systems of Innovation of BRICS,
Anna Arroio and Mario Scerri argue that the five cases show how the BRICS
countries “have pursued specific strategies to enhance SME’s growth, their chances
of survival, and the support institutions that provide business, technological and
other development services. Innovation policies have targeted the promotion of
agglomerations of firms, incubators and science and technology parks. There
appears, however, to be a sharp distinction between policies that target high-tech
innovative SMEs and those policies that aim to support the ‘survivalist SME
economy’” (Arroio and Scerri: 2013: 23). The fifth summit of the BRICS embraced
these views and declared that “we will explore opportunities for cooperating in the
field of SMEs and recognise the need for promoting dialogue among the respective
Ministries and Agencies in charge of the theme, particularly with a view to promoting
their international exchange and cooperation and fostering innovation, research and
development” (2013: Outcome 19).
In the volume on the role of TNCs in the national system of innovation of BRICS
countries, a broad definition of the national systems of innovation approach was
adopted. The editors of the volume, José Eduardo Cassiolato, Graziela Zucoloto,
Dinesh Abrol and Liu Xielin, argue that “the thesis of technological globalisation is
taken with more caution, refuting the idea that R&D activities would be inexorably
internationalised” (Cassiolato et al: 2013: 6). In particular, they suggest that “that the
complexity involved in innovative activities, like R&D, limits the occurrence of
technological globalization automatically and without significant costs, and argues
Page 11 of 16
�that knowledge-intensive activities still tend to be concentrated in home countries”
(ibid).
In the volume on financing, the editors Michael Kahn and Luiz Martins de Melo find
that the key commonality amongst the BRICS countries was the strong role played
by the State in steering their respective economic development paths (2013). The
five country studies recognise that financing investments in innovation remains an
important structural bottleneck, whilst noting that these problems are not being
resolved exclusively by private sector financial institutions. The BRICS reassert the
importance of “national institutional arrangements” as a means towards redressing
the “long lead times for development, inherent uncertainty and high risk” (ibid.).
In the volume on inequality, Maria Clara Couto Soares, Mario Scerri and Rasigan
Maharajh suggest that the benefits of innovations rarely address the needs of the
poor, because most STI systems and policies are aimed at achieving economic
growth and competitiveness and not at reducing poverty or inequalities (Soares et al:
2013). The coexistence of economic growth, substantial investments in STI,
increasing inequality, and the persistence of people living in poverty remains a major
challenge. The BRICS are increasingly concerned about this phenomenon and they
remain seized by the search for more inclusive and ‘harmonious’ pathways to
achieve improved conditions of existence for their people within the constraints of
ecological sustainability (ibid.).
3. Conclusions: Learning and Leading – The Role of STI Indicators in
Driving Change.
The contemporary state of world systems evolution and the current phase of the
globally hegemonic capitalist mode of production is characterised by significant and
enduring geopolitical shifts. Collectively, the peoples of the planet are exposed to an
expanding potential of breaching of ecological thresholds and persistent failures in
Page 12 of 16
�conventional multilateral institutions in redressing global precariousness.
Exasperatingly, waves of extensive and intense financial market integration
threatens the sovereignty of economic policy making. Thus, investment decisions
and the empirical basis for determining currency fragility tends towards being the
prerogative of international ratings agencies and trans-national financial capital.
A safeguard against the vagaries of asymmetrical and imperfect market sentiment
are to be found in persistent and continuous efforts in building strong and consistent
policy frameworks, the necessary public infrastructures and the capabilities to
promote innovation. The deliberative and explicit utilisation of the NSI concept
affords the emerging economies generally and the BRICS in particular the
opportunity to radically improve their respective productive structures. The literature
shows that efforts at promoting linkages between the productive sector (enterprises)
and arena of societal reproduction (households) with knowledge-generating
resources results in enhancing the resilience of institutions and engendering
endogenous economic development.
Evidence is also growing that the performance of NSIs are historically contingent,
contextually bound, and representative of the dynamics of the country’s political
economy (see the various BRICS Country studies). As pointed out by Professor Ben
Turok, MP in his preface to Volume 1 of the BRICS NSI Project: “… there is ample
scope for comparative studies and hence cooperation in science and technology and
hence innovation for the mutual benefit of each” (Scerri and Lastres: 2013: 6). Now
is indeed the time to advance further cooperative work among the BRICS and also
simultaneously improve the policy learning capacities of each country’s systems.
Such a research agenda would need to include more work on improving the
collection and collation of R&D and Innovation data; as well as improving information
about the flows of knowledge, finance, material and human resources. The
enhanced policy learning that results of these exercises would naturally lead to
improving the quality of policy development, monitoring, evaluation (Gault: 2010).
Page 13 of 16
�Working together, the BRICS should contribute to further improve the measurement
of STI, expand the utilisation of indicators and generally advance evidence-informed
policy research.
Investing in research on STI indicators will therefore be important for all five
countries as the BRICS seek a more prominent role in determining the future of the
global political economy and deepen their individual efforts at transforming their
national systems. As the global political economy is increasingly transiting towards
increased knowledge intensity, building domestic productive capabilities will be
largely determined by the improved performances of the individual national systems
of innovation of the BRICS. Research on the relative performances of the BRICS
provides an opportunity for mutual learning, improved measurement capacities and
hopefully, better capabilities and competences in the transition to a more sustainable
and harmonious world order.
Page 14 of 16
�REFERENCS
Arroio, Ana and Mario Scerri [editors] (2013) The Promise of Small and Medium
Enterprises, BRICS National Systems of Innovation Volume 3, Routledge, New
Delhi.
BRICS (2009) Declaration of the First Summit of Brazil, Russia, India and China,
Yekaterinburg.
BRICS (2013) Declaration of the Fifth Summit of Brazil, Russia, India, China and
South Africa, eThekwini.
BRICS (2014) First BRICS Science, Technology and Innovation Ministerial Meeting
Declaration, Cape Town.
Cassiolato, José Eduardo and Virginia Vitorino (2011) BRICS and Development
Alternatives: Innovation Systems and Policies, Anthem Press, London.
Cassiolato, José Eduardo; Graziela Zucoloto, Dinesh Abrol and Liu Xielin [editors]
(2013) Transnational Corporations and Local Innovation, BRICS National Systems of
Innovation Volume 4, Routledge, New Delhi.
Freitas, Isabel Bodas; Eva Dantas and Michiko Iizuka (2013) Catching Up in Using
and Producing Renewable Energy Technologies in the BRICS, Paper presented to
the 11th GLOBELICS International Conference, Ankara.
Gault, Fred (2010) Innovation Strategies for a Global Economy: Development,
Implementation, Measurement and Management, Edward Elgar,
Northampton/Cheltenham and IDRC, Ottawa.
Gault, Fred [editor] (2013) Handbook of Innovation Indicators and Measurement,
Edward Elgar Publishing, Cheltenham.
Godin, Benoît (2008) The Making of Statistical Standards: The OECD and the
Frascati Manual, 1962-2002, Project on the History and Sociology of STI Statistics,
Working Paper No. 39, Quebec.
IERI (2014) Revisiting some of the Theoretical and Policy Aspects of Innovation and
Development, 10th Anniversary Working Paper, Institute for Economic Research on
Innovation, Tshwane.
Kahn, Michael and Luiz Martins de Melo [editors] (2013) Financing Innovation,
BRICS National Systems of Innovation Volume 5, Routledge, New Delhi.
Maharajh, Rasigan (2011) Innovating beyond Racial Capitalism: A Contribution
towards the Analysis of the Political Economy of Post-apartheid South Africa, Lund
University Press, Lund.
Maharajh, Rasigan (2013) Expanding Global Development Possibilities: Realising
the Potential of Brazil, Russia, India, China and South Africa, Plenary presentation
on BRICS & the Global Economy, 5th BRICS Academic Forum, BRICS & Africa:
Partnership for Development, Integration and Industrialisation, Durban University of
Technology, eThekwini.
Morgan Stanley (2013) FX Pulse: Preparing for Volatility, Morgan Stanley Research,
1st August, New York City.
Page 15 of 16
�OECD (2002) The Measurement of Scientific and Technological Activities: Proposed
Standard Practice for Surveys on Research and Experimental Development
(Frascati Manual), Organisation for Economic Co-operation and Development, Paris.
OECD (2012) Measuring R&D in Developing Countries: Annex to the Frascati
Manual, Working Party of National Experts on Science and Technology Indicators,
Committee for Scientific and Technological Policy, Directorate for Science,
Technology and Industry, Organisation for Economic Co-operation and
Development, Paris.
RSA (1996) White Paper on Science and Technology, Department of Arts, Culture,
Science and Technology, Tshwane [nee Pretoria].
RSA (2011) Enhancing the National System of Innovation to support Growth and
Development: A Strategy to increase R&D investment in South Africa, Department of
Science and Technology, 28 June, Tshwane.
RSA (2013) National Survey of Research and Experimental Development: 2010/11
Fiscal Year: Main Results, Department of Science and Technology, Tshwane.
RSA (2014) “New Centres of Excellence to Advance Interdisciplinary Research,”
Department of Science and Technology, 18 February, Tshwane.
Scerri, Mario (2009) The Evolution of the South African System of Innovation since
1916, Cambridge Scholars Publishing, Cambridge.
Scerri, Mario and Helena M. M. Lastres [editors] (2013) The Role of the State,
BRICS National Systems of Innovation Volume 1, Routledge, New Delhi.
Soares, Maria Clara Couto; Mario Scerri and Rasigan Maharajh [editors] (2013)
Inequality and Development Challenges, BRICS National Systems of Innovation
Volume 2, Routledge, New Delhi.
Page 16 of 16
�
 Rasigan Maharajh