What Magnitude Of Earthquake Was My Structure Designed For?
Naveed Anwar
Vice President for Knowledge Transfer, Asian Institute of Technology, Thailand (nanwar@ait.ac.th)
Wamiq Ahmed
Master Student, Department of Structural Engineering, Asian Institute of Technology, Thailand
(wamiqahmad17@gmail.com)
ABSTRACT – This article discusses one of the most commonly asked questions by the general public relating to
earthquake magnitude that a structure can safely resist. It explains the problems in measuring earthquakes and the
large number of variables involved in the interpretation of earthquake hazards. It then presents possible ways in
which this question can be answered and proposes site-specific analysis and a performance-based design approach
as one of the most effective methods to do so.
Understanding the problem
One of the questions that the public or clients would
often like to know the answer to is: What level of an
earthquake or what magnitude of an earthquake is
their structure designed for? This seems like a
simple and valid question from their point of view,
but unfortunately, the structural engineers may not
have a clear or simple answer to that. The main
reason for asking this question is probably because
whenever there is a strong earthquake anywhere in
the world, the pictures of destruction like those
displayed in Fig.1 are commonly seen. In such
pictures, the buildings have either fallen or severely
damaged, people have been injured or have lost their
lives, or the whole community has been destroyed.
This makes the clients or public get worried about
the behavior of standing or new structures if a
similar earthquake happens in their area, which
prompts the question: what magnitude of earthquake
the structure can resist? In this article, we are trying
to address this question.
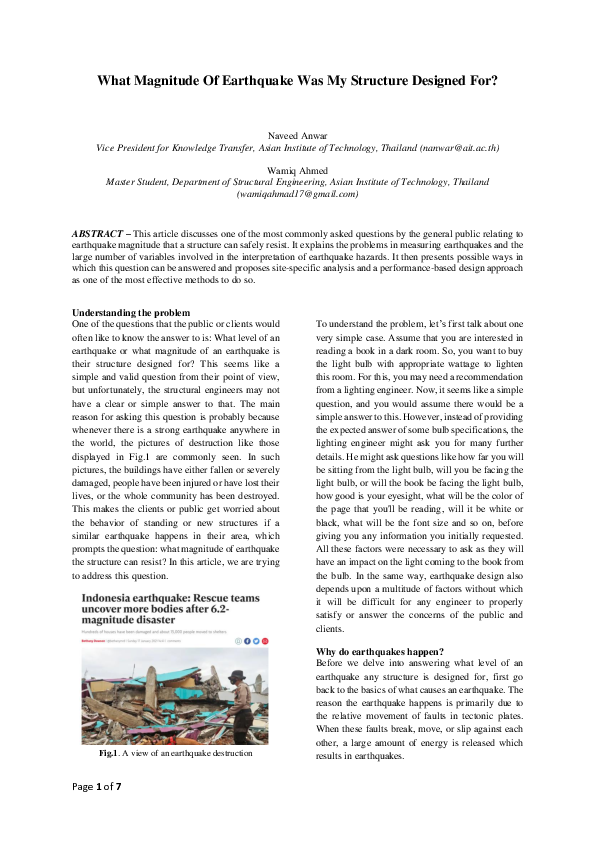
Fig.1. A view of an earthquake destruction
Page 1 of 7
To understand the problem, let’s first talk about one
very simple case. Assume that you are interested in
reading a book in a dark room. So, you want to buy
the light bulb with appropriate wattage to lighten
this room. For this, you may need a recommendation
from a lighting engineer. Now, it seems like a simple
question, and you would assume there would be a
simple answer to this. However, instead of providing
the expected answer of some bulb specifications, the
lighting engineer might ask you for many further
details. He might ask questions like how far you will
be sitting from the light bulb, will you be facing the
light bulb, or will the book be facing the light bulb,
how good is your eyesight, what will be the color of
the page that you'll be reading, will it be white or
black, what will be the font size and so on, before
giving you any information you initially requested.
All these factors were necessary to ask as they will
have an impact on the light coming to the book from
the bulb. In the same way, earthquake design also
depends upon a multitude of factors without which
it will be difficult for any engineer to properly
satisfy or answer the concerns of the public and
clients.
Why do earthquakes happen?
Before we delve into answering what level of an
earthquake any structure is designed for, first go
back to the basics of what causes an earthquake. The
reason the earthquake happens is primarily due to
the relative movement of faults in tectonic plates.
When these faults break, move, or slip against each
other, a large amount of energy is released which
results in earthquakes.
�Another important thing about the Moment
Magnitude scale is that this scale goes even beyond
the logarithmic scale, as shown in Fig.3. Every step
in the scale represents about 31 times more energy
than the previous value in that scale (USGS) which
means that the energy released goes from a very
small value initially to billions of times as we go up.
Fig.2. World tectonic plates and fault lines
As can be seen in Fig.2. there are many plates on
earth each of which has its movements that can
develop into an earthquake of varying magnitude.
Earthquake measurement and perception
Once an earthquake happens, then four things can be
related to that earthquake event. First is, how an
earthquake is measured or what is the measure of an
earthquake. The second one is how it is going to be
reported in the news and the third is how it was
experienced by the people near the earthquake
location. Every person’s experience can be different
based upon where exactly that person was at the time
of seismic activity. A person on the top floor of a
tall building, the person standing on the ground
floor, or a person in a car, every one of them will
have different perceptions of the earthquake. The
last point related to an earthquake event is how the
structures are designed for it. So, the perception of
the earthquake, how it is reported, and how it is
measured are all essential in their regard and they
also influence how the structures are designed.
The measurement of an earthquake is the
measurement of energy released at the source of the
earthquake. To measure the energy, we put a
network of seismographs on the ground which
reports the energy level detected when an
earthquake event occurs. This energy is then
quantified based on a scale that represents the level
of energy from minimum zero level to the maximum
possible energy that can be generated. The most
common scale for this purpose is called the Moment
Magnitude scale. When we see any news reporting
the magnitude of an earthquake as any number
between 0 to 10, that is based on the output of the
Moment Magnitude scale. The Richter scale was an
earlier version of the same scale, but it could not
measure large earthquakes. There are many other
types of scales as well which cover the local, body,
and surface waves, however, the Moment
Magnitude Scale is the most comprehensive
measure of the earthquake.
Page 2 of 7
Fig.3. Moment magnitude Scale
On the other hand, the number of earthquakes that
happens corresponding to any energy level reduces
as the magnitude level rises. In simple terms, a lot of
earthquakes happen with lower magnitude and very
few earthquakes happen which are of a higher
magnitude. It is assumed that beyond the magnitude
10 levels there is no earthquake computationally
possible so that is the maximum limit of the scale.
Moreover, a lot of earthquakes can be seen listed on
the figure which reflects that this is the scale usually
referred to when reporting the earthquake and both
designers and clients are concerned about where the
design earthquake lies on this scale.
Coming to the next point of how the earthquake is
reported, let’s again refer to Fig.1 which shows the
after-effects of a 6.2 magnitude earthquake that
happened in Indonesia. It can be seen that many
people died, bodies are still being discovered and it
shows the building that is completely collapsed.
That is the image that people get of a strong
earthquake and it sparks fear in them about their
houses and communities., even when their houses
might not be in any particular danger.
How people feel about the earthquake is another
issue entirely and may not exactly go hand in hand
with the magnitude of the reported earthquake. The
feeling of an earthquake is more related to the
shaking of structure or ground under the earthquake.
�During an earthquake, every person might have
differing views on the intensity of the earthquake
depending upon where that person was, whether
he/she was awake or asleep, moving or standing
still, on a tall building or on the ground. All these
conditions affect the feeling of shaking experienced
by a person and hence change their perceptions of
the earthquake. A high magnitude earthquake
happening very far from the building may not be felt
as strongly as any low magnitude earthquake
nearby. The scales like the Modified Mercalli scale
and Rossi-Forel scale are used to measure the
amount of shaking at a particular location and they
range from ‘Not felt’ at one end to ‘Extreme’ at the
other end. These scales are all related to how a
person feels and not to the earthquake magnitude
and are therefore called intensity scales.
Fig.4. An example of an intensity scale
The building’s modal time period also influences the
earthquake motion felt. Some buildings are triggered
due to short period earthquakes whereas others are
susceptible to long-period earthquakes. In Bangkok
a few years back, for example, a building swayed so
much so that the occupants had to evacuate the
building and the water pipes broke in the elevator
shaft, even though the earthquake happened very far
in Indonesia. Surprisingly, occupants of other
neighboring buildings did not even feel this
earthquake. It was mainly because that particular
building was susceptible to that particular period of
the earthquake.
Generally, when people say that the earthquake was
mild or strong, it is not based on magnitude but on
how they experienced it.
Page 3 of 7
How do earthquakes affect structures?
How earthquakes affect structure is a complex
phenomenon. As mentioned in an example earlier,
the same earthquake can have different effects on
different structures at the same location. A tall
building will respond differently than a short or midrise building, which in turn will respond entirely
differently from a single-story building. Conversely,
it is also true that the same structures perform
differently for different earthquake effects.
Structures also perform differently depending on
whether the earthquake shock was fast-moving or
slow-moving, the frequency content of the
earthquake, the type of earthquake waves, and
whether the earthquake has a vertical component or
not. Each magnitude of earthquake has a different
probability of occurrence and a different frequency
which needs to be considered as well. The design
earthquake loading is derived from several
earthquakes from different sources having different
magnitudes with different probability of occurrence.
All this information is then collected and analyzed
for the development of seismic hazard maps by the
code authorities or the building officials for each
country and locality.
How do structural engineers see earthquakes?
Structural engineers use the design of earthquake
loading and convert that into a numerical input for
the structural analysis process. For the most basic
analysis, this input could be as simple as an
equivalent static force applied at each floor level.
Another form of this input is to convert earthquake
force into response accelerations for short periods
and long periods effects to cover buildings of
different heights, stiffnesses, masses, and natural
frequencies. Similarly, this input could also be a
base acceleration imparted as time history. For more
rigorous analysis, we could go for an experimental
approach where we shake the scaled-down building
model by a simulated ground motion to see the
dynamics and even the non-linear effects of an
earthquake. We can employ any of these methods
while designing and analyzing depending on the
type of structure, available tools, and experiences
that we have.
Most codes let us use all three numerical
approaches. However, it must be noted that none of
these approaches have a direct correlation with the
magnitude of the earthquake. Nevertheless, to get a
clear picture of the current state of concepts and
�methods, some brief descriptions of these three
methods are given below.
return period and response parameters including
short-period response and long-period response.
The equivalent force concept and seismic hazard
maps
Earthquake as response spectrum or acceleration
time history
In this approach, we start with Newton's law of
motion where force is a product of mass and
acceleration. Since the earthquake is an acceleration,
we can relate the mass of the building with the
earthquake to get an equivalent force that can be
applied to a structure. There are several equations
available in different codes which combine this
simple concept with various factors like the R factor,
Cd factor et cetera to account for different influences
and design methodologies.
Response spectrum can also be developed for a
particular region and modified by a few factors for
the local conditions. It covers a longer range of the
initial periods and can be applied to tall and short
buildings equally.
Fig.5. An example of an equation in ASCE-7-16
As new research and understandings are being
included in building codes, these factors are now
becoming a more accurate representation of actual
seismic loading, albeit increasingly complex to
determine. Whatever the form of the equation is, at
the root of it is the relation F=ma attempting to
convert the acceleration to an equivalent force.
Fig.7. Earthquake as response spectrum
Similarly, we can also apply seismic shaking on the
building by a simulated time history or series of time
histories of ground accelerations. We can then let the
structure determine the forces itself using the
nonlinear dynamic equilibrium equation shown
below which incorporates damping and time history
of accelerations in it.
Fig.6. Single response hazards map (UBC-97)
Many of the factors used in the above-mentioned
equations require corresponding seismic maps.
Fig.6 shows a map developed with the older version
of these equations where the countries or the regions
are divided into zones from 0 to 4 or 5 indicating the
severity of the hazard. A newer version of maps
often incorporates more details like the earthquake
Page 4 of 7
Nonlinear dynamic equilibrium equation
�This is a more accurate representation of actual
loading and response conditions and from this
equation, we can have all forms of outputs like the
free vibration, the equilibrium static force
mentioned before, the pushover analysis, the
response spectrum analysis as well as the time
history linear and nonlinear analysis.
Fig.8. Earthquake as acceleration time history
What happened to the earthquake magnitude
question and the possible answers?
The magnitude of the earthquake got absorbed in so
many factors like hazard maps, ground acceleration,
response acceleration, importance factor, structure
type, modification factor ‘R’, damping ratios,
stiffness assumptions, load combinations, design
philosophy, and many others that it is now very hard
to correlate the earthquake magnitude we started
with to the final design outcome.
So, how can we possibly answer our original
question? One way to look at it is to say that if you
have followed the design codes and design
approaches, the possible answer can be that the
structure has been designed for the appropriate
earthquake magnitude for the location where it is
built and it has a reasonable margin of safety against
collapse. However, we cannot say exactly which
magnitude of the earthquake will collapse the
structure.
On the other hand, we can try to answer that the
structure has been designed for an acceleration of
0.6g or 0.8g, corresponding to a very strong
earthquake, with an adequate margin of safety
against collapse. It can also be referred to as the
hazard map because the acceleration is part of this
map, but again this acceleration is not directly
related to the earthquake magnitude and hence the
question remains.
Both answers try to address the question; first in a
more general way while the other is more technical.
Whether these are enough to satisfy the public,
however, cannot be ensured.
Page 5 of 7
The seismic design intent in the codes and the
performance-based design approach
The code-based design approach has a good intent
to cover three levels of earthquake loading in design,
although not explicitly. It includes service level
earthquakes (SLE), moderate level or design level
earthquakes, and the maximum considered
earthquake (MCE).
Performance-based design (PBD), on the other
hand, can make the checks at each of the earthquake
levels more explicitly. Can performance-based
design help to improve the answer to the problem?
The answer to this question can surely be in the
affirmative.
One of the pre-requisites of PBD is a site-specific
study through which we can get specific and realistic
information about the earthquake hazard at the site
of the building. Then we do the initial design of the
structure and then we model it so we can check its
performance. We do not design the reinforcement to
come to one solution but rather we check what has
been designed through a more detailed and
comprehensive
analysis
involving
explicit
evaluation of serviceability and collapse prevention
levels. So, what PBD does is that by using a sitespecific study it can correlate the hazard levels with
their performance levels making it much easier to
determine which hazard will fail the structure.
Fig.9. Linking hazards to performance levels
The site-specific hazard studies
The site-specific study considers all the relevant
earthquake sources with their potential maximum
magnitude with different return periods. It also
considers the attenuation or the effect of that
earthquake on the site depending on what is in
between and the bedrock structure together with the
amplification or the damping effects. This
knowledge can help tremendously in determining
the hazards for sites that are not generally
considered susceptible to earthquakes. For example,
�buildings in Bangkok were, for a long time, not
designed for an earthquake because people believed
that since there was no fault nearby, there was no
earthquake hazard. However, as the knowledge
developed it was realized that earthquakes
happening in very far regions like in Myanmar
region or the Northern Thailand region, can still
affect the buildings in Bangkok, mostly midrise
buildings in the range of 25 to 30 floors, due to the
soft soil of the bed.
magnitude, corresponding to a return period of say
50 years or 2475 years, without any damage thereby
satisfying the serviceability and collapse prevention
requirements respectively. In this way, the safety of
the structure is directly connected to the magnitude,
location, and occurrence interval of an earthquake
which is difficult to gather from code recommended
procedures unless we know a lot of background
information on the development of the seismic risk
maps.
Moreover, through this study, we can see the relative
contribution to the total risk at any site from
different sources which are located at different
locations with different magnitude. This results in a
clear understanding of what magnitude of
earthquake originating at what distance can cause a
critical impact on our structure.
Conclusion
Providing an answer to the question of ‘which
magnitude of earthquake the structure can safely
resist’ based solely on design codes can be difficult
and inconclusive because code-based seismic maps
do not clearly reflect the earthquake’s magnitudes
and locations. It is therefore hard to link safety with
a particular seismic hazard.
By using a site-specific study and performancebased design approach we can overcome this
problem by identifying the controlling earthquake
for any performance level. This is usually done by
looking at the time history response of structure
from every earthquake, through which it is easy to
identify which maximum response controls the
design.
Fig.10. An example of de-aggregation of the hazard by
Magnitude and Distance
From all this data, we have now more or less
identified the magnitude of the earthquake for which
the structure is primarily designed, including the
effects of all other earthquakes that might occur.
An alternate answer to the question
All the detailed information that we have looked at
so far can now help us in coming up with an alternate
answer which might be more in line with what the
public expected to get. We are now able to provide
information about any considered structure in terms
of its capability of resisting an earthquake of specific
magnitude happening at a location some specific
distance away with a specific probability of
occurrence.
In other words, we can say with confidence that this
structure can resist an earthquake of any particular
Page 6 of 7
Acknowledgment
The authors would like to thank Dr. Salman Ali
Suhail, Engr. Ashish Sapkota, the structural
engineering team of AIT solutions, and the
academic programs of the Asian Institute of
Technology for their contributions to publishing this
article.
References
Anwar, N. (2021, July 5). What Magnitude of
Earthquake was my Structure designed for?
.
[Video] YouTube.https://www.youtube.com/watch
?v=Qmmq8-MbBNA&t=610s
Anwar.N & Najam.F (2016). Structural CrossSections: Analysis and Design, 1st Edition.
Anwar, N. CE 72.52: Advanced Concrete
Structures, Asian Institute of Technology, Thailand.
Class Lectures.
Anwar, N. CE 72.33: Structural Design of tall
buildings, Asian Institute of Technology, Thailand.
Class Lectures.
�FEMA 451 B. NEHRP Recommended Provisions
for New Buildings and Other Structures: Training
and Instructional Materials,2007.
ASCE/SEI 7-16, Minimum Design Loads and
Associated Criteria for Buildings and Other
Structures, 2016.
U.S. Geological Survey (USGS)
Page 7 of 7
�
 Naveed Anwar