DAVIS: Density-Adaptive Synthetic-Vision Based Steering for Virtual Crowds
Rowan Hughes1∗
Jan Ondřej2†
John Dingliana1
1
2
Trinity College Dublin
Disney Research, Los Angeles
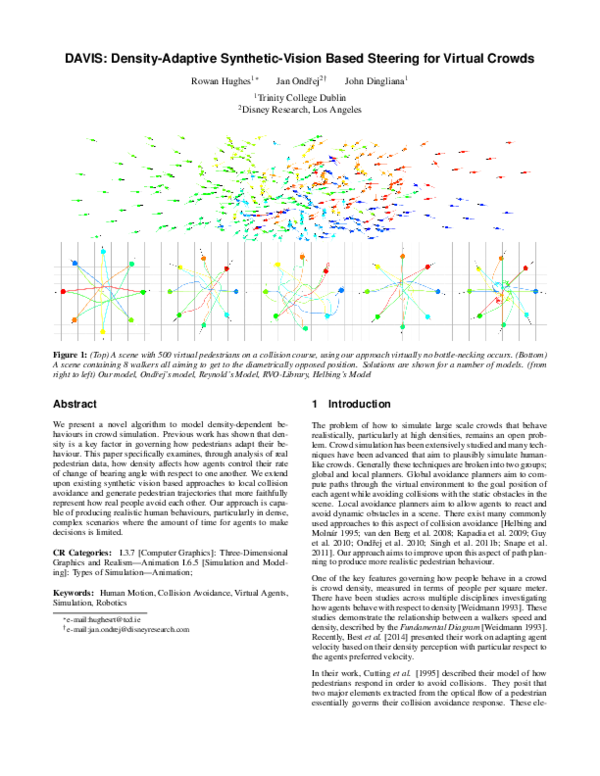
Figure 1: (Top) A scene with 500 virtual pedestrians on a collision course, using our approach virtually no bottle-necking occurs. (Bottom)
A scene containing 8 walkers all aiming to get to the diametrically opposed position. Solutions are shown for a number of models. (from
right to left) Our model, Ondřej’s model, Reynold’s Model, RVO-Library, Helbing’s Model
Abstract
1
We present a novel algorithm to model density-dependent behaviours in crowd simulation. Previous work has shown that density is a key factor in governing how pedestrians adapt their behaviour. This paper specifically examines, through analysis of real
pedestrian data, how density affects how agents control their rate
of change of bearing angle with respect to one another. We extend
upon existing synthetic vision based approaches to local collision
avoidance and generate pedestrian trajectories that more faithfully
represent how real people avoid each other. Our approach is capable of producing realistic human behaviours, particularly in dense,
complex scenarios where the amount of time for agents to make
decisions is limited.
The problem of how to simulate large scale crowds that behave
realistically, particularly at high densities, remains an open problem. Crowd simulation has been extensively studied and many techniques have been advanced that aim to plausibly simulate humanlike crowds. Generally these techniques are broken into two groups;
global and local planners. Global avoidance planners aim to compute paths through the virtual environment to the goal position of
each agent while avoiding collisions with the static obstacles in the
scene. Local avoidance planners aim to allow agents to react and
avoid dynamic obstacles in a scene. There exist many commonly
used approaches to this aspect of collision avoidance [Helbing and
Molnár 1995; van den Berg et al. 2008; Kapadia et al. 2009; Guy
et al. 2010; Ondřej et al. 2010; Singh et al. 2011b; Snape et al.
2011]. Our approach aims to improve upon this aspect of path planning to produce more realistic pedestrian behaviour.
CR Categories: I.3.7 [Computer Graphics]: Three-Dimensional
Graphics and Realism—Animation I.6.5 [Simulation and Modeling]: Types of Simulation—Animation;
Keywords: Human Motion, Collision Avoidance, Virtual Agents,
Simulation, Robotics
∗ e-mail:hughesrt@tcd.ie
† e-mail:jan.ondrej@disneyresearch.com
Introduction
One of the key features governing how people behave in a crowd
is crowd density, measured in terms of people per square meter.
There have been studies across multiple disciplines investigating
how agents behave with respect to density [Weidmann 1993]. These
studies demonstrate the relationship between a walkers speed and
density, described by the Fundamental Diagram [Weidmann 1993].
Recently, Best et al. [2014] presented their work on adapting agent
velocity based on their density perception with particular respect to
the agents preferred velocity.
In their work, Cutting et al. [1995] described their model of how
pedestrians respond in order to avoid collisions. They posit that
two major elements extracted from the optical flow of a pedestrian
essentially governs their collision avoidance response. These ele-
�ments, the perceived rate of change of bearing angle (α̇) and timeto-collision (ttc) of an obstacle are derived from the change in position and growth in size of obstacles in successively perceived images. These insights were used by Ondřej et. al [2010] in developing a synthetic vision based approach to local collision avoidance.
In this paper, we investigate the degree to which density plays a role
in decisions made due to these perceptions and adapt the syntheticvision model to conform to our findings.
1.1
Main Results
• Through analysis of real pedestrian data we show that density
plays a significant role in how agents avoid one another and
affects both the tangential and angular components of velocity.
• We adapt the vision model described in [Ondřej et al. 2010]
to incorporate density as a key factor in computation. We also
introduce a new governing function that allows for more intuitive control over agent behaviour and that fits the observed
data in a more faithful manner.
Figure 2: Plot graphing the mean density with respect to α̇ for our
dataset. (+/− one standard deviation visualised by the lighter red
area. The function displayed in blue represents our density function
with parameters: (αρ = 0.4, βρ = 0.2, γρ = 0.85).
• The computational overhead of our technique is low and
hardly impacts the cost of computation with respect to the
original vision model.
3
• Our model results in smoother, more realistic trajectories and
also reduces the number of collisions between agents.
The rest of the paper is organised as follows: We give a brief
overview of the state of the art in Section 2. In Section 3, we
present the details of the method. Section 4 outlines some of the results of our algorithm. Finally, in Section 5 we analyse the model’s
strengths and weaknesses.
2
Related Work
Crowd behaviour and, in particular, collision avoidance has been
extensively studied across a wide variety of fields including control
theory, robotics, crowd simulation, etc. In this section we give a
brief overview of relevant prior work.
Local collision avoidance models for real-time multi-agent simulation fall, mainly, into a few categories including force based [Helbing et al. 2000; Pelechano et al. 2007; Karamouzas et al. 2014],
rules-based [Reynolds 1999], velocity-based [Fiorini and Shillert
1998; van den Berg et al. 2008; Guy et al. 2009; Pettré et al. 2009;
Berg et al. 2011], footstep driven [Singh et al. 2011b], data-driven
[Lee et al. 2007; Lerner et al. 2007; Charalambous and Chrysanthou
2014] and synthetic-vision based [Ondřej et al. 2010].
Density, and its effect on crowd behaviour, is a long noted phenomenon [Wolff 1973]. There has been prior work in crowd simulation that generates Fundamental Diagram [Lemercier et al. 2012;
He and van den Berg 2013; Bruneau et al. 2014] adherent crowd behaviour. Recently Best et. al [2014], presented their work, taking
into consideration both psychological and physiological factors in
determining their density calculation. Other approaches to pedestrian adaptation to density operate at the global-planning level [Guy
et al. 2010; van Toll et al. 2012], as well as hybrid approaches such
as those described by [Treuille et al. 2006; Singh et al. 2011a; Golas
et al. 2013].
Our approach builds directly on the synthetic-vision based model
described in [Ondřej et al. 2010]. Further advances have been made
to this model including incorporating group dynamics [Wu et al.
2013] and incorporating adopting a cost based approach upon computing visual features [Dutra et al. 2014].
3.1
Method
Data Analysis
To build our model we analysed data from a set of motion-captured
pedestrian trials. Each trial consisted of a number of agents set up
on a rough circle and tasked to reach the diametrically opposing
side. The trials consisted of between 6 and 24 pedestrians with a
total of 40 trials.
Each trial dataset consisted of a set of 3D positions for the left and
right shoulder markers attached to each agent, Ai , for each captured frame, f , in the trial. For each trial we construct an N ∗ F
matrix, where N is the number of agents in the trial and F the
number of captured frames. Each cell of the matrix cif , i and f
representing the current agent and frame respectively, consists of a
position, speed, direction and density (pif ,sif , dif , ρif ), as well as
parameters computed between the observed agent, Ai , and every
other agent, Aj , in the trial: time-to-collision, bearing angle and
rate-of-change of bearing angle (ttcijf , αijf ,α̇ijf ). Density is calculated according to the method described in [Best et al. 2014], but
using observed velocity rather than “desired velocity” as this is ambiguous when dealing with real data. In order to calculate a more
accurate estimate of ttc we construct a kite proxy shape using the
left and right shoulder positions, with a width of 0.6m and a depth
of 0.3m. We then calculate ttc with respect to the closest point on
the closest segment of each kite.
A pedestrian cannot simultaneously respond to all agents in dense
environments, but at most a small subset. Here we make the assumption that the pedestrian responds most strongly with respect
to the most imminent collision. We derive the critical time-tocollision, ttccif , where ttccif = min(ttcijf ), for all ttcijf > 0.
c
c
Using ttccif we select αif
and α̇if
to reduce our state vector for a
given agent at a given frame to:
c
c
ccif = [pif sif , dif , ρif , ttccif , αif
, α̇if
].
(1)
Figure 2 shows the graph of all samples of α̇c plotted against ρ for
0.1 < ttcc < 1.0. We only look at a segment of ttcc as ttc varies
non-linearly with α̇. We discuss the implications in Section 3.3.
�Figure 3: α̇i is calculated on a per vertex basis, ttci on a per
fragment basis. They are calculated from the relative position and
velocity of the point with respect to the agent perceiving the scene.
3.2
Model Overview
As previously mentioned, Cutting et al. [1995] posit that a person’s
avoidance behaviour is governed by two major aspects derived from
their optical flow. In their work, Ondřej et al. [2010] leveraged
these insights in developing a synthetic-vision based approach to
microscopic collision avoidance. We adapt Ondřej’s model to take
into account density considerations when adapting agent behaviour.
By using density as a key input in calculating angular velocity θ̇i we
aim to create more realistic, adaptive agent behaviour.
Each agent’s configuration is described by the state vector:
[pai , hi , pi , ρi , vicurr , vides ]T , where pai and hi represent the scalar
physical dimensions of the agent, ρi is the agent’s density, pi , vicurr
and vides are two dimensional vectors representing the agent’s current location, velocity and desired velocity respectively. The agent’s
behaviour is controlled via the (θ̇i , vi ) pair, where θ̇i and vi represent angular and tangential velocity respectively.
At each simulation step the agent’s density, ρi , is calculated according to the method described by Best et al. [2014]. This value
is stored and then passed to the next simulation step on the GPU.
The scene is then rendered from a camera oriented to each agents
perspective. Obstacles are decomposed into a set of pixels P , in
exactly the manner described in [Ondřej et al. 2010]. Rather than
rendering the colour channels to RGB space, we calculate for each
pixel pi ∈ P a set of pairs pi → (α̇, ttci ) that are required to adapt
agents avoidance behaviour. A parallel reduction is run on each
frame to reduce its size to one pixel, representing the most “dangerous” pixel. This pixel is then used to compute (θ̇i , vi ). The details
are described in the following section.
3.3
Model Description
Model inputs
The model’s inputs are computed from agent’s state vector and
some of them are illustrated in Figure 3. We compute ttci and α̇i
as follows:
ttci = d/ kv~c k ,
α̇i = α2 − α1 .
(2)
(3)
Figure 2 shows the mean density ρ plotted against the change of
bearing angle α̇c . We can see a clear power relationship emerge
between the two variables, (Note we are only observing a small
slice of ttc from 0.2 to 0.4 seconds). As density decreases along
Figure 4: 2D Histogram showing α̇ plotted against ttc. This plot
shows that the majority of critical, (low ttc), α̇ clusters around the
0.5(rad.s−1 ) mark. It also displays the propensity of agents to
pass on the right hand side. Using a Gaussian-like function allows
us to smoothly control the critical aspects of behaviour, but in particular it allows us to explicitly define the crossing point (peak of
curve) which is derived from density information. The red and magenta curves corresponds to the parameter sets: (δi = 0.5, αttc =
0.2, σttc = 0.85, βttc = 0.05) and (δi = 1.5, αttc = 0.2, σttc =
0.85, βttc = 0.1) respectively.
the agents velocity, less adaptation is needed to achieve a collision
free velocity. We model this interaction using a densityf actor
function δi defined as:
δ i = α ρ ρ i βρ + γ ρ ,
(4)
with αρ , βρ and γρ representing constant parameters of the model.
We found by testing that using parameters that more closely approximate values along +1 standard deviation from the mean produced
the best results.
Angular Velocity Control
Once δi is derived we need a mechanism to use it in determining θ̇.
Given a perceived α̇ value we describe a Gaussian-like function to
determine the threshold τ under which a walker reacts:
�
�
(ttci − αttc )2
+ βttc
τ (ttci ) = δi exp −
2
2σttc
(5)
where αttc , βttc and σttc are constant parameters of the model
and δi is our densityf actor derived from (4). Figure 4 shows
the 2D histogram for the pair (α̇c , ttcc ) for our entire dataset. As
we can see the function described in (5) models the observed data
smoothly, with the red and magenta curves representing low and
high values for δi respectively.
The set of points that will be considered , Pcol ⊂ P , is reduced as
follows:
pi ∈ Pcol if 0 < ttc < 6 and α̇i < τ (ttci )
(6)
�Having the threshold function τ and α̇i we can compute the angular
velocity needed to avoid the collision. We define a turn to the left
ΦL and right ΦR as follows:
ΦRi = min(α̇i − τ (ttci ))
ΦLi = max(α̇i + τ (ttci ))
(7)
original Vision Model [Ondřej et al. 2010], in Figure 6(c), which
tends to lead to concentric swarming behaviour. This approach does
avoid bottlenecks at the centre and remains collision free but the
patterns become too uniform to remain plausible. For velocity obstacle based approaches such as ORCA, Figure 6(d), this type of
scenario raises major difficulties. With agents tending to converge
on the centre of the circle and getting stuck there.
From these two values we choose the one with a smaller amount of
adaptation and use it as the angular velocity:
�
ΦLi , if |ΦLi | < |ΦRi |,
θ̇i =
(8)
ΦRi , otherwise.
In the end, the angular velocity θ̇i is adapted by the goal position as
described in [Ondřej et al. 2010].
Tangential Velocity Control
We introduce a change to the function governing speed adaptation
to low ttc (9). In [Ondřej et al. 2010] the speed had been reduced
to near zero for low ttc values. This would not seem to be a valid
assumption, especially in dense scenarios, as if a pedestrian chooses
a collision free trajectory passing closely by an obstacle a low ttc
will not necessarily correspond to a large reduction in speed. Indeed
investigating the data shows a marginal effect, with speed at ttc = 0
averaging at 1.0m/s. With this in mind we compute clip speed
accordingly:
2
vi = (vcomf − 1.0) · (1 − exp−0.3tti ) + 1.0
(b) Our model
(c) Ondřej’s Model
(d) ORCA
(9)
In addition to this we further filter the speed v using the density
filter described in [Best et al. 2014] to generate a Fundamental Diagram adherent velocity.
4
(a) Initial walker configuration
Results
In this section we present the performance of our model in various
scenarios. We also analyse the model, comparing and contrasting
with other collision avoidance techniques.
Data Scenarios: The dataset we analysed in building our model
consisted of sets of agents set up on a circle with the goal of reaching the diametrically opposite position. In Figure 5, we see real
plotted trajectories for one of the trials in the dataset. This is the
behaviour we are interested in reproducing.
Figure 6: Circle (a) A scene of 100 walkers are initially deployed
uniformly along a circle. The walker’s goal is to reach the diametrically opposed position. The solution is shown for 3 models (b), (c),
(d). Our model (b) is the only one able to provoke the emergence of
patterns.
Geometrically Challenging Scenarios: These simple scenarios
can prove particularly difficult for velocity-obstacle based approaches due to a number of factors. In [Karamouzas et al. 2014]
the authors address these challenges and show how their force based
approach can solve these problems in a plausible manner. Here we
show that our algorithm is similarly capable. As shown in Figure 7
we set up two basic scenarios, both of which comprise of an agent
facing a block of oncoming agents (2 in the first case, 10 in the
second). Figure 7(a) shows how our algorithm resolves these scenarios in a plausible manner. Figure 7(b) shows a number of other
collision avoidance models attempting to resolve the same scenarios with less plausible results.
Large Scenarios: Figure 8 displays a scene in which two banks of
100 agents cross each other. Our model is scalable and can handle
hundreds of agents at real-time rates. This scenario, among others,
can be seen in the accompanying media.
Figure 5: Graphically illustrated example of one of the trials in our
dataset.
Figure 6 shows the emergence of natural behaviour using our approach, with agents spreading out in a plausible manner to avoid
collision. We can compare this level of plausibility with that of the
5
Discussion
Realism The vast majority of local collision avoidance algorithms
are capable of producing plausible pedestrian avoidance behaviour
when considering only a small number of agents. The real challenge occurs when environments become significantly complex.
The ORCA algorithm [Guy et al. 2009], while exceptionally ele-
�the α̇ response reaches a maximum. We see in the data that
this clusters around 0.2. This may be due to pedestrians maintaining a “safety buffer” or simply a standard error in judgement on their part.
• βttc : This parameter represents the minimum value for adaptation made by an agent on sensing a collision. This governs
how generally “cautious” agents behave in simulation. (Minor changes to this variable can lead to major changes in agent
behaviour.)
• σttc : This parameter controls the degree to which adaptation
is non-linear with ttc. Decreasing σttc will reduce the point
at which agents will start to significantly react to ttc.
(a)
• δi : This parameter is derived as outlined in Section 3.3. It
governs the overall magnitude of adaptation behaviour, when
density is low the adaptation is small and vice-versa.
(b)
Figure 7: (a) The top two frames represent two simple scenarios
that are typically difficult for some collision avoidance algorithms
to solve in a plausible manner. The bottom frames show how our
algorithm solves them elegantly. (b) Here we run these same scenarios with a number of well known collision avoidance algorithms.
Figure 8: A scene with two banks of walkers on opposing trajectories.
gant, efficient and malleable [Kim et al. 2013], suffers from throwing out too much of the available solution space and guaranteeing collision free trajectories at all costs. This can lead to unusual
behaviour in certain scenarios. RVO [van den Berg et al. 2008]
will theoretically find a better collision free solution but suffers in
terms of computational cost due to the amount of samples need to
achieve this. In the field of robotics, where guaranteeing collision
free path is of critical importance a vision-based approach may not
be valid. Pedestrians do, however, collide from time to time particularly in very dense scenarios. Recently, we have seen force-based
approaches make a re-appearance [Karamouzas et al. 2014], in their
work we can see how this method overcomes some of the drawbacks seen in aforementioned algorithms. Synthetic-vision based
models also avoid some of these drawbacks and sit closer to this
approach; and while not guaranteeing collision free paths they do
produce realistic pedestrian behaviour.
By incorporating density as a factor in determining avoidance behaviour we avoid some of the rapid and unnecessary changes in
angular velocity seen when omitted. This was particularly problematic at low ttc. Agents make the adjustments necessary to avoid
each other in a smooth and realistic manner.
Model Parameters In Section 3.3 we describe a novel governing
function controlling our algorithm. By using a Gaussian like function we not only model the underlying data in a more faithful manner but we also gain more intuitive control over agent behaviour.
• αttc : This parameter governs the offset from ttc = 0 where
6
Conclusion
In this paper, we analysed real pedestrian data to investigate the
role that density plays in altering pedestrian behaviour. We developed a synthetic-vision based model based on these findings that
incorporates crowd density as a key element in determining agent
behaviour. Our approach builds upon the approach described in
[Ondřej et al. 2010], and generates smoother, more realistic pedestrian trajectories.
In future work it would be interesting to investigate other types of
data sets and see if our analysis holds true. We also didn’t fully investigate the impact that ttc plays on tangential velocity. Partly this
was due to the fact that we were looking at dense datasets, and density and tangential velocity are tightly coupled [Best et al. 2014].
In addition we are currently examining the statistical similarity between real and simulated datasets for model validation.
Acknowledgements
This research was supported by funding from the EU FP7 VERVE
project (grant no. 288914) and Science Foundation Ireland project
14/TIDA/2349.
References
B ERG , J., G UY, S., L IN , M., AND M ANOCHA , D. 2011. Reciprocal n-body collision avoidance. In Robotics Research,
C. Pradalier, R. Siegwart, and G. Hirzinger, Eds., vol. 70 of
Springer Tracts in Advanced Robotics. Springer Berlin Heidelberg, 3–19.
B EST, A., NARANG , S., C URTIS , S., AND M ANOCHA , D.
2014. Densesense: Interactive crowd simulation using densitydependent filters. In Symposium on Computer Animation, 97–
102.
B RUNEAU , J., D UTRA , T. B., AND P ETTR É , J. 2014. Following
behaviors: A model for computing following distances based on
prediction. In Proceedings of the Seventh International Conference on Motion in Games, ACM, New York, NY, USA, MIG ’14,
17–24.
C HARALAMBOUS , P., AND C HRYSANTHOU , Y. 2014. The pag
crowd: A graph based approach for efficient data-driven crowd
simulation. Comput. Graph. Forum 33, 8 (Dec.), 95–108.
�C UTTING , J. E., V ISHTON , P. M., AND B RAREN , P. A. 1995.
How we avoid collisions with stationary and with moving obstacles. Psychological Review 102, 627–651.
D UTRA , T. B., P RIEM , G., C AVALCANTE -N ETO , J. B., V IDAL ,
C. A., AND P ETTR É , J. 2014. Synthetic Vision-based Crowd
Simulation: Reactive vs. Reactive Planning Approaches. In Proceedings of the 27th Conference on Computer Animation and
Social Agents (CASA 2014).
F IORINI , P., AND S HILLERT, Z. 1998. Motion planning in
dynamic environments using velocity obstacles. International
Journal of Robotics Research 17, 760–772.
G OLAS , A., NARAIN , R., AND L IN , M. 2013. Hybrid long-range
collision avoidance for crowd simulation. In Proceedings of the
ACM SIGGRAPH Symposium on Interactive 3D Graphics and
Games, ACM, New York, NY, USA, I3D ’13, 29–36.
G UY, S. J., C HHUGANI , J., K IM , C., S ATISH , N., L IN , M.,
M ANOCHA , D., AND D UBEY, P. 2009. Clearpath: highly parallel collision avoidance for multi-agent simulation. In Proceedings of the 2009 ACM SIGGRAPH/Eurographics Symposium on
Computer Animation, ACM, New York, NY, USA, SCA ’09,
177–187.
G UY, S. J., C HHUGANI , J., C URTIS , S., D UBEY, P., L IN , M.,
AND M ANOCHA , D. 2010. Pledestrians: a least-effort approach to crowd simulation. In Proceedings of the 2010 ACM
SIGGRAPH/Eurographics Symposium on Computer Animation,
Eurographics Association, Aire-la-Ville, Switzerland, Switzerland, SCA ’10, 119–128.
H E , L., AND VAN DEN B ERG , J. 2013. Meso-scale planning for
multi-agent navigation. In 2013 IEEE International Conference
on Robotics and Automation, Karlsruhe, Germany, May 6-10,
2013, 2839–2844.
H ELBING , D., AND M OLN ÁR , P. 1995. Social force model for
pedestrian dynamics. Phys. Rev. E 51 (May), 4282–4286.
H ELBING , D., FARKAS , I., AND V ICSEK , T. 2000. Simulating
dynamical features of escape panic. Nature, 2000.
L ERNER , A., C HRYSANTHOU , Y., AND L ISCHINSKI , D. 2007.
Crowds by example. Comput. Graph. Forum 26, 3, 655–664.
O ND ŘEJ , J., P ETTR É , J., O LIVIER , A.-H., AND D ONIKIAN , S.
2010. A synthetic-vision based steering approach for crowd simulation. In ACM SIGGRAPH 2010 papers, ACM, New York, NY,
USA, SIGGRAPH ’10, 123:1–123:9.
P ELECHANO , N., A LLBECK , J. M., AND BADLER , N. I. 2007.
Controlling individual agents in high-density crowd simulation. In Proceedings of the 2007 ACM SIGGRAPH/Eurographics
symposium on Computer animation, Eurographics Association,
Aire-la-Ville, Switzerland, Switzerland, SCA ’07, 99–108.
P ETTR É , J., O ND ŘEJ , J., O LIVIER , A.-H., C RETUAL , A., AND
D ONIKIAN , S. 2009. Experiment-based modeling, simulation
and validation of interactions between virtual walkers. In Proceedings of the 2009 ACM SIGGRAPH/Eurographics Symposium on Computer Animation, ACM, New York, NY, USA, SCA
’09, 189–198.
R EYNOLDS , C., 1999. Steering behaviors for autonomous characters.
S INGH , S., K APADIA , M., H EWLETT, B., R EINMAN , G., AND
FALOUTSOS , P. 2011. A modular framework for adaptive agentbased steering. In Symposium on Interactive 3D Graphics and
Games, ACM, New York, NY, USA, I3D ’11, 141–150.
S INGH , S., K APADIA , M., R EINMAN , G., AND FALOUTSOS , P.
2011. Footstep navigation for dynamic crowds. In Symposium
on Interactive 3D Graphics and Games, ACM, New York, NY,
USA, I3D ’11, 203–203.
S NAPE , J., VAN DEN B ERG , J., G UY, S., AND M ANOCHA , D.
2011. The hybrid reciprocal velocity obstacle. Robotics, IEEE
Transactions on 27, 4, 696–706.
T REUILLE , A., C OOPER , S., AND P OPOVI Ć , Z. 2006. Continuum
crowds. In ACM SIGGRAPH 2006 Papers, ACM, New York,
NY, USA, SIGGRAPH ’06, 1160–1168.
B ERG , J., L IN , M. C., AND M ANOCHA , D. 2008. Reciprocal velocity obstacles for real-time multi-agent navigation.
In IEEE INTERNATIONAL CONFERENCE ON ROBOTICS
AND AUTOMATION, IEEE, 1928–1935.
VAN DEN
K APADIA , M., S INGH , S., H EWLETT, W., AND FALOUTSOS , P.
2009. Egocentric affordance fields in pedestrian steering. In
Proceedings of the 2009 Symposium on Interactive 3D Graphics
and Games, ACM, New York, NY, USA, I3D ’09, 215–223.
VAN
K ARAMOUZAS , I., S KINNER , B., AND G UY, S. J. 2014. Universal power law governing pedestrian interactions. Phys. Rev. Lett.
113 (Dec), 238701.
W EIDMANN , U. 1993. Transporttechnik der Fussgänger: transporttechnische Eigenschaften des Fussgängerverkehrs ; Literaturauswertung. Schriftenreihe des IVT. IVT.
K IM , S., G UY, S. J., AND M ANOCHA , D. 2013. Velocity-based
modeling of physical interactions in multi-agent simulations. In
Proceedings of the 12th ACM SIGGRAPH/Eurographics Symposium on Computer Animation, ACM, New York, NY, USA, SCA
’13, 125–133.
W OLFF , M. 1973. Notes on the behavior of pedestrians. People In
Places: The Sociology Of The Familiar., 35–48.
L EE , K. H., C HOI , M. G., H ONG , Q., AND L EE , J. 2007. Group
behavior from video: a data-driven approach to crowd simulation. In Proceedings of the 2007 ACM SIGGRAPH/Eurographics
symposium on Computer animation, Eurographics Association,
Aire-la-Ville, Switzerland, Switzerland, SCA ’07, 109–118.
L EMERCIER , S., J ELIC , A., K ULPA , R., H UA , J., F EHRENBACH ,
J., D EGOND , P., A PPERT-ROLLAND , C., D ONIKIAN , S., AND
P ETTR &# X 00 E 9;, J. 2012. Realistic following behaviors for
crowd simulation. Comp. Graph. Forum 31, 2pt2 (May), 489–
498.
T OLL , W. G., C OOK , IV, A. F., AND G ERAERTS , R. 2012.
Real-time density-based crowd simulation. Comput. Animat. Virtual Worlds 23, 1 (Feb.), 59–69.
W U , Q., J I , Q., D U , J., AND L I , X. 2013. Simulating the local
behavior of small pedestrian groups using synthetic-vision based
steering approach. In Proceedings of the 12th ACM SIGGRAPH
International Conference on Virtual-Reality Continuum and Its
Applications in Industry, ACM, New York, NY, USA, VRCAI
’13, 41–50.
�
 John Dingliana