Volume 3, Number 2, 2016, 103–124
DOI: 10.18335/region.v3i2.130
journal homepage: region.ersa.org
Pride in the city∗
Philip S. Morrison1
1
Victoria University of Wellington, Wellington, New Zealand (email: philip.morrison@vuw.ac.nz)
Received: 16 March 2016/Accepted: 17 October 2016
Abstract. Urban pride is an individual and collective response to living in a given
city. Unlike other emotions such as life satisfaction or happiness with which it is weakly
positively correlated, pride involves stake holding; to be proud of something requires
having an investment in its success emotionally, financially or culturally.
For this study I specify a multilevel model based on responses to a five category survey
question which asks residents how proud they are in the ‘look and feel of their city’.
Responses to the 2008 survey are distributed over almost 6000 residents across 12 cities
in New Zealand. Although the primary variation is among individuals, urban pride also
varies by city and I show how differences in urban context affect the way different types
of stake holding temper urban pride.
JEL classification: R19, R590, I390, H890
Key words: Pride, urban pride, civic pride, city, social identity, multilevel model, New
Zealand, Quality of Life Survey
Pride is an emotion that has profound economic consequences and indeed
consequences for all areas of human activity (Boulding 1987, pp. 15–16)
1
Introduction
Almost thirty years ago Kenneth E. Boulding proposed a link between power, planning,
and pride in a paper entitled, ‘The economics of pride and shame’ (Boulding 1987).
∗ Successive drafts of this paper have been presented over the last four years and I wish to acknowledge
the feedback received. An initial presentation was made on 23 August 2012 to the Geography, Environmental and Development Studies Seminar series at Victoria University of Wellington, a year later on
10th October, 2013 to the National Institute of Demographic and Economic Analysis (NIDEA) at the
University of Waikato. A later version was presented to the Department of Geography, University of
Otago on 2nd October, 2014. The case study was also used as an application of multilevel modelling in a
keynote address to the Oceania Stata User Group Meeting in Sydney, on 28 September, 2016 under the
title ‘Multilevel estimation of contextual effects’.
Several people have commented on earlier drafts. Professor Jacques Poot, University of Waikato,
made constructive comments on an earlier manuscript. Dr Michael Thomas, Faculty of Spatial Sciences,
University of Groningen, made a number of valuable suggestions on the model, some of which I have
adopted and others of which I will address in subsequent work. Dr Tom Collins, School of Geography,
University of Leeds whose work on civic pride I drew on in the literature review was kind enough to read
the penultimate manuscript and he made several points which I’ve now included in the paper. I also wish
to acknowledge the literature review on this topic initially undertaken by Robert Nairn as part of his
honours research essay in 2010. Finally, I wish to thank the three anonymous referees whose comments
have strengthened the paper. As usual the responsibility for any errors remain mine.
103
�104
P.S. Morrison
Economists, he observed, simply assume that preferences are given but in practice our
preferences are strongly determined by our identity which depends very much on the
community we live in.
This same relationship was recognised by New Zealand’s Wellington Regional Council
when it wrote,
Despite the limitations in being able to monitor our progress regionally, it is
known that residents with a strong sense of pride and a sense of community are
key to building strong, socially sustainable and connected communities. These
people will act as advocates for their region and promote the positive aspects
their region has to offer and contribute to improving their neighbourhood
(Wellington Regional Council 2011, p. 35)
Notwithstanding the frequent appearance of the term pride in the urban and regional
planning discourse very little attention has been paid to the role of urban pride; how it
forms in individuals, how it is distributed among residents within and between cities, and
above all how it is used in decision making. This lacunae exists in spite of the increasing
attention being paid to the way emotion motivates behaviour in general (Davidson et al.
2007), collectively (Sullivan 2014b, von Scheve, Ismer 2013), and within individuals (Lea,
Webley 1997)1 .
At the same time it is important to differentiate pride from a number of other emotions
that are receiving attention, such as life satisfaction and happiness. Pride is unique among
the emotions in the way it is tied to stake holding for one only feels pride (or shame) in
people, events, or places in which one has a stake, through investment, ownership, or
membership.
In this paper I ask three questions. To what extent does urban pride reflects the stake
people have in their city? What is the relative role of the city and the individual in the
measure of pride? And what characteristics of the city influence the way urban pride
responds to stake holding? Each of these questions is addressed by analysing responses to
a unique question on urban pride asked in the 2008 New Zealand Quality of Life Survey.
The paper makes four contributions to the urban and regional literature. Firstly,
it introduces urban pride as a distinct emotion expressed by most respondents in their
city. Secondly, the paper identifies and tests for the several types of urban stake holding.
Thirdly, it shows how levels of urban pride vary across residents and cities. And fourthly,
it explores the way characteristics of the city can modify the impact of stake holding on
urban pride.
1.1
Outline
The paper is in eight sections. Section 2 gathers the scattered literature on pride in
support of its defining characteristics and draws a working distinction between civic pride
and urban pride. Section 3 introduces the New Zealand Quality of Life Survey. The idea
of interacting characteristics of the city with attributes of the individual is integral to the
multilevel model introduced in Section 4. The random intercepts model is estimated in
Section 5, selected measures of city context are introduced in Section 6, and the multilevel
model itself is estimated in Section 7. The paper concludes in Section 8.
2
Pride
Pride is not simply another measure of wellbeing - it is an emotion that results from
having a stake in someone, something, or some place. For example: ‘I am proud of my
performance’, ‘I am proud we won gold at the Olympics’, or, ‘I am proud of my city’2 .
The opposite of pride is shame, which also depends on stake holding, as in ‘I am ashamed
of my performance, my country or my city’.
1 Despite the attention emotions receive in the Davidson et al. (2007) collection, pride as such is not
given any attention and this appears to also be the case in papers published so far in the journal Emotion,
Space and Society, with the possible exception of Bennett (2013).
2 As Rosenblatt (1988) points out, one may admire (and envy) a stranger’s achievements, but one is
not ‘proud of’ a stranger.
REGION : Volume 3, Number 2, 2016
�P.S. Morrison
105
The essential point about pride is that it is based on a prior belief that one has played
a role or made a difference in generating the phenomena, event, or condition of interest,
even if only in a secondary or peripheral way. Most followers of sports teams feel they
contribute simply by being a fan and they are proud of that contribution. Most citizens
of countries feel some degree of pride in their country simply because they are born with
the right to permanent residence.
Research on pride is scattered over four quite different literatures and each has
implications for how we might think about the pride we express in our cities. The
psychology literature addresses the way pride regulates individual behaviour (Reissland
1994, Rosenblatt 1988). The social identity literature considers the association between
pride and group membership and a growing body of work in economics considers the
way pride is associated with departures from rational behaviour. Political scientists focus
their attention on the pride we exhibit in our country, on national pride.
In psychology, pride has been characterised as an attitude and an expression of personal
self-esteem, and is referred to as a ‘social emotion’ (Haidt 2003). The feeling of pride is
something that we absorb socially from a young age because pride is closely linked with
identity formation (Reissland 1994). Beginning with the development of self-concept as a
child, we learn how to associate actions with positive self-esteem and we gain a sense of
identity in order to interact socially (Tracy, Robins 2004, 2007).
Tajfel, Turner (1979) show that the groups we belong to are an important source of
pride and that much of our self-esteem arises from membership of collectives. Building on
this literature, Rosenblatt (1988) shows that individuals who form a group share the same
ego ideal and thus identify with one another: “The assertion of a group affiliation appears
necessary to make some of the status ‘rub off’.” (Rosenblatt 1988, p. 69). Membership of
a collective can also help create a sense of self awareness. As Sullivan points out, “At
some level, there is an understanding that the events in question are concerned with ‘us’
and celebrate ‘our’ achievements, values, standards or goals, which implicitly or explicitly
constructs or imagines an ‘other’” (Sullivan 2014b, p. 1–2).
Economists have explored the role of pride as an example of behaviour which departs
from the ‘rational’. For example, personal pride might inhibit an unemployed person from
accepting the dole, or encourage others to work harder for no additional remuneration.
Pride is also relevant in understanding conformism in consumer behaviour (Wilcox et al.
2011).
One of the collectives in which pride has long been associated is the nation, the
“positive affect that the public feels towards their country” (Smith, Kim 2006, p. 127).
National pride involves admiration and stake-holding as well as, “the feeling that one
has some kind of share in an achievement or admirable quality” (Evans, Kelley 2002, p.
303). Fabrykant, Magun (2015) go on to make a useful distinction between pride based
on objective and normative criteria3 . National pride has been characterised as imagined
kinship through shared acceptance of political institutions and norms (Ha, Jang 2015)4 .
The nation and the city are both spatially bound collectives but they differ over the
role of choice. Most people do not have a choice of country, whereas it is rare not to
have a choice of city therein. Investing in the city is therefore discretionary in a way it is
not with the country5 . This may be one of the reasons why, “the ‘sentiment of urban
pride’ is becoming more and more popular and widespread as a form of identity that
often dominates the national one” (Bell, de Shalit 2011, Pachenkov 2014, p. 368). It is
3 They argue that rational national pride requires some objective grounds to believe in a nation’s
perfection, and normative national pride is not so strongly related to objective achievements and therefore
can be more easily manipulated. The practical implication of this difference stems from the fact that in
their search for objectively grounded national pride people would be eager to foster country achievements
and their maintenance of normatively imposed pride requires in many cases just reliably protected wishful
thinking (Fabrykant, Magun 2015). Elements of this argument may well apply to cities, but a more
sophisticated question on urban pride than the one available for this paper would be required to test its
applicability.
4 The degree to which national pride originates from ‘civic’ versus ‘ethnic identity’ is still a matter of
debate within this literature and the results depend partly on whether individuals are being compared
across countries (Reeskens, Wright 2011).
5 For this very same reason however there is a need to pay closer attention to issues of endogeneity in
the study of urban pride compared to national pride.
REGION : Volume 3, Number 2, 2016
�106
P.S. Morrison
also one of the reasons for the growing attention being paid to city branding (Sevin 2014,
Zenker, Rutter 2014).
2.1
Urban pride
There are three main reasons why scholars have begun to pay attention to urban pride.
The first has been to identify ‘soft’ returns as complements to the financial returns to
investment. The focus here is on the degree to which local investments enhance pride in
the region or country (think most recently of the Olympics in Rio de Janeiro, or London
four years earlier)6 . A second reason is to better understand ways of fostering urban
pride (Trueman et al. 2004), notably through city promotion (Anttiroiko 2015). Both
these literatures focus primarily on the aggregate or collective consequences of urban
pride rather than the way pride is distributed across city residents themselves.
A third reason has been to understand how pride has been invoked in support of
urban redevelopment. Williams (1995), for example, has shown how the term urban pride
has been used in the United Kingdom to promote a realignment of urban regeneration
policy based on public-private sector partnerships7 . He argues that so-called City Pride
experiments of the early 1990s were only superficially about city pride and were more
about procurement and delivery of resources for the development of property8 . As such,
city pride has been used as a smokescreen for a much narrower set of interests, public
and private (Randall 1995)9 .
In a more recent paper, Collins (2016) considers the way in which cities promote and
defend local identity and autonomy through the evocation of ‘civic pride’. The contrast
between Collin’s perspective and the one I take below invites a distinction between civic
pride as the term is used by various urban leaders and spokespersons, and what I introduce
here as urban pride, the pride expressed by individual residents in their city. According
to this distinction, civic pride refers to pride packaged from the ‘top’ by city leaders and
urban pride to pride expressed from ‘below’, by individual residents.
Defined in this way civic pride and urban pride represent different perspectives and
are likely to be measured and analysed in different ways. For example, Collins applies
a discourse analysis to recent urban documents and local media as a way of examining
how civic pride is mobilised and promoted within and beyond the city. By contrast, my
paper is concerned with how and why urban pride is expressed by individuals and the
relative effect of the city on those relationships. I apply a statistical model in order to
understand the implied multilevel variance.
One of the possibilities that emerges from the identification of these two types of pride,
civic and urban, is that the view from the ‘top’, may not be highly correlated with the
view from the ‘below’. One of the reasons for this disjuncture is statistical: civic pride is
a packaged average based largely on anecdote whereas urban pride is a distribution based
on a representative sample of city residents. The latter can range from very high levels of
urban pride expressed by residents who are passionate about their city through to quite
6 There is also evidence that international sporting success can be captured in higher subjective
wellbeing (Pawlowski et al. 2014) even if the effect is short lived (Cummins 2009). The propagation
of urban pride via the Sydney Olympics also appears to have been successful because, “Regardless of
socio-economic divisions within Sydney, the anticipatory effect of hosting an Olympics united residents in
feelings of achievement, civic pride and community” (Waitt 2001). The united Germany’s quest for the
FIFA world cup is another example (Sullivan 2014b,a) (Sullivan, 2014a, 2014b). The collective pride
in that responsibility promoted subjective wellbeing and accelerated the convergence of East Germans’
preferences towards those of West Germans (Sussmuth et al. 2010).
7 The City Pride initiative was announced in November 1993 with Birmingham, London and Manchester
being challenged to prepare a ‘City Prospectus’ in “an attempt to provide a coherent vision involving the
cultural assimilation of local ‘partners’ and ‘stakeholders’, and competitive resource targeting beyond
existing bidding mechanisms” (Williams 1995).
8 The policy was more directly aimed at collective co-ordination of investment and local service
provision with a focus on, “sustainable development, and the need to increase integration between land
uses and the activities of the various actors in order to improve the quality of urban life” (Williams 1995).
9 From Randall’s perspective the City Pride movement in the UK in 1990s was, “a property rather
than people-led vision of urban development with its implicit, if unsubstantiated, faith in its supposed
spin-offs percolating downwards to benefit all social layers . . ..it is exclusionary, allowing participation
only to those who can afford the entry price” (Randall 1995, p. 43).
REGION : Volume 3, Number 2, 2016
�P.S. Morrison
107
negative views expressed by those who are actively hostile. As I show below, the actual
variance is quite wide, complex, and in need of understanding.
2.2
Hypotheses
The broad hypothesis of this paper is that the level of urban pride returned by city
residents is a function of their individual and collective stake in the city. Without stake
holding there is no urban pride and I propose four types: emotional, financial, cultural,
and civic stakeholding. Although these respective stakes can operate independently they
can also be reinforcing such as when the emotional and cultural combine, or the financial
and civic join forces.
The first form of stake holding is the ‘emotional ’, the way people feel about the city
and what it means to them personally. This form of sentimental attachment takes time
to develop and deepen and for this reason it is positively associated with the duration of
residence. Those residents whose families have grown up in the city and whose friends
continue to live there have a major stake in their continuing presence in the city. The
2011 earthquake in Christchurch, New Zealand was a salient reminder of the emotional
cost to residents who experienced their city being removed from under them.
The second form of stake holding is ‘financial ’. Prime candidates are home owners
and those in full-time employment who have the means to invest locally. Their livelihood
is tied materially to the fortunes of the city. By extension, those who find it difficult to
get an economic foothold in the city are likely to have a lower stake which is expected to
be reflected in lower levels of urban pride.
The third type of stake holding I term ‘cultural ’ and involves those whose sense of
collective (as opposed to personal) identity is linked to the way the city meets their
cultural needs. Their initial support is tied to the sharing of their location with others
like them and their pride in their city largely reflects what living in the city means to
them in identity terms.
The fourth type of stake holding I refer to as ‘civic’ for it refers to the level of
engagement people have with the leadership, administration, and general running of the
city.
There have been very few attempts to actually measure and quantify urban pride.
Some initial steps were made in response to a perceived reduction in community belonging
associated with the restructuring of cities and towns in the United Kingdom (e.g. Wood
2006)10 . The restructuring of the New Zealand economy in the 1980s and 1990s prompted
a similar response when local governments realised that evidence on quality of local life
and wellbeing was needed if they were to make credible cases for devolution. The result
was the introduction of an on-going survey aimed at capturing the quality of urban life in
the late 1990s, the New Zealand Quality of Life Survey11 .
10 Few surveys have asked about pride of any kind. An exception is the World Value Survey (WVS),
which includes a question about the ‘degree of pride in your work’ and ‘pride in your nationality’. The
International Social Survey Programme (ISSP) National Identity modules come close. They ask ‘How
close – how emotionally attached – do you feel to . . . your town or city’ (Kelly 1998). However such
a question does not capture pride as a distinct emotion. Both surveys are also administered in New
Zealand and the responses have been explored by the author (but not reported here) and offer support
for the conclusions drawn on the basis of the New Zealand Quality of Life Survey. The closest the New
Zealand General Social Survey comes is a question on satisfaction with services.
11 Details of the New Zealand Quality of Life Project may be found in http://www.qualityoflifeproject.govt.nz/. In addition to being followed by descriptive reports after each round, the Quality of Life
Survey has also been used as the evidence base for several research publications. The first used the 2004
sample to study inter-city variations in subjective wellbeing (Morrison 2007), and was later extended to
include measures of accessibility using the 2006 survey (Morrison 2011). In a later study, local economists
merged the 2006 and 2008 Quality of Life Surveys in order to assess the role of home ownership on
social capital (Roskruge et al. 2013). These last three papers did not formally recognise the theoretical
and methodological implications of the fact that sampled individuals were grouped within cities (or by
neighbourhoods within cities) and hence that the micro-economic behaviour and attitudes of individuals
might vary depending on the particular geographic context in which they lived. The first to attempt
to measure context effects using the Quality of Life survey were local psychologists interested in how
people’s ‘sense of community’ varied across individuals and neighbourhoods (Sengupta et al. 2013). The
focus of their study however was the neighbourhood, not the city.
REGION : Volume 3, Number 2, 2016
�108
P.S. Morrison
1. Rodney 2. North Shore 3. Waitakere 4. Auckland 5. Manukau 6. Hamilton
7. Tauranga 8. Porirua 9. Hutt 10. Wellington 11. Christchurch 12. Dunedin
Note: Although Rodney is a district rather than a city, I retain the survey’s own
description of it as a city.
Source: Quality of Life Team (2009)
Figure 1: The location of the twelve cities included in the Quality of Life project. New
Zealand, 2008
3
The Quality of Life Survey
The Quality of Life Survey is a multi-agency research project designed to explore quality
of life issues every two years in a selection of New Zealand cities12 . The 2008 survey
was a partnership between twelve New Zealand City Councils and the Ministry of Social
Development. The survey captures New Zealand residents’ perceptions of their quality of
life, health and wellbeing, crime and safety, community, culture and social networks, city
council decision making processes, environment, public transport, lifestyle, and work and
study13 .
The 2008 survey was not the latest available at the time of writing. It was selected for
this particular study because a subsequent amalgamation of the four previously separate
Auckland cities to form a new unitary authority reduced the number of urban areas from
12 to 8 thus reducing the range of cities which could be included14 . The locations of the
twelve cities covered in the 2008 survey are shown in Figure 1.
The twelve cities include almost 59 percent of the country’s total population. The
largest city, as of the 2006 census, was Auckland City (404.6 thousand), followed by
Christchurch (348.4), Manukau (329), and North Shore (205.6). The smallest was Porirua
City (48.5). As Figure 1 shows, eight of the twelve cities were located in either the
Auckland or Wellington Metropolitan areas.
12 This
account draws on Quality of Life Team (2009, p. 4).
probabilistic sample of the population of approximately 500 aged 15 years or older was drawn
from each city. The 2008 survey involved Computer Assisted Telephone Interviews (CATI) conducted
with n=8,155 (including 1,500 residents from outside the twelve cities who were aged 15 years and older).
Quotas were set for ethnicity, age, location and gender. Respondents were selected randomly from the
Electoral Roll and a pre-notification letter was sent to potential respondents, who were contacted by
phone for the interviewing. Fieldwork was conducted between 16 July and 28 October 2008. The average
duration of the interviews was 20.3 minutes and the final response rate was 37 percent.
14 Auckland Council became a unitary authority in November, 2010 when the Auckland regional council
area and seven territorial authority areas amalgamated Rodney district, North Shore city, Waitakere city,
Auckland city, Manukau city, Papakura district, and Franklin district.
13 A
REGION : Volume 3, Number 2, 2016
�P.S. Morrison
109
Table 1: Responses to the statement “I feel a sense of pride in the way [my city] looks
and feels”. Twelve New Zealand cities, 2008
Response
Strongly disagree
Disagree
Neutral
Agree
Strongly agree
Total
Frequency
Percent
Cumulative Percent
98
443
1,786
3,068
1,341
1.5
6.6
26.5
45.6
19.9
1.5
8.0
34.6
80.1
100
6,736
100.0
Source: Quality of Life Survey, 2008.
Note: Excludes 21 respondents who did not know.
Each city is divided into electoral wards which are a contiguous areal groupings of
relatively similar neighbourhoods. The four large cities in Auckland are divided into three
to six wards each, Wellington City into five wards and Christchurch into seven. The total
number of wards over the 12 cities is 5915 . The average number of sampled individuals
per ward is 103 although they range in size from a minimum sample of 2 to a maximum
of 230 people. Some individuals were not able to be assigned to wards thus reducing the
usable sample size when wards are analysed from 6117 to 609316 .
3.1
Measuring urban pride
The measure of urban pride used in this paper are the responses to the following question:
“On a scale of one to five where one is strongly disagree and five is strongly agree, rate
your agreement with the statement, ‘I feel a sense of pride in the way [my city] looks and
feels’.”17
The general tendency was for New Zealand city dwellers to return at least some level
of pride in their city. The responses tabulated in Table 1 show that almost 63 percent
(45.2 + 19.9) felt positively about ‘how their city looked and felt’. Over one quarter were
ambivalent in that they neither agreed nor disagreed, and fewer than 10 percent (7.7) did
not feel a sense of urban pride as defined.
The urban pride question generates responses on an ordinal scale. While methods
of analysing such responses are well developed (Hosmer, Lemeshow 2000, McKelvey,
Zovoina 1975) it is now common for quantitative analysis of related wellbeing questions
to assume a cardinal level of measurement (Ferrer-i Carbonell, Frijters 2004). The
estimated coefficients are much easier to interpret and accord very closely with the
relative magnitudes estimated by the ordinal logit model (Kristoffersen 2010)18 .
15 Boundary maps of the electoral wards laid over standard Google street maps may be found in:
https://koordinates.com/layer/2159-nz-electoral-wards-2011-yearly-pattern/
16 Since multilevel analysis involves two or more levels, questions are often asked about optimal sample
sizes. Hox (2002) mentions Kreft’s 30/30 rule, which suggests 30 groups with at least 30 individuals in
each. This could be sufficient for the estimation of the regression coefficients but inadequate for other
purposes. If it is cross-level interactions that are of interest, Hox recommends the 50/20 rule: 50 groups
with 20 or more in each group. If there is strong interest in the random part, the advice is 100 groups with
a minimum of ten in each: http://essedunet.nsd.uib.no/cms/topics/multilevel/ch3/5.html. A slightly
different take is offered by Rabe-Hesketh, Skrondal (2008, p. 62): “It is often said that the random-effects
approach should only be used if there is a sufficient number of clusters in the sample, typically more
than 10 or 20. However, if a random-effects approach is used merely to make appropriate inferences
regarding β, a smaller number of clusters may suffice. Regarding cluster sizes, these should be large in
the fixed-effects approach if the αj are of interest. However, in random-effects models, it is only required
that there are a good number of clusters of size 2 or more. It does not matter if there are also ‘clusters’
of size 1”.
17 Administration of four validity tests – content, retest, criterion and construct validity – confirmed
that the pride question was sufficiently robust to be modelled. The urban pride question produced similar
distributions when it was asked in in 2004, 2006, 2010 and again in 2012.
18 Decisions to report the OLS results from Likert scales are now routine (see for example Helliwell,
Putnam 2004, p. 1438).
REGION : Volume 3, Number 2, 2016
�110
P.S. Morrison
Treating urban pride as a continuous measure yields a mean 3.71 on the 1-5 scale
(SD=0.87). The highest average level of pride, 4.12, was reported by residents of Wellington
City (the country’s capital), and the lowest were returned by residents in the City of
Manukau, 3.33, located within the wider Auckland region. The intermediate levels of urban
pride in descending order were the cities of North Shore 3.90, Dunedin 3.87, Tauranga,
and Hamilton, 3.83 Christchurch 3.82, Waitakere, 3.62 Lower Hutt, 3.61 Porirua, 3.57
Rodney, 3.56 and Auckland, 3.48.
In summary, the New Zealand Quality of Life survey has provided the research
community with an opportunity to explore the distribution of urban pride across the
country’s cities. Urban pride is captured in a single measure which asks respondents to
declare how strongly they agree they feel a sense of pride in the way their city looks and
feels. Following common practice in studies of subjective wellbeing, I treat the ordinal
responses as cardinal and will now model this variation as a function of individual stake
holding and city characteristics19 .
4
The two level model
Most studies of emotional response apply the conventional OLS ‘total’ regression model
to the relationship between the outcome y and arguments X in order to estimate the
fixed parameters α and β, where i refers to the individual20 .
y i = α0 + βXi + ǫ i
(1)
In such a model the random or allowed-to-vary element is captured by ǫ , the mean
or expected value of which is assumed to be zero. An accompanying assumption is that
there is constant variability in ǫ i and no autocorrelation. The assumption is necessary if
the variance of the error term is to be characterised by a single parameter σǫ2 .21
The application of equation (1) would fail to address two integral features of urban
pride: that pride is likely to be contagious within the city, as well as being responsive to
differences between cities. The presence of contagion and inter-city differences violates the
i.i.d assumptions of the OLS regression model implicit in ǫ and renders the occurrence of
type 1 errors more likely (Kreft, du Leeuw 2006, Rabe-Hesketh, Skrondal 2008).
A more suitable model would allow average levels of urban pride to vary across cities
so that the average level of urban pride in the j th city is the sum of the city-wide average,
α0 , plus a varying difference u j .22 . The fixed intercept, α0 , would represent the average
level of urban pride across all the cities and the variance, σµ2 , would measure the inter-city
variability about the average23 .
a0j = α0 + u j
(2)
Combining the micro equation of (1) and the macro equation of (2) produces the
two-level mixed model of equation (3).24
uj + ǫ ij )
y ij = α0 + βxij + (u
(3)
An initial step in applying this random intercepts model is to estimate the proportion
of the variance attributable to differences among individuals at one level and cities at the
other. In this null model,
19 Multilevel models are used to estimate context effects – in this case the marginal and cross-level
effect of the city (context) on urban pride. Two useful introductions to the method are Luke’s study of
voting behaviour in the USA (Luke 2004) and Jones et al. (1992) for the UK.
20 I follow Kreft, du Leeuw (2006, p. 22) in writing random variables in bold, y and ǫ .
i
i
21 The following account draws on two particularly clear introductions to multilevel models in two fields,
geography and public health (Jones 1991, Subramanian et al. 2003).
22 Although I introduce a layer between the individual and city, the ward variation turns out to simply
be a composition effect. Therefore the three level model will not be continued into the multilevel model
and j will continue to refer to the city level.
23 If this equation was used to estimate the relationship between urban pride and the level of stake
holding the effect of the city itself would be subsumed within the error term ǫ i and go unrecognised as
such. By contrast, the random intercepts model (equation 3) allows this inter-city heterogeneity to be
recognised.
24 There is of course also an implicit variable here multiplied by α , x which is a vector of ones
0
0
REGION : Volume 3, Number 2, 2016
�P.S. Morrison
111
Table 2: Intra-class correlation coefficients: cities, wards, cities and wards. New Zealand
2008
Levels
ICC
SE
Cities
Wards
Cities/Wards
Wards/Cities
0.06
0.07
0.06
0.07
0.02
0.01
0.02
0.02
95% confidence interval
0.03
0.05
0.02
0.03
0.12
0.11
0.12
0.13
Source: Quality of Life Survey, 2008.
Source: Quality of Life Survey, 2008.
Figure 2: Inter-city variation in urban pride: predicted random intercepts by city. New
Zealand 2008.
y ij = α0 + (u
uj + ǫij )
(4)
where the proportion of the variance attributable to individuals is
σǫ2
σǫ2 + σµ2
and the variation across cities is
σµ2
σǫ2 + σµ2
which is referred to as the intra-class correlation (ICC).
In this application, the intra-class correlation is a measure of the degree to which
individuals share the experiences of living in the same city. If the correlation is greater
than zero then there is a case for applying a random coefficients model and its extension
as a multilevel model. The presumption in such a step is that the differences we see in
the level of urban pride from one city to another is not due simply to differences in the
levels of stake holding by individual residents (the composition effect) but arise in part
from differences among the cities themselves (the context effect).
An intra-class correlation coefficient of 5.7 percent implies that differences in levels of
urban pride across the 12 cities account for nearly 6 percent of the variance in urban pride
(Table 2). The rest, 94 percent, is due to the differences among individuals. A similar
partitioning of the variance applies if clustering is confined to the 59 wards, however since
REGION : Volume 3, Number 2, 2016
�112
P.S. Morrison
Source: Quality of Life Survey, 2008.
Figure 3: Ward to ward variation in urban pride within cities: predicted random intercepts
by wards within cities. New Zealand 2008.
wards are nested within cities, both variances are reduced slightly when they are both
included; to 5.5 and 6.6 percent, respectively25 .
In summary, since urban pride varies both within and between cities as a possible
result of both contagion and intercity differences, the standard OLS regression model is
better replaced by one which treats the city as a random variable.
5
A random intercepts model
The random intercept model of equation (4) implies a different intercept term for each
city, α + µj ; j = 1, . . . , 12. These terms are not estimated directly but we can use linear
unbiased predictions (BLUPS) of their random effects as shown in Figure 2. At one
extreme, the City of Manukau has a prediction one half a standard deviation lower than
the grand mean, and Wellington City almost half a standard deviation higher. These
differences in the average level of urban pride across the twelve New Zealand cities are
immediately recognised by New Zealand audiences (often with a smile).
Recognising that average levels of urban pride vary across New Zealand cities does
not in itself address the fact that urban pride may vary within cities. We can identify
variation both within and between cities by adding the neighbourhood intercept term u ∗
to equation (3), that is, u j + u ∗ + ǫ ij . Ward random effects are not calculated directly
either but we can overlay their best linear unbiased predictions as in Figure 3. The
median in each box reflects the city random intercepts while the length of the boxes (and
the outliers) indicates the degree of inter-ward variation within each city.
As Figure 3 shows, the inter-ward variation in urban pride varies noticeably from
one city to another, being relatively wide in Rodney and Manukau and Porirua and
comparatively narrow in Wellington and Auckland.
5.1
Differences among residents
As expected, urban pride varies across cities. It also appears that levels of urban pride
vary by ward. We now turn to the third possible source of variation – differences among
individuals themselves.
Nine separate sources of individual stake holding along with two controls are listed
under the four headings in Table 3 together with their respective means and standard
25 Similar magnitudes are obtained when pride is represented as a binary variable, i.e. when 1 is set to
either Strongly Agreeing with the pride statement or Agreeing and Strongly Agreeing.
REGION : Volume 3, Number 2, 2016
�P.S. Morrison
113
Table 3: Measures of stake holding and controls used in the modelling of urban pride.
New Zealand, 2008
Variable
Description
Mean
Std Dev
Controls
Female
Health
Female
Health good or very good
0.53
0.61
0.50
0.49
Emotional stakes
Duration
Community
Resident in city 10 years +
Sense of community
0.70
0.55
0.46
0.50
Financial stakes
Owner
Not employed
Enough
Home owner
Not employed
Income meets everyday needs
0.62
0.26
0.87
0.49
0.44
0.34
Cultural stake
Minority
Non-European
0.23
0.42
Civic stakes
Safe
Clean
Council
Feel safe in central city
No rubbish noticed
Councidence in Council decisions
0.63
0.49
0.46
0.48
0.50
0.50
Source: Quality of Life Survey, 2008.
Note: The relevant survey questions are listed in the Appendix.
deviation. Each is a binary variable coded so that the expected sign is positively correlated
with urban pride. The emotional stake in the city is represented by two variables. The
first is duration of residence and we learn that over 70 percent of residents had lived in
their city for a decade or more. Notwithstanding this long average association with the
city, only 55.3 percent felt their neighbourhood offered them a sense of community.
Three measures are designed to capture residents’ financial stake in the city: homeownership (62 percent)26 , employment (over three quarters) and nearly 87 percent said
they had enough money to live on27 . Having a cultural stake in the city is represented
by a single variable, membership of a minority ethnic group, collected here under the
term non-European (23 percent)28 . Three measures were used to identify civic stake
holding: whether the respondent felt safe or very safe in their city centre during the
day (63.4%), whether they identified litter and rubbish lying on the street (49.3%), and
whether they agreed that ‘the council makes decisions that are in the best interests of
their city’ (45.5 %)29 . The two controls in Table 3 reveal a slight majority of women
in the sample (52.8%), and a population where nearly 61 percent of respondents are in
Good or Very Good Health.
26 The exact definition of home ownership affects the strength of the relationship between ownership
and pride, the tighter or more literal definition the stronger the link. See the Appendix for the definitions
used.
27 This subjective measure of economic prosperity has been selected for two reasons. Firstly, although
income (at both the individual and household level) is collected by the survey, the response rates are
unacceptably low. Secondly, when people report their perceived ability to cope financially they implicitly
consider the local costs of living and these vary from one city to another.
28 The term European is ambiguous in the New Zealand context for various reasons including the
widespread presence of dual ethnicity. In this survey around seven percent of respondents reported
dual ethnicity (mainly Maori and European). They have been included here as European as have those
identifying as ‘Kiwi’ or New Zealander.
29 The base population implied by Table 3 (where all the arguments take zero values) identifies European
men in relatively poorer health who have lived in the city for less than a decade, who do not feel a sense
of community, who are not owners but are employed and have enough money. This group typically feels
less than safe in their central city, notice rubbish less and feel the council does not act in the city’s best
interests.
REGION : Volume 3, Number 2, 2016
�114
P.S. Morrison
Table 4: Correlation matrix of urban pride arguments. New Zealand, 2008
1
1
2
3
4
5
6
7
8
9
10
11
2
3
4
5
6
7
8
9
10
Female
1.00
Health
0.04
1.00
Duration
0.04 -0.01
1.00
Community
0.04
0.04
0.03 1.00
Owner
0.04
0.01 0.06 0.09
1.00
Not employed 0.12 -0.10 0.05 0.08 -0.02
1.00
Enough
0.01 0.10
0.04 0.01 0.10 -0.07
1.00
Minority
-0.04 -0.11 -0.14 0.06 -0.18 -0.06 -0.10
1.00
Safe
-0.06 0.12
0.00 0.01 -0.05
0.02
0.04 -0.08 1.00
Clean
-0.03
0.02 -0.05 0.04
0.02
0.00
0.02
0.01 0.11 1.00
Council
0.00
0.03 -0.05 0.09 -0.13
0.03
0.02 0.10 0.07 0.09
Source: Quality of Life Survey, 2008.
Number of observations: Min 5957 to Max 6093.
5.2
The correlation matrix
The pairwise correlation matrix of the 11 variables listed above is reproduced in Table
4. Although the variance inflation factor was low at 1.05 and tolerances were all over
0.9, almost half the pairwise correlations were statistically significant (p ≤ 0.05 in bold
italics)30 .
The connections implied by this correlation matrix are instructive. Reading the
statistically significant correlations by column shows that women (column 1) were more
likely to feel a sense of community in their neighbourhood, were less likely to be employed,
and felt less safe within the city centre during the day. From column 2 we learn that
good health was associated with being employed, having enough money, being defined as
European, and feeling safe. Column 3, duration, identifies those who lived in the city for
a decade. They are more likely to be home owners, less likely to be employed or identify
as a minority. They are also more likely to be critical of the city in terms of its cleanliness
and the extent to which the council represents the interests of the majority.
Feeling a sense of community (column 4) is positively correlated with home ownership,
not being employed, being a minority, seeing the city as clean, and feeling positive about
council. Home ownership (column 5), is associated with having enough money and not
being a minority, but also not feeling safe in the city centre or agreeing that council
works in the best interests of the majority. Not being employed (column 6) is negatively
associated with having enough money and not identifying with minority status. Having
enough money (column 7) is a characteristic of minorities, as is feeling very safe in the
city centre, but feeling less positive about council decisions. Identification with a minority
is negatively correlated with feeling safe in the central city but positively associated with
approval of council. Those who feel safe in the city also view the city as clean and have
a positive view of council (column 9). Appreciating a clean city and viewing council
positively are positively correlated (column 10).
The results of applying the random intercepts model (equation 3) are presented in
Table 5. The results only include city random effects because the inter-ward intra-class
correlation dropped to almost zero. In other words, ward to ward differences in urban
pride were due almost entirely to population composition effects rather than to unique
contexts characteristic of the wards themselves31 . Cities, rather than wards within them,
are the primary object of city pride as the city pride question itself implies.
The first point to note from the fixed effects estimates in Table 5 is that urban pride
is most strongly associated with civic stake holding, and with the confidence people have
that their council works in their best interests. Those supporting Council have a mean
30 The
Šidák correction used here takes multiple comparisons into account.
many applications of the multilevel model adding successive attributes of individuals absorbs some
of the variance that occurs between level 2 groups. The variability in the ICC that takes place when
variables are added can reflect an incomplete specification of the level 1 effects model.
31 In
REGION : Volume 3, Number 2, 2016
�P.S. Morrison
115
Table 5: The distribution of urban pride. Stake holding fixed effects and city random
effects. New Zealand, 2008
Variable
Description
Coef. Std Err.
z
P > |z|
FIXED EFFECTS
Controls
Female
Health
Female
Health good or very good
0.10
0.06
0.02
0.21
4.91
3.01
0.00
0.00
Emotional stakes
Duration
Resident in city for 10 years or more
Community
Sense of community
0.11
0.24
0.02
0.02
4.78
11.22
0.00
0.00
Financial stakes
Owner
Home owner
Not employed Not employed
Enough
Income meets everyday needs
0.08
0.06
0.10
0.08
0.02
0.03
3.80
2.45
3.17
0.00
0.01
0.00
Cultural stakes
Minority
Non-European
0.20
0.03
7.44
0.00
Civic stakes
Safe
Clean
Council
0.21
0.23
0.37
0.02
0.02
0.02
9.37
11.20
17.68
0.00
0.00
0.00
2.80
0.07
37.36
0.00
Feel safe in the central city
No rubbish noticed
Confidence in council decisions
Constant
RANDOM EFFECTS
Cities
Constant
Residual
0.04
0.61
Number of cases
Log likelihood
LR vs linear model test
Wald chi, pr=0
Degrees of freedom
AIC
Intraclass correlation
0.02
0.01
5867
-6897.12
348.72
982.88
14
13822.23
0.07
Source: Quality of Life Survey, 2008.
Note: Estimates from the MIXED model, Stata14.
level of urban pride which is over one third (0.37%) of a unit higher than the rest of the
population on the 1-5 urban pride scale. Those who feel a sense of community, see a clean
city, and feel safe in its centre have a mean pride between a fifth and a quarter of a unit
higher than the base population. Being non-European has a similar effect (0.20).
Having lived in the city for a decade or more has a weaker but still positive effect
on urban pride, as does being female and being in good health. Having enough money
to meet every day needs and being a homeowner are less important but still positive,
increasing urban pride by at 0.10 and 0.08 of a unit, respectively. Being in retirement
(most of those not employed) also contributes (0.06).
The model with covariates is a clear improvement over the null model with cities
alone. In the absence of a clear equivalent of the r-squared statistic, R2 , I use the Akaike
Information Criterion (AIC) (−2 log (likelihood) + 2k), where k is the number of model
parameters and −2 log (likelihood) is the deviance statistic. The difference between the
null model and the model reported in Table 5 in AIC terms is 1901 = 15723-13822.
In summary, when it comes to accounting for the way urban pride varies over the
population, the measures introduced to represent stake holding clearly matter. Urban
REGION : Volume 3, Number 2, 2016
�116
P.S. Morrison
Table 6: Selected characteristics of the twelve New Zealand cities.
City
Pride
Population(’000)
Affluence
European
Council
Rodney District
North Shore City
Waitakere City
Auckland City
Manukau City
Hamilton City
Tauranga City
Porirua City
Lower Hutt City
Wellington City
Christchurch City
Dunedin City
3.56
3.90
3.62
3.48
3.33
3.83
3.87
3.57
3.61
4.12
3.82
3.88
89.56
205.61
186.44
404.66
323.97
129.25
103.64
48.55
86.93
179.47
348.44
118.68
0.10
0.13
0.07
0.14
0.07
0.07
0.06
0.10
0.09
0.17
0.07
0.05
0.95
0.77
0.67
0.62
0.46
0.76
0.88
0.66
0.75
0.81
0.88
0.92
0.30
0.44
0.48
0.40
0.51
0.57
0.40
0.51
0.47
0.50
0.41
0.46
Source: Census of Population and Dwellings, 2006 and Quality of Life Survey, 2008.
pride is most sensitive to the degree to which council is recognised as listening to the
people, a result which highlights the role of city leadership (Boezeman, Ellemers 2014).
Feeling a sense of community, appreciating a clean city, and feeling safe in the city centre
all contribute to a sense of urban pride as does being a member of an ethnic minority.
Having a financial stake in the city (having enough income and being a homeowner) also
matters but not to the degree anticipated.
6
City context
The results I have summarised from Table 5 suggest that urban pride reflects a sense of
collective achievement rather than personal success. We might ask in addition whether
cities themselves raise or lower urban pride. In the absence of an empirical literature on
urban pride, I start with four relatively generic attributes of the city: its population size,
its level of affluence, the share of Europeans in the population, and the confidence people
have in its civic leadership. It is possible to think of a range of other measures such as
the quality of the environment, but these will remain as suggested refinements only.
The distributions of the city’s four characteristics are shown in Table 6 along with
the average level of pride in each city. The population figure is drawn from the nearest
population census (2006) as are the proportion of individuals with pre-tax incomes of over
$70,000 per annum, and the proportion of Europeans in the city. The fourth variable,
civic engagement, is aggregated from the sample responses.
The fixed effects coefficients at the individual level remained remarkably stable when
each of these city level measures is added to the model singly or together. The exception
is the variable ‘minority’ whose influence on urban pride drops as a result of the high
concentration of the minority population in the two cities of Manukau and Porirua.
While the difference between the cities themselves may not account for much of the
variance in urban pride, the contexts they represent may still condition the marginal
effect of individual attributes. This tempering turns out to be the principle role of the
city when it comes to understanding urban pride.
7
The multilevel model
Urban pride is a two-way street because it reflects attributes of both the residents and
the characteristics of the city. However, while New Zealand cities do differ in size and
composition, their differences appear to have little influence in raising or lowering urban
pride. Rather, the role of the characteristics of the city is to modify the way particular
forms of stake holding raise or lower urban pride.
REGION : Volume 3, Number 2, 2016
�P.S. Morrison
117
Source: Quality of Life Survey, 2008 and Census of Population and Dwellings, 2006.
Note: With the same fixed and random effects as in Table 5 adding the interaction of
enough x owner x affluence term yields a coefficient of -3.72 and a standard error of 1.91
and a z of -1.95 and p > (z) of 0.052. The 95% confidence intervals are plotted.
Figure 4: The effect of ‘not having enough money’ on urban pride in more affluent cities
by housing tenure. New Zealand, 2008
I illustrate this last point by showing that the negative effect on urban pride of not
having enough money has greater effect in more affluent cities, that the level of urban
pride exhibited by minorities rises as their share of the population increases, and that
duration of residence modifies the way city-wide support of the local city council affects
urban pride. These do not exhaust the possible interactions between individuals and their
city of course, but they do indicate the way the city can influence the level of urban pride
people express.
7.1
The influence of context on financial stake holding
The motivation for the first of these illustrations is the possible role of relativities. The
argument here is that it is not just financial wellbeing that moderates one’s pride in the
city but one’s relative position. Recall from Table 6, that affluence at the city level is
measured as the proportion of the 2006 census population who earn more than $70,000
per annum (before tax). The range across New Zealand cities is quite wide, from a low of
five percent in Dunedin City through to 17 percent in the capital, Wellington City. The
testable proposition is that not having enough money ‘to meet every day needs’ may have
a greater negative effect on urban pride in more affluent cities because it is associated
with lower relative rank, over and above the pride reducing effects of material deprivation
itself. The secondary argument is that this relationship will vary with homeownership.
I have already shown that, as a characteristic of the city, affluence (a level 2 variable)
plays a very limited role in raising or lowering urban pride. However, when having enough
money (a level 1 variable) is interacted with city affluence separately for owners and
renters, renters without enough money (typically younger residents) return higher levels
of urban pride in cities which are more affluent. This result is apparent in the solid line
in the right panel of Figure 4. By contrast, homeowners without enough money (typically
older residents) return lower levels of urban pride in more affluent cities (solid line, left
panel of Figure 4).
By contrast, renters and owners who say they have enough money to meet daily
needs both return higher levels of urban pride in more affluent cities (the dashed lines
in Figure 4) with city affluence having a more marked influence on homeowners’ urban
pride. The results presented in both panels of Figure 4 are plausible in light of the role I
have attributed to stake holding.
REGION : Volume 3, Number 2, 2016
�118
P.S. Morrison
Source: Quality of Life Survey, 2008 and Census of Population and Dwellings, 2006.
Note: With the fixed effects of Table 5 in the model, the addition of the cross-level term
(minority x European) is β = −0.710 ( SE=0.19; z= -3.74).
Figure 5: The positive impact of minority status on urban pride falls as the proportion of
Europeans in the city rises. New Zealand, 2008
7.2
Context influences on cultural stake holding
My second illustration addresses the impact minority ethnic status has on urban pride.
My expectation was that minorities would return higher levels of pride in cities the larger
their share of the population because the relative size of the minority groups have been
shown to contribute to both a greater sense of identity and collective strength (Tyler,
Blader 2001, p. 209–210). My expectation in the case of non-Europeans living in New
Zealand cities therefore was that their sense of identity would diminish as their share of
the population fell and this would be reflected in the level of pride they expressed in their
city. The evidence in this case rests on the interaction of the level 2 variable ‘European’
and the level 1 variable ‘minority’.
Figure 5 offers support for the minority ‘share’ hypothesis. The fixed effects results of
Table 5 have minorities returning higher levels of urban pride than the European majority.
Introducing a city x minority cross-level effect reveals how much urban pride rises as the
proportion of Europeans in the city increases. This rise is much slower in the case of
minorities (dashed line) and the urban pride converges when the proportion of Europeans
in the city approaches its maximum. In other words, while members of ethnic minorities
in New Zealand return higher levels of urban pride than the much larger number of
Europeans, any such difference falls as the proportion of Europeans rises, reflecting an
expected diminution in the social and cultural identity of non-Europeans.
7.3
Does the urban pride effect of support for Councils vary with duration of residence?
A third possible factor influencing urban pride is duration of residence. However, discerning
this interaction is more complicated because the relationship could conceivably be two-way.
The length of residence in a city could be a function of as well as an influence on pride:
being proud of the city may encourage staying, and those who are not particularly proud
of their city may be more likely to leave. The endogeneity present in this relationship
renders my investigation of this relationship quite exploratory.
Those who see City Councils acting in the interests of the majority return higher
levels of urban pride (as I showed in Table 5). However it is possible that this relationship
is affected by how long people have lived in the city. The available duration of residence
variable only separates those who are relatively new to the city, from those who have
lived there for more than a decade. (Finer partitions beyond the decade offered little
REGION : Volume 3, Number 2, 2016
�P.S. Morrison
119
Source: Quality of Life Survey, 2008.
Note: The estimate of the Council x duration interaction term is β = 0.631 (se= 0.32), z
= 1.97.
Figure 6: The estimated relationship between urban pride and city wide support for
Council: longer vs. shorter term residents. New Zealand, 2008
further insight).
Figure 6, which interacts duration of residence with the proportion of the city supporting Council, suggests that the positive relationship between urban pride and the city’s
confidence in its council only applies to the longer term residents. The pride experienced
by relative new comers in their city appears unaffected by the confidence the city has in
its council. The 95% confidence intervals are relatively wide in this case but with the
fixed effects of Table 5 in the model the interaction between the level 1 variable duration
and the level 2 variable Council is statistically significant.
To summarise Section 7, when it comes to statistically accounting for the variance in
the pride we express in our cities, city characteristics themselves account for relatively
little. Most of the variance in urban pride comes down to the stake individuals have in
their city. Having said that, exactly how people’s stake in the city affects their level of
urban pride is influenced by the characteristics of the city. Being able to demonstrate
this contingency and the way in which city context modifies the effect of stake holding on
urban pride is one of the primary findings of this paper, and the main reason for reporting
the multilevel model.
8
Conclusions
Collins’ recent study of pride in British cities suggested that, “civic pride has been
under-theorised in geography and that the emotional meanings of pride need to be better
understood” (Collins 2016, p. 185). I agree, and in response, I have drawn a distinction
between civic pride as promulgated by city leaders and the emotion expressed by individual
residents themselves which I have termed ‘urban pride’. Such a contrast is designed to
expose the difference between city spokespersons claiming citizens are proud of their city
and individuals who are free to express their own personal level of urban pride. The later
has the value of demonstrating the way different levels of urban pride are distributed
both within and between cities.
Civic pride in the sense above is a dimension of self-esteem which city politicians and
planners go to great lengths to foster among their citizens. In practice however, most
cities are content simply to anecdote civic pride when it suits, and few make a serious
attempt to actually measure the level of urban pride empirically. New Zealand cities
may have been an exception in this respect by ensuring that their Quality of Life Survey
REGION : Volume 3, Number 2, 2016
�120
P.S. Morrison
actually included a question on the pride their residents have in their city.
In this paper I have sketched in a theory of urban pride based on stake holding as
it applies to the city. I identified four primary sources: the stake holding that accrues
through emotional attachment to the city, financial investment in the city, cultural
affiliation and civic engagement. I then specified a multilevel model in order to empirically
test the relative influence of such stake holding on urban pride. By drawing on a large
random sample from twelve cities in an otherwise relatively homogeneous country like
New Zealand, I have been able to assess the degree to which the stake individuals have in
the city influences how proud they feel.
As a result of the Urban Consortium funding a large sample of nearly 6000 residents in
2008, I have been able to show that certain types of stake holding have more influence than
others. After controlling for gender and self-assessed health, individuals positively disposed
towards their council, who felt safe and saw their city as clean and well maintained were
more likely to declare such pride. This is also true of those who felt a sense of community.
I also learned that, other things equal, those who owned their dwelling and who felt they
earned enough to meet every day needs also enjoyed higher levels of urban pride. When it
came to emotional stake holding, I was able to show that ethnic minorities return higher
levels of urban pride as their share of the city population increased.
I went into this project expecting that the identified characteristics of cities themselves
would have a major influence on the level of urban pride citizens report. This was not the
case. Most of the measurable variance turned out to be due to individual stake holding.
By explicitly testing for city x individual interaction (cross level effects) estimates from
the multilevel model revealed that city characteristics conditioned the way individual
stakes in the city influenced urban pride. They revealed how the negative effect on urban
pride of not having enough money is more marked in more affluent cities, how the higher
levels of urban pride exhibited by minorities increased as their share of the population
in the city rose, and how duration of residence affects the way aggregate support of city
councils conditioned citizens level of urban pride.
Although broader than Kenneth Boulding’s proposition on stake holding, the above
findings are consistent with his argument on pride and shame (Boulding 1987). At the
same time my analysis has rested on a single definition of urban pride – pride in the ‘look
and feel of your city’. There are many other ways of asking about urban pride and if and
when they are applied we may discover other ways in which stake holding alters the pride
we hold in our cities.
Measures of urban pride have been argued to be among the ‘soft’ returns that accrue to
accumulated investment in the city. If city leaders are tempted to use such ‘soft’ measures
alongside the standard financial measures, then we need to know a great deal more about
what people mean by urban pride, what generates the emotion, how it takes root and
among whom, in what circumstances, and in what kinds of cities. As we have learned
from the burgeoning literature on subjective wellbeing, investments in the community are
unlikely to carry the force of change unless their returns can be measured (Stiglitz et al.
2009). So far, urban pride has remained a largely unmeasured response to our feelings
toward our city and as such remains an unexploited barometer of the distributional
consequences of public and private investment.
REGION : Volume 3, Number 2, 2016
�P.S. Morrison
121
References
Anttiroiko AV (2015) City branding as a response to global intercity competition. Growth
and change 46: 233–252. CrossRef.
Bell DA, de Shalit A (2011) The spirit of cities. Why identity of a city matters in a global
age. Princeton University Press, Oxford
Bennett K (2013) Emotion and place promotion: passionate about a former coalfield.
Emotion, space and society 8: 1–10. CrossRef.
Boezeman EJ, Ellemers N (2014) Volunteer leadership: the role of pride and respect
in organisational identification and leadership satisfaction. Leadership 10: 160–173.
CrossRef.
Boulding KE (1987) The economics of pride and shame. Atlantic Economic Journal 15:
10–19. CrossRef.
Collins T (2016) Urban civic pride and the new localism. Transactions of the Institute of
British Geographers 41: 175–186. CrossRef.
Cummins RA (2009) The Australian Unity Wellbeing Index 2001-2008: variations in
subjective wellbeing linked with major events and inflation. Social Indicators Network
News 96: 1–4
Davidson J, Smith M, Bondi L (2007) Emotional geographies. Ashgate, Hamshire, UK.
CrossRef.
Evans MDR, Kelley J (2002) National pride in the developed world: survey data from 24
nations. International journal of public opinion research 14: 304–336. CrossRef.
Fabrykant M, Magun V (2015) Grounded and normative dimensions of national pride
in comparative perspective. Higher School of Economics Research Paper, National
Research University Higher School of Economics, Moscow
Ferrer-i Carbonell A, Frijters P (2004) How important is methodology for the estimates
of the determinants of happiness? The Economic Journal 114: 641–659. CrossRef.
Ha SE, Jang SJ (2015) National identity, national pride, and happiness: The case of
South Korea. Social Indicators research 121: 471–482. CrossRef.
Haidt J (2003) The moral emotions. In: Davidson RJ, Scherer KR, Goldsmith HH (eds),
Handbook of affective sciences. Oxford University Press, Oxford, England, 852–870
Helliwell JF, Putnam RD (2004) The social context of well-being. Philosophical Transactions of the Royal Society B: Biological Sciences 359: 1435–46. CrossRef.
Hosmer DW, Lemeshow S (2000) Applied logistic regression. John Wiley, Sons Ltd, New
York. CrossRef.
Hox J (2002) Multilevel analysis. Lawrence Erlbaum Associates, Mahwah, NJ. CrossRef.
Jones K (1991) Specifying and estimating multi-level models for geographical research.
Transactions of the Institute of British Geographers 16: 148–159. CrossRef.
Jones K, Johnston J, Pattie CJ (1992) People, places and regions: exploring the uses
of multi-level modelling in the analysis of electoral data. British Journal of Political
Science 22: 343–380. CrossRef.
Kelly J (1998) Attachment to one’s city. Australian Social Monitor 1: 14–15
Kreft I, du Leeuw J (2006) Introducing multilevel modelling. London. CrossRef.
Kristoffersen I (2010) The metrics of subjective wellbeing: cardinal neutrality and
additivity. The Economic Record 86: 98–123. CrossRef.
REGION : Volume 3, Number 2, 2016
�122
P.S. Morrison
Lea SEG, Webley P (1997) Pride in economic psychology. Journal of Economic Psychology 18: 323–340. CrossRef.
Luke DA (2004) Multilevel modelling. Sage Publications, London. CrossRef.
McKelvey RD, Zovoina W (1975) A statistical model for the analysis of ordinal level
dependent variables. Journal of Mathematical Sociology 4: 103–120. CrossRef.
Morrison PS (2007) Subjective well-being and the city. Social Policy Journal of New
Zealand 30: 74–103
Morrison PS (2011) Local expressions of subjective well-being: the New Zealand experience.
Regional Studies 45: 1039–1058. CrossRef.
Pachenkov O (2014) Review of: Da bell, a de-shalit (2011) why identity of a city matters
in a global age. oxford: Princeton university press. International Journal of Urban and
Regional Research 38: 366–368. CrossRef.
Pawlowski T, Downward P, Rasciute S (2014) Does national pride from international sporting success contribute to well-being? an international investigation. Sport Management
Review 17: 121–132. CrossRef.
Quality of Life Team (2009) Quality of life survey 2008. National report, Nielsen,
Wellington
Rabe-Hesketh S, Skrondal A (2008) Multilevel and longitudinal modeling using Stata.
Stata Press, College Station, Texas. CrossRef.
Randall S (1995) City pride - from ‘municipal socialism’ to ‘municipal capitalism’ ? Critical
Social Policy 15: 40–59. CrossRef.
Reeskens T, Wright M (2011) Subjective well-being and national satisfaction: taking
seriously the “proud of what?” question. Psychological Science 22: 1460–1462. CrossRef.
Reissland N (1994) The socialisation of pride in young children. International journal of
behavioural development 17: 541–552. CrossRef.
Rosenblatt AD (1988) Envy, identification, and pride. Psychoanalytic Quarterly LVII:
56–71
Roskruge M, Grimes A, McCann P, Poot J (2013) Homeownership, social capital and
satisfaction with local government. Urban Studies 18: 2517–2534. CrossRef.
Sengupta NK, Luyten N, Greaves LM, Osborne D, Robertson A, Armstrong G, Sibley
C (2013) Sense of community in New Zealand neighbourhoods: a multi-level model
predicting social capital. New Zealand Journal of Psychology 42: 36–45
Sevin HE (2014) Understanding cities through city brands: city branding as a social and
semantic network. Cities 38: 47–56. CrossRef.
Smith TW, Kim S (2006) National pride in comparative perspective: 1995/96 and 2003/04.
International journal of public opinion research 18: 127–136. CrossRef.
Stiglitz J, Sen A, Fitoussi J (2009) Report of the commission on the measurement of
economic performance and social progress. Commission on the measurement of economic
performance and social progress, Paris
Subramanian SV, Jones K, Duncan C (2003) Multilevel methods for public health research.
In: Kawachi I, Berkan LF (eds), Neighbourhoods and health. Oxford University Press,
Oxford, 65–111. CrossRef.
Sullivan G (2014a) Collective emotions, german national pride and the 2006 world cup.
In: Sullivan G (ed), Understanding collective pride and group identity: new directions
in emotion theory, research and practice. Routledge, New York
REGION : Volume 3, Number 2, 2016
�P.S. Morrison
123
Sullivan GB (2014b) Understanding collective pride and group identity: new directions in
emotion theory, research and practice. Routledge, New York
Sussmuth B, Heyne M, Maennig W (2010) Induced civic pride and integration. Oxford
Bulletin of Economics and Statistics 72: 202–220. CrossRef.
Tajfel H, Turner JC (1979) An integrative theory of intergroup conflict. the social
psychology of intergroup relations. In: S.Worchel WGA (ed), The social psychology of
intergroup relations. Brooks/Cole, Monterery, CA, 33–47
Tracy JL, Robins RW (2004) Show your pride: evidence for discrete emotion expression.
Psychological Science 15: 194–200. CrossRef.
Tracy JL, Robins RW (2007) Emerging insights into the nature and function of pride.
Current directions in psychological science 16: 147–150. CrossRef.
Trueman M, Klemm M, Giroud A (2004) Can a city communicate? Bradford as a
corporate brand. Corporate communications: an international journal 9: 317–330.
CrossRef.
Tyler TR, Blader SL (2001) Identity and cooperative behaviour in groups. Group processes
and intergroup relations 4: 207–226. CrossRef.
von Scheve C, Ismer S (2013) Towards a theory of collective emotions. Emotion Review 5:
406–413. CrossRef.
Waitt G (2001) The olympic spirit and civic boosterism: the Sydney 2000 Olympics.
Tourism Geographies 3: 249–278. CrossRef.
Wellington Regional Council (2011) Wellington Region Genuine Progress Index (GPI:
2001-2010). Technical report, Wellington Regional Council, Wellington
Wilcox K, Kramer T, Sen S (2011) Indulgence or self control: a dual process model of
the effect of incidental pride on indulgent choice. Journal of Consumer Research 38:
151–163. CrossRef.
Williams G (1995) Prospecting for gold; Manchester’s city pride experience. Planning
Practice and Research 10: 345–358. CrossRef.
Wood EH (2006) Measuring the social impacts of local authority events: a pilot study
of a civic pride scale. Internatiional Journal Nonprofit Voluntary Sector 11: 165–179.
CrossRef.
Zenker S, Rutter N (2014) Is satisfaction the key? the role of citizen satisfaction, place
attachment and place brand attitude on positive citizenship behaviour. Cities 38:
11–17. CrossRef.
REGION : Volume 3, Number 2, 2016
�124
A
P.S. Morrison
Appendix: Level 1 variables
The survey questions asked are as follows. The underlined responses are coded 1, the rest
as zero.
Health Q29: In general how would you rate your health? Poor, fair, good, Very good,
Excellent
Duration Q8: How many years have you lived in this city? Less than 1, 1-2, 2-5, 5-10,
10 years or more
Community-sense Q37: R2. I feel a sense of community with others in my local
neighbourhood: Strongly agree, Disagree, Neither, Agree, Strongly Agree.
Owner Q57: Who owns the residence you live in? You own this house/flat/apartment,
You jointly own this house/flat/apartment with other people, a family trust owns
this house/flat/apartment, parents/other family members or partner own this
house/flat/apartment, a private landlord who is not related to you owns this. . . ., a
local authority or city councils owns. . . ., Housing New Zealand owns . . . .. Other
State landlord owns. . .
Employment Q24: Which of the following best describes your current employment status? By employed I mean you undertake work for pay, profit or other income, or do
any work in a family business without pay. Employed fulltime (for 30 or more hours
per week), employed part time (for less than 30 hours per week), Not in paid employment and looking for work, not in paid employment and not looking for work
(e.g. full-time parent, retired persons).
Enough Q35: Which of the following best describes how well your total income meets
your everyday needs for things such as accommodation, food, clothing and other necessities? Have more than enough money, enough money, just enough money, not
enough money.
Minority Q1: Can you please tell me which ethnic group or groups you belong to?
European, Maori, Samoan (and other non-European).
SafeCC Q13: R4: Now thinking about issues of crime and safety, using a four point
scale ranging from very unsafe, a bit unsafe, fairly safe to very safe, please tell me
how safe or unsafe you would feel in the following situations. In your city centre
during the day.
No rubbish Q17: R1.. Have any of the following been a problem in your city over the
last twelve months? Rubbish or little lying on the streets: yes, no, don’t know.
Conf council Q21r3: Thinking about your local City or District Council. On a scale of
one to five, where one is strongly disagree and [four is agree] and five is strongly agree,
how would you rate the following: R3. Overall, I have confidence that the council
makes decisions that are in the best interests of my city or district.
Source: Quality of Life Team, 2009
REGION : Volume 3, Number 2, 2016
�
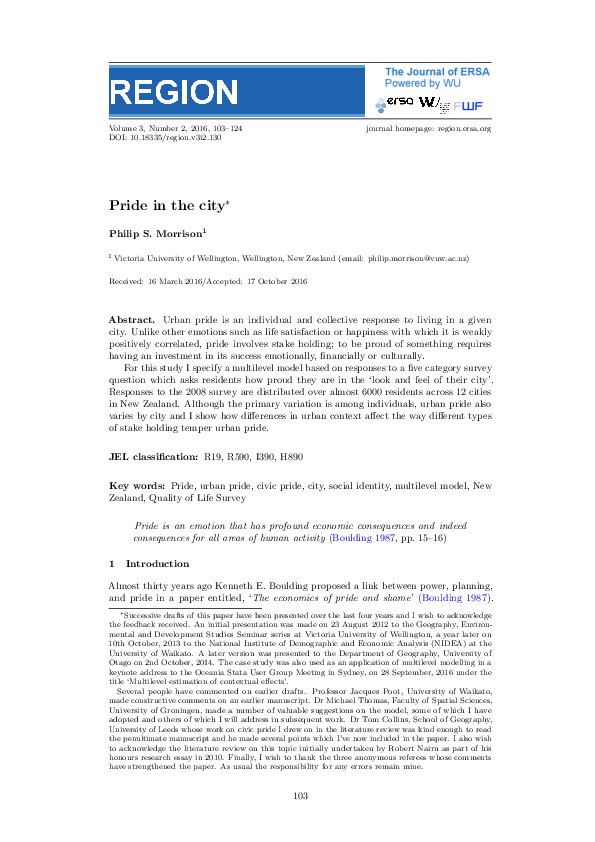
 Philip S Morrison