Original Article
Biomol Ther 25(5), 482-489 (2017)
Regulation of Pharmacogene Expression by microRNA in
The Cancer Genome Atlas (TCGA) Research Network
Nayoung Han1, Yun-Kyoung Song1, Gilbert J. Burckart 2, Eunhee Ji3, In-Wha Kim1,* and Jung Mi Oh1,*
1
College of Pharmacy and Research Institute of Pharmaceutical Sciences, Seoul National University, Seoul 08826, Republic of
Korea, 2Office of Clinical Pharmacology, Office of Translational Sciences, Food and Drug Administration, Silver Spring, Maryland
20993, USA, 3College of Pharmacy, Gacheon University, Incheon 13120, Republic of Korea
Abstract
Individual differences in drug responses are associated with genetic and epigenetic variability of pharmacogene expression. We
aimed to identify the relevant miRNAs which regulate pharmacogenes associated with drug responses. The miRNA and mRNA
expression profiles derived from data for normal and solid tumor tissues in The Cancer Genome Atlas (TCGA) Research Network.
Predicted miRNAs targeted to pharmacogenes were identified using publicly available databases. A total of 95 pharmacogenes
were selected from cholangiocarcinoma and colon adenocarcinoma, as well as kidney renal clear cell, liver hepatocellular, and
lung squamous cell carcinomas. Through the integration analyses of miRNA and mRNA, 35 miRNAs were found to negatively correlate with mRNA expression levels of 16 pharmacogenes in normal bile duct, liver, colon, and lung tissues (p<0.05). Additionally,
36 miRNAs were related to differential expression of 32 pharmacogene mRNAs in those normal and tumorigenic tissues (p<0.05).
These results indicate that changes in expression levels of miRNAs targeted to pharmacogenes in normal and tumor tissues may
play a role in determining individual variations in drug response.
Key Words: Epigenomics, microRNAs, Pharmacogenetics, Neoplasms, The Cancer Genome Atlas
INTRODUCTION
2012). The mRNAs affected by the miRNAs consequently influence susceptibility to cancer, as well as amentia, autoimmune diseases, and diabetes (Sayed and Abdellatif, 2011).
Therefore, miRNAs are becoming recognized as important
mediators that affect drug responses, without affecting the genomic sequence. An increasing number of studies on pharmacoepigenetics and pharamcoepigenomics support a role for
miRNA in regulating expression of genes encoding proteins
involved in drug absorption, distribution, metabolism, and excretion (ADME) (Shomron, 2010; Rukov and Shomron, 2011),
as well as pharmacodynamics (Yu et al., 2016). One miRNA
can regulate various ADME genes via direct and/or indirect
targeting, or one ADME gene may be modulated by multiple
miRNAs (Yu and Pan, 2012). However, our current understanding of miRNA action was mainly obtained from in vitro
cell culture systems and ex vivo systems (Rukov and Shomron, 2011). Moreover, prediction and identification of miRNAs
target genes is a time-consuming, labor-intensive, and errorprone process (Huang et al., 2016).
Pharmacogenomics focuses on how individual genetic
variations influence drug responses, and is helping to develop
safer and more effective treatments for patients (Relling and
Evans, 2015). Many pharmacogenomic studies have concerned single nucleotide polymorphisms (SNPs) that affect
drug responses, and several SNPs have been reported (Georgitsi et al., 2011). However, the diversity of drug responses is
not explained by genetic mutation alone. As well as the genetic polymorphisms, drug response may be different due to
factors that regulate gene expression.
MicroRNAs (miRNAs) are small, ~21 nucleotide singlestrand noncoding RNAs that can regulate gene expression
by binding to partially complementary sites in 3′ untranslated
regions (3′ UTRs) of messenger RNAs (mRNAs). This miRNA-mRNA interaction governs a variety of mechanisms that
control gene expression, including mRNA degradation and
translational repression (Wienholds et al., 2005; Pasquinelli,
Received Jun 11, 2017 Revised Jun 19, 2017 Accepted Jun 26, 2017
Published Online Aug 25, 2017
Open Access https://doi.org/10.4062/biomolther.2017.122
This is an Open Access article distributed under the terms of the Creative Commons Attribution Non-Commercial License (http://creativecommons.org/licenses/by-nc/4.0/) which permits unrestricted non-commercial use, distribution,
and reproduction in any medium, provided the original work is properly cited.
*Corresponding Authors
E-mail: iwkim@snu.ac.kr (Kim IW), jmoh@snu.ac.kr (Oh JM)
Tel: +82-2-880-7736 (Kim IW), +82-2-880-7997 (Oh JM)
Fax: +82-2-766-9560 (Kim IW), +82-2-766-9560 (Oh JM)
www.biomolther.org
Copyright © 2017 The Korean Society of Applied Pharmacology
482
�Han et al. miRNAs for Regulation of Pharmacogenes
Table 1. List of 95 pharmacogenes in this study
Classification
Metabolizing
enzymes
Transporters
Targets/Pathway
gDNA repair
Transcription factor
Miscellaneous
Gene
ADH1A, ADH1B, ADH1C, ALDH1A1, COMT, CYP1A2, CYP2A6, CYP2B6, CYP2C19, CYP2C8, CYP2C9,
CYP2D6, CYP2E1, CYP2J2, CYP3A4, CYP3A5, CYP4F2, DPYD, G6PD, GSTP1, GSTT1, NAT1, NAT2,
POR, SULT1A1, TPMT, UGT1A1
ABCB1, SLC19A1, SLC22A1, SLCO1B1
ABL1, ABL2, ACE, ADRB1, ADRB2, ALK, ALOX5, ASL, ASS1, BCR, BRAF, BRCA1, CFTR, CPS1, CYB5R1,
CYB5R2, CYB5R3, CYB5R4, DRD2, EGFR, ERBB2, F2, F5, FIP1L1, HMGCR, HPRT1, IL28B, IL2RA,
KCNH2, KCNJ11, KIT, KRAS, LDLR, MS4A1, MTHFR, NAGS, NQO1, NRAS, OTC, P2RY12, P2RY1,
PDGFRA, PDGFRB, PGR, PROC, PROS1, PTGIS, PTGS2, SCN5A, SERPINC1, TYMS, VKORC1
POLG
AHR, ESR1, NR1I2, PML, RARA, RYR1, VDR
HLA-A, HLA-B, HLA-DQA1, HLA-DRB1
Color key
10
0
Value
10
Liver and bile duct
Colon
Lung
Kidney
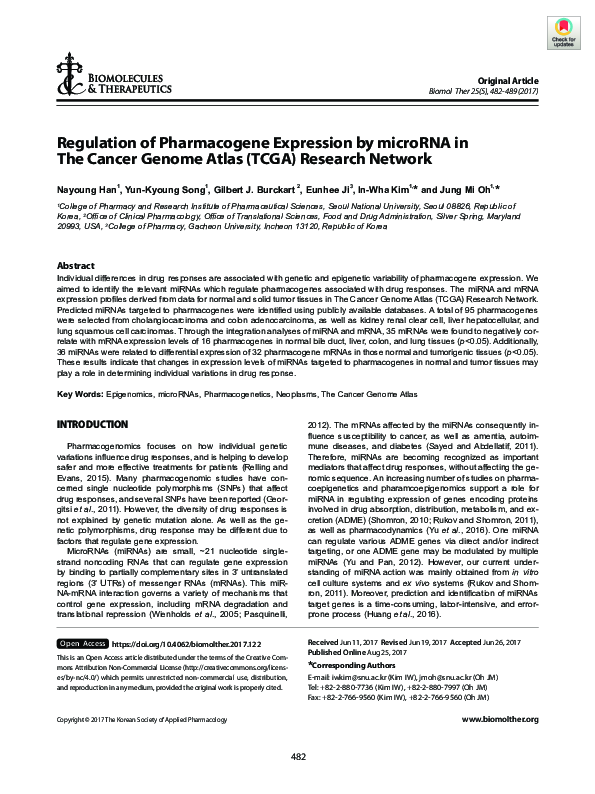
Fig. 1. Heat map representing miRNA levels of normal tissues derived from colon, kidney, liver, and lung cancer patients. The 55 miRNAs
have standard deviations >0.1 across all samples. Each row and column represents a marker and sample, respectively. The clustering dendrogram was drawn using the Ward linkage method.
MATERIALS AND METHODS
This epigenetic regulation of miRNAs in drug transporters
or enzymes has a greater impact on drug responses. The
influence of the epigenetic changes in cancer diseases can
be expected to be even greater. Thus, we hypothesized that
the drug response may be affected by expression changes
of pharmacogenes in patients with cancer, in special, in organs involved in drug metabolism. The Cancer Genome Atlas
(TCGA) Research Network has profiled and analyzed large
numbers of human tumors to discover molecular aberrations
at the DNA, RNA, and protein level, and also examined epigenetic changes, including those related to miRNA (Weinstein
et al., 2013). Because the TCGA also contains a significant
collection of normal tissue samples, it would be an appropriate resource for pharmacogenomic miRNA studies. Tumorinduced miRNA changes are also important in drug responses
and toxicity, especially responses to chemotherapy (Zheng et
al., 2017).
Therefore, the aim of this study was to explore miRNA expression difference in normal tissues derived from patients
with five different cancer types and identify significant miRNAs
regulating pharmacogene expression, using an integrated
analysis of miRNA and mRNA. In addition, we purposed to
assess miRNA expression difference, in special, in tumor tissues compared with normal tissue of cancer patient samples.
miRNA data collection using TCGA datasets
The miRNA data of normal and tumor tissues was downloaded from the TCGA Research Network portal (cancergenome.nih.gov) which dataset was available as of May 2016.
All data for cholangiocarcinoma (CHOL), colon adenocarcinoma (COAD), kidney renal clear cell (KIRC), and lung squamous cell carcinoma (LUSC) samples were collected in the
United States, whereas liver hepatocellular carcinoma (LIHC)
samples originated from patients in the United States, France,
Japan, and China, considering various ethnic backgrounds.
The miRNA sequencing (miRNAseq) data was gathered using
an Illumina® HiSeq 2000 platform at the Michael Smith Genome Sciences Centre (GSC) of the BC Cancer Agency (Vancouver, BC, Canada). From the Illumina® HiSeq RNASeqV2
level 3 dataset, the “normalized_count” (quantile normalized
relative standard error of the mean) value of each miRNA was
collected. The miRNAseq data was integrated in to a matrix
with log2 transformed for the downstream analysis.
Pharamcogenes selection and mRNA data collection
Important pharmacogenomic-related genes were searched
on the Pharmacogenomics Knowledge Base (Klein et al.,
2001). Additional pharmacogenetic genes, derived from the
U.S. Food and Drug Administration (FDA) Table of Pharmacogenomic Biomarkers in Drug Labels (http://www.fda.gov/
483
www.biomolther.org
�Biomol Ther 25(5), 482-489 (2017)
Table 2. Comparisons of miRNA and mRNA expression levels between tumors and normal solid tissues derived from cancer patients*
Number of miRNAs
Number of
patients
Cancer
Cholangiocarcinoma
Colon adenocarinoma
Kidney renal clear cell
Liver hepatocellular carcinoma
Lung squamous cell carcinoma†
Number of mRNAs
Increased
in tumors
Decreased
in tumors
Increased
in tumors
Decreased
in tumors
120
255
182
212
157
82
120
270
168
441
21
8
36
19
26
48
26
45
53
42
9
8
67
48
43†
*Significantly differently expressed miRNAs or mRNAs between tumor tissues and normal solid tissues were determined by paired t-test,
respectively (p<0.05). †The 36 samples had mRNA expression data.
40
30
Dimension 2
20
Bile duct
Kidney
Liver
Lung
Colon
miRNA. We analyzed the correlation between the expression
levels of miRNA and mRNA in normal tissues of cancer samples and found a significant negative correlation. In addition,
the Pearson’s correlation analysis was performed to identify
in tumor specific downregulated miRNA by analyzing the significant association between miRNA and mRNA expression,
and correlation coefficients were calculated with adjustment
for cancer types.
10
0
10
miRNA target prediction
We next matched the significant correlations with target information using TargetScan (Agarwal et al., 2015), miRANDA
(Betel et al., 2008), miRDB (Wong and Wang, 2015), Diana
Tools (Paraskevopoulou et al., 2013), miRMap (Vejnar and
Zdobnov, 2012), and miRNAMap (Hsu et al., 2008) as appropriate. Given that no program was consistently superior to the
others, and that we aimed to minimize the probability of introducing false positives and/or negatives, we selected genes
that were identified by at least three databases as potential
targets (Dai and Zhou, 2010). Data extraction and analyses
were performed using Python version 3.4 (http://www.python.
org/).
20
30
20
10
0
10
20
Dimension 1
Fig. 2. Multidimensional scaling analysis plot of normal tissues
based on miRNA distance.
drugs/scienceresearch/researchareas/pharmacogenetics/
ucm083378.html/), were included. The final phamacogenes
for analysis were selected by eliminating duplicates.
The public sequencing data of mRNA, associated with selected pharmacogenes, was also collected from the TCGA Research Network portal. RNA sequencing (RNASeq) data were
produced by the University of North Carolina (Chapel Hill, NC,
USA) using an Illumina® HiSeq 2000 platform. An mRNAseq
matrix with log-2 transformation was made for downstream
analysis.
Evaluation using GEO dataset
For evaluate with our founding, we collected expression datasets of miRNA and mRNA for tumor and non-tumor tissues
derived from colonic adenocarcinoma (GSE29623) (Chen et
al., 2012) and intrahepatic cholangiocarcinoma and hepatocellular carcinoma patients (GSE57555) (Murakami et al.,
2015).
Comparison of miRNA expression in normal and tumor
tissues
Statistical analysis
All normal and tumor tissues samples were clustered using
a hierarchical method. The clustering dendrogram was drawn
using the Ward linkage method. To plot miRNA expression
data in a heat map, we selected miRNAs that had >0.1 deviations in expression levels across samples. In addition, a distance matrix for miRNA expression variables in normal tissue
samples was constructed using the Euclidean distance and
was visualized by multidimensional scaling (MDS). This step
was implemented using cmdscale in the R statistics software
package.
Differences between the number of miRNAs and mRNA expression in each cancer patient were analyzed by Student’s
t-test. Pairwise comparisons of miRNA expression levels in
normal tissues were analyzed with a paired t-test. Regression
analysis tested whether changes in miRNA expression correlated with mRNA expression after adjusted by tissue types.
All statistical tests were performed in R Statistics version 3.3.2
(http://www.r-project.org/). Statistical significance was defined
as a p-value of less than 0.05. Multiple testing correction was
performed by controlling the false discovery rate (Benjamini
and Hochberg, 1995) at a=0.05.
Correlation analysis of miRNAs and gene expression
We selected only paired data in sold primary tumors and
normal tissues to compare the difference in expression of
https://doi.org/10.4062/biomolther.2017.122
484
�Han et al. miRNAs for Regulation of Pharmacogenes
100
100
-Log10 (p-value)
120
C
LU
KI
C
H
LI
O
H
vs
vs
L
vs
L
O
H
R
SC
C
LU
O
H
LI
vs
L
O
H
C
C
C
C
vs
C
R
KI
vs
C
R
KI
AD
O
C
LI
LU
LI
vs
KI
vs
AD
O
C
H
C
H
C
R
SC
LU
vs
AD
O
C
vs
0
L
0
O
20
SC
20
SC
40
AD
40
60
H
60
80
C
80
C
-Log10 (p-value)
120
Fig. 3. Pairwise comparison of miRNA expression levels in normal tissues. CHOL: cholangiocarcinoma, LIHC: liver hepatocellular cell carcinoma, COAD: colon adenocarcinoma, LUSC: lung squamous cell carcinoma, KIRC: kidney renal clear cell carcinoma.
COAD-KIRC (p=1.79×10-60), KIRC-LUSC (p=9.88×10-55),
COAD-LUSC (p=1.03×10⁻³²), and CHOL-LIHC (p=2.14×10⁻¹¹)
comparisons.
RESULTS
Pharmacogenes selection
Through searching database, 63 genes were selected
and 31 genes were added from FDA table. After adding cytochrome P450 oxidoreductase (POR), a total of 95 genes,
including 30 drug-metabolizing enzymes and 12 transporter
genes, are listed in Table 1.
Correlation of miRNA and mRNA expression in normal
and tumor tissues
The correlation analysis results showed that 23 miRNAs showed a negative correlation between miRNA and
mRNA expression for 14 pharmacogenes (Table 3, Fig. 4),
resulting in 33 combinations of miRNAs and mRNAs. HsamiR-429 decreased 3 mRNA expression levels, including
ADH1B (p=2.48×10⁻²⁴), AHR (p=1.63×10⁻²), and ALDH1A1
(p=1.44×10⁻³). Meanwhile, hsa-miR-181d decreased the expression levels of AHR (p=2.88×10⁻³), BCR (p=6.25×10⁻³), and
CYB5R4 (p=6.30×10⁻³), whereas hsa-miR-152 decreased the
expression levels of ABL2 (p=1.48×10-47), AHR (p=7.44×10⁻⁸),
and CYB5R4 (p=2.24×10-45). Hsa-miR-98 decreased the expression levels of ADRB2 (p=9.13×10⁻¹³).
The correlation analysis results showed that 19 miRNAs
had a negative correlation between miRNA and expression
levels of 15 pharmacogene mRNAs (Table 4, Fig. 5) to yield
24 combinations between miRNAs and mRNAs. Hsa-miR520b (1.59×10⁻³) decreased ADRB1 mRNA expression levels, whereas hsa-miR-152 decreased the expression levels
of ABL2 (p=1.49×10-43), AHR (p=4.06×10⁻¹⁹), and CYB5R4
mRNA (p=1.42×10-49). Hsa-miR-98 decreased the expression
levels of ADRB2 mRNA (p=1.23×10-41).
Comparison of miRNA expression in normal and tumor
tissues
A total of 1,448 samples were downloaded from the TCGA
portal (36 CHOL, 458 COAD, 244 KIRC, 373 LIHC, and 337
LUSC samples). After excluding unpaired data, 1,870 miRNAs remained in 9 CHOL, 8 COAD, 67 KIRC, 48 LIHC, and
43 LUSC primary tumor and paired normal tissue samples.
Through Ward linkage analysis, the samples were clustered
into one of four major groups that each represented a human
tissue (Fig. 1). The number of mRNAs expressed at lower
levels in primary solid tumors was higher than that seen for
normal solid tissues (Table 2). Meanwhile, for KIRC and LUSC
the number of miRNAs expressed at higher levels in primary
solid tumors was lower than that seen for normal solid tissues.
The number of miRNAs having lower expression levels in primary tumor tissues was lower than that for normal tissues in
patients with CHOL, COAD, and LIHC.
Based on assessment of miRNA relationships among the
95 pharmacogenes in different tissues, the overall pattern of
the MDS plot separated the colon, kidney, liver, and lung into
four discrete identities, while bile duct tissues were included
with the liver (Fig. 2). A pairwise comparison of miRNA profiles
between tissues showed that the profile for normal kidney tissues was closer to that seen for normal colon and lung tissues (Fig. 3). miRNA expression profiles for bile duct tissues
were most similar to those for the liver, which differed most
significantly from those seen for the kidney. Of the 1,870 miRNAs analyzed, miR-122 exhibited the greatest differences in
comparisons between KIRC-LIHC, COAD-LIHC, LIHC-LUSC,
CHOL-KIRC, CHOL-LUSC, and CHOL-COAD (p=2.08×10-111,
p=6.98×10-79, p=1.03×10-62, p=3.52×10-44, p=3.17×10-43, and
p=2.04×10⁻¹⁵, respectively). Similarly, miR-450b, miR-375,
miR-590, and miR-26b levels significantly differed among
Evaluation using GEO datasets
Through evaluation using GSE29623 and GSE57555 datasets, Hsa-miR-520b decreased mRNA expression of ADRB1,
while hsa-miR-98 decreased mRNA expression of ADRB2
(p<0.05). Additionally, hsa-miR-152 decreased mRNA expression levels of ABL2 and CYB5R4 (p<0.05).
DISCUSSION
In the present study, we used the integrative analysis to
identify miRNAs that contribute to altered expression of
pharmacogenes in different tissues and tumors. The integrative analysis of mRNA and miRNA expressions is a powerful
485
www.biomolther.org
�Biomol Ther 25(5), 482-489 (2017)
A
Table 3. miRNA expression negatively correlated with pharmacogene
20
Gene
miRNA
Metabolizing ADH1B hsa-miR-429
hsa-miR-577
enzymes
CYB5R4 hsa-miR-152
Receptors
Targets
ADRB1
ADRB2
ABL1
ABL2
ALOX5
Transcription ACE
AHR
factors
hsa-miR-758
hsa-miR-181d
hsa-miR-let-7c
hsa-miR-98
hsa-miR-378g
hsa-miR-152
hsa-miR-107
hsa-miR-217
hsa-miR-410
hsa-miR-134
hsa-miR-511
hsa-miR-152
hsa-miR-181d
hsa-miR-429
hsa-miR-520b
hsa-miR-653
Adjusted
Pearson
correlation
coefficient
(r2)
2.48e-24
2.15e-20
2.24e-45
0.538
0.468
0.812
1.21e-07
6.30e-03
2.39e-05
9.13e-13
1.08e-05
1.48e-47
6.30e-12
1.96e-09
4.19e-04
1.93e-02
3.92e-09
7.44e-08
2.88e-03
1.63e-24
1.22e-03
6.27e-13
0.437
0.361
0.538
0.738
0.377
0.800
0.452
0.323
0.317
0.636
0.529
0.597
0.561
0.643
0.558
0.630
15
10
5
0
0
3
6
9
12
15
12
15
12
15
Log2 (miRNA expression)
B
20
Log2 (mRNA expression)
Classification
FDR
adjusted
p-value
Log2 (mRNA expression)
expression in different normal solid tissues derived from cancer patients
(r2>0.3)
15
10
5
0
0
3
6
9
Log2 (miRNA expression)
C
FDR: false discovery rate.
Log2 (mRNA expression)
20
tool for identifying individual genes and genetic or epigenetic
mechanisms of gene expression, as well as a means to understand the relationship between target genes and downstream
regulation by miRNA (Yang et al., 2016; Ye et al., 2016). miRNA and mRNA pharmacogene expression was analyzed in
paired normal and tumorigenic samples derived from CHOL,
COAD, KIRC, LIHC, and LUSC patients using TCGA data.
The data included 95 pharmacogenes that were selected
for analysis in our study. For LIHC, drug-metabolizing enzymes and transporters are abundantly expressed in both the
liver and bile duct. The colon, kidneys, and lungs are the main
organs involved in the elimination of chemotherapeutic drugs.
Since lung and colorectal cancer are the first and second leading causes of cancer-related deaths worldwide, respectively
(World Health Organization, 2014), patients with these types
of cancer may receive chemotherapy despite the stage-dependence of these drugs.
The United States has announced a research initiative that
aims to accelerate progress toward a new era of precision
medicine that is tailored to individuals (http://www.whitehouse.
gov/precisionmedicine/). Genetic variations and epigenetic
changes between individuals may be related to differences in
drug responses (Dluzen and Lazarus, 2015). Most previous
studies of miRNA in pharmacogenes examined only a limited
number of genes with small sample sizes using traditional
methods (Rieger et al., 2013), such that few global miRNA
analyses of pharmacogene expression have been performed
(Kim et al., 2014). Our results showed that the number of
mRNAs expressed at lower levels in primary solid tumors was
https://doi.org/10.4062/biomolther.2017.122
15
10
5
0
0
3
6
9
Log2 (miRNA expression)
Fig. 4. Correlation of RNA expression and miRNA changes across
normal colon, bile duct, kidney, liver, and lung tissues derived
from cancer patients. Line is fitted to the points. Open circle, bile
duct; closed circle, kidney; open square, liver; closed square,
lung; open triangle, colon (A) correlation of hsa-miR-152 with
ABL2 (p=1.48e-47); (B) correlation of hsa-miR-429 with ADH1B
(p=2.48e-24); (C) correlation of hsa-miR-98 with ADRB2 (p=9.13e-13).
higher than that seen for normal solid tissues, while the number of miRNA expression levels of pharmacogenes varied in
tumor tissues compared to normal tissues. These results indicate that there are considerable differences in the level and
distribution of miRNAs across normal and tumorigenic tissues.
However, as expected, our results showed that miRNA and
mRNA expression levels were similar between liver and bile
duct tissues.
486
�Han et al. miRNAs for Regulation of Pharmacogenes
A
Table 4. miRNA expression negatively correlated with pharmacogene
20
Classification
Adjusted
Pearson
correlation
coefficient
(r2)
hsa-miR-520b
hsa-miR-98
hsa-miR-152
hsa-miR-152
1.59e-03
1.23e-41
1.49e-43
1.42e-49
0.450
0.450
0.482
0.510
Gene
ADRB1
ADRB2
ABL2
Targets
Metabolizing CYB5R4
enzymes
Receptors
miRNA
FDR
adjusted
p-value
Log2 (mRNA expression)
expression in different normal and tumor solid tissues derived from cancer patients (r2>0.3)
15
10
5
0
0
5
10
15
Log2 (miRNA expression)
B
FDR, false discovery rate.
Log2 (mRNA expression)
20
The expression of several drug-metabolizing enzymes and
transporter genes was regulated by miRNAs. For example,
miR-27a and miR-548a repressed mRNA expression levels of
ABCB1 and CYP3A4, respectively (Wei et al., 2014; Messingerova et al., 2016). Although we found negative correlations
of the expression of these miRNAs and mRNAs in our study,
they were excluded because their relationships did not occur
in more than three miRNA target prediction databases.
Nevertheless, we could use the integrative analysis of
massive miRNA-mRNA expression data to identify new various miRNAs for various drug-metabolizing enzyme (ADH1B,
CYB5R4), receptor (ADRB1, ADRB2), target (ABL1, ABL2,
ALOX5) genes, and transcription factor (ACE, AHR) that contribute to their differential expression in bile duct, colon, kidney,
liver, and lung tissues. Expression of hsa-miR-148 and hsamiR-152 was reported to be downregulated in gastrointestinal cancer tissues, suggesting that these two miRNAs may
be involved during the early stage of gastric carcinogenesis
(Chen et al., 2010). The hsa-miR-520 was also decreased in
n colorectal carcinoma when compared with normal colorectal
tissues (Bahar et al., 2017). Associations between these miRNAs and pharmacogenes have not been previously reported.
let-7 family members such as let-7, let-7a, let-7b, let-7c, let-7d,
let-7e, let-7f, let-7g, let-7i, and miR-98 were previously shown
to target ADRB2 (Wang et al., 2011), but to our knowledge this
is the first study to show that hsa-miR-98 can also regulate
ADRB2 expression.
Even with targeted therapy, the response to cancer drugs is
not solely dependent on tumor epigenetics (Nasr et al., 2016).
Moreover, germ line epigenetics can play a role in drug effects. Therefore, understanding and considering the contribution of both somatic and germ line epigenetics is important
when predicting drug response and toxicity.
Recently, there has been a rapid increase in knowledge
of how pharmacogenes are regulated by epigenetic mechanisms and methods to analyze this regulation (Koturbash et
al., 2015). Although we examined a limited set of genes known
to be involved in drug responses, the methodology described
herein can be easily applied to future studies. One limitation of our study is that we did not stratify the data for age,
gender, or racial/ethnic backgrounds, although miRNAs have
been shown to exhibit differences related to these parameters
(Huang et al., 2011; Kwekel et al., 2015). miRNAs regulate
15
10
5
0
5
0
5
10
Log2 (miRNA expression)
C
Log2 (mRNA expression)
20
15
10
5
0
5
0
5
10
15
Log2 (miRNA expression)
Fig. 5. Correlation of RNA expression and miRNA changes across
normal and tumor colon, kidney, liver and lung tissues derived
from cancer patients. Line is fitted to the points. Open circle, bile
duct; closed circle, kidney; open square, liver; closed square, lung;
open triangle, colon (A) correlation of hsa-miR-152 with CYB5R4
(p=1.42e-49); (B) correlation of hsa-miR-98 with ADRB2 (p=1.23e-41)
(C) correlation of hsa-miR-152 with ABL2 (p=1.49e-43).
gene expression by repressing translation and/or by mRNA
deadenylation and decay (Djuranovic et al., 2012). Several
groups demonstrated that protein repression can occur in
the absence of mRNA degradation (Wilczynska and Bushell,
2015), but we did not analyze protein expression levels of the
pharmacogenes targeted in our study. Although there are further challenges to defining the role of miRNA in drug responses, here we identified miRNA-mediated changes in pharmacogene expression that may influence therapeutic responses.
487
www.biomolther.org
�Biomol Ther 25(5), 482-489 (2017)
ics 12, 655-673.
Hsu, S. D., Chu, C. H., Tsou, A. P., Chen, S. J., Chen, H. C., Hsu, P. W.,
Huang, H. D. (2008) miRNAMap 2.0: genomic maps of microRNAs
in metazoan genomes. Nucleic Acids Res. 36, D165-D169.
Huang, J., Gutierrez, F., Strachan, H. J., Dou, D., Huang, W., Smith,
B., Blake, J. A., Eilbeck, K., Natale, D. A., Lin, Y., Wu, B., de Silva,
N., Wang, X., Liu, Z., Borchert, G. M., Tan, M. and Ruttenberg,
A. (2016) OmniSearch: a semantic search system based on the
Ontology for MIcroRNA Target (OMIT) for microRNA-target gene
interaction data. J. Biomed. Semantics. 7, 25.
Huang, R. S., Gamazon, E. R., Ziliak, D., Wen, Y., Im, H. K., Zhang,
W., Wing, C., Duan, S., Bleibel, W. K., Cox, N. J. and Dolan, M. E.
(2011) Population differences in microRNA expression and biological implications. RNA Biol. 8, 692-701.
Kim, I. W., Han, N., Burckart, G. J. and Oh, J. M. (2014) Epigenetic
changes in gene expression for drug-metabolizing enzymes and
transporters. Pharmacotherapy 34, 140-150.
Klein, T. E., Chang, J. T., Cho, M. K., Easton, K. L., Fergerson, R.,
Hewett, M., Lin, Z., Liu, Y., Liu, S., Oliver, D. E., Rubin, D. L., Shafa, F., Stuart, J. M. and Altman, R. B. (2001) Integrating genotype
and phenotype information: an overview of the PharmGKB project.
Pharmacogenetics Research Network and Knowledge Base. Pharmacogenomics J. 1, 167-170.
Koturbash, I., Tolleson, W. H., Guo, L., Yu, D., Chen, S., Hong, H.,
Mattes, W. and Ning, B. (2015) microRNAs as pharmacogenomic
biomarkers for drug efficacy and drug safety assessment. Biomark.
Med. 9, 1153-1176.
Kwekel, J. C., Vijay, V., Desai, V. G., Moland, C. L. and Fuscoe, J.
C. (2015) Age and sex differences in kidney microRNA expression
during the life span of F344 rats. Biol. Sex Differ. 6, 1.
Messingerova, L., Imrichova, D., Kavcova, H., Seres, M., Sulova, Z.
and Breier, A. (2016) A decrease in cellular microRNA-27a content is involved in azacytidine-induced P-glycoprotein expression
in SKM-1 cells. Toxicol. In vitro 36, 81-88.
Murakami, Y., Kubo, S., Tamori, A., Itami, S., Kawamura, E., Iwaisako,
K., Ikeda, K., Kawada, N., Ochiya, T. and Taguchi, Y. H. (2015)
Comprehensive analysis of transcriptome and metabolome analysis in Intrahepatic Cholangiocarcinoma and Hepatocellular Carcinoma. Sci. Rep. 5, 16294.
Nasr, R., Sleiman, F., Awada, Z. and Zgheib, N. K. (2016) The pharmacoepigenetics of drug metabolism and transport in breast cancer:
review of the literature and in silico analysis. Pharmacogenomics
17, 1573-1585.
Paraskevopoulou, M. D., Georgakilas, G., Kostoulas, N., Vlachos,
I. S., Vergoulis, T., Reczko, M., Filippidis, C., Dalamagas, T. and
Hatzigeorgiou, A. G. (2013) DIANA-microT web server v5.0: service integration into miRNA functional analysis workflows. Nucleic
Acids Res. 41, W169-W173.
Pasquinelli, A. E. (2012) MicroRNAs and their targets: recognition,
regulation and an emerging reciprocal relationship. Nat. Rev. Genet. 13, 271-282.
Relling, M. V. and Evans, W. E. (2015) Pharmacogenomics in the clinic. Nature 526, 343-350.
Rieger, J. K., Klein, K., Winter, S. and Zanger, U. M. (2013) Expression variability of absorption, distribution, metabolism, excretionrelated microRNAs in human liver: influence of nongenetic factors
and association with gene expression. Drug Metab. Dispos. 41,
1752-1762.
Rukov, J. L. and Shomron, N. (2011) MicroRNA pharmacogenomics:
post-transcriptional regulation of drug response. Trends Mol. Med.
17, 412-423.
Sayed, D. and Abdellatif, M. (2011) MicroRNAs in development and
disease. Physiol. Rev. 91, 827-887.
Shomron, N. (2010) MicroRNAs and pharmacogenomics. Pharmacogenomics 11, 629-632.
Vejnar, C. E. and Zdobnov, E. M. (2012) MiRmap: comprehensive prediction of microRNA target repression strength. Nucleic Acids Res.
40, 11673-11683.
Wang, W. C., Juan, A. H., Panebra, A. and Liggett, S. B. (2011) MicroRNA let-7 establishes expression of β2-adrenergic receptors
and dynamically down-regulates agonist-promoted down-regulation. Proc. Natl. Acad. Sci. U.S.A. 108, 6246-6251.
In conclusion, epigenomic changes, including miRNA-induced regulation of expression of genes encoding drug-metabolizing enzymes, transporters, or targets, can potentially
lead to changes in drug activity that may contribute to drug
sensitivity, resistance, and toxicity. Here we investigated miRNA using publicly available epigenomic and transcriptomic databases in an effort to advance pharmacogenomics research.
We believe the current analysis will lead to more rapid identification of functional miRNAs that are relevant to understanding
variability in drug responses of cancer patients.
ACKNOWLEDGMENTS
This work was supported by Basic Science Research
Program through the National Research Foundation of
Korea (NRF) funded by the Ministry of Education (2014R1A1A2055734) and NRF grant funded by the Korea government Ministry of Science, ICT and Future Planning (NRF2014M3C1B3064644). We gratefully acknowledge the TCGA
Consortium and all its members for the TCGA Project initiative, for providing samples, tissues, data processing and making data and results available.
DISCLAIMER
The opinions expressed by Dr. Gilbert J. Burckart do not
represent the position of the US Food and Drug Administration.
REFERENCES
Agarwal, V., Bell, G. W., Nam, J. W. and Bartel, D. P. (2015) Predicting effective microRNA target sites in mammalian mRNAs. Elife 4,
e05005.
Bahar, A. Y., Sayar, H., Ulaşlı, M., Bayraktar, R., Kırkbeş, S., Sercan
Şimşek, S. and Arslan, A. (2017) Expression of miR-520-d-3p,
miR-520b, miR-520e are significantly downregulated in locally advanced colorectal carcinoma. Tenn. Med. 2, 11.
Benjamini, Y. and Hochberg, Y. (1995) Controlling the false discovery
rate: a practical and powerful approach to multiple testing. J. R.
Statist. Soc. B. 57, 289-300.
Betel, D., Wilson, M., Gabow, A., Marks, D. S. and Sander, C. (2008)
The microRNA.org resource: targets and expression. Nucleic Acids
Res. 36, D149-D153.
Chen, D. T., Hernandez, J. M., Shibata, D., McCarthy, S. M.,
Humphries, L. A., Clark, W., Elahi, A., Gruidl, M., Coppola, D. and
Yeatman, T. (2012) Complementary strand microRNAs mediate
acquisition of metastatic potential in colonic adenocarcinoma. J.
Gastrointest. Surg. 16, 905-912; discussion 912-903.
Chen, Y., Song, Y., Wang, Z., Yue, Z., Xu, H., Xing, C. and Liu, Z.
(2010) Altered expression of MiR-148a and MiR-152 in gastrointestinal cancers and its clinical significance. J. Gastrointest. Surg.
14, 1170-1179.
Dai, Y. and Zhou, X. (2010) Computational methods for the identification of microRNA targets. Open Access Bioinformatics 2, 29-39.
Djuranovic, S., Nahvi, A. and Green, R. (2012) miRNA-mediated gene
silencing by translational repression followed by mRNA deadenylation and decay. Science 336, 237-240.
Dluzen, D. F. and Lazarus, P. (2015) MicroRNA regulation of the major
drug-metabolizing enzymes and related transcription factors. Drug
Metab. Rev. 47, 320-334.
Georgitsi, M., Zukic, B., Pavlovic, S. and Patrinos, G. P. (2011) Transcriptional regulation and pharmacogenomics. Pharmacogenom-
https://doi.org/10.4062/biomolther.2017.122
488
�Han et al. miRNAs for Regulation of Pharmacogenes
Wei, Z., Jiang, S., Zhang, Y., Wang, X., Peng, X., Meng, C., Liu, Y.,
Wang, H., Guo, L., Qin, S., He, L., Shao, F., Zhang, L. and Xing,
Q. (2014) The effect of microRNAs in the regulation of human CYP3A4: a systematic study using a mathematical model. Sci. Rep.
4, 4283.
Weinstein, J. N., Collisson, E. A., Mills, G. B., Shaw, K. R., Ozenberger, B. A., Ellrott, K., Shmulevich, I., Sander, C. and Stuart, J. M.
(2013) The Cancer Genome Atlas Pan-Cancer analysis project.
Nat. Genet. 45, 1113-1120.
Wienholds, E., Kloosterman, W. P., Miska, E., Alvarez-Saavedra, E.,
Berezikov, E., de Bruijn, E., Horvitz, H. R., Kauppinen, S. and Plasterk, R. H. (2005) MicroRNA expression in zebrafish embryonic
development. Science 309, 310-311.
Wilczynska, A. and Bushell, M. (2015) The complexity of miRNA-mediated repression. Cell Death Differ. 22, 22-33.
Wong, N. and Wang, X. (2015) miRDB: an online resource for microRNA target prediction and functional annotations. Nucleic Acids Res.
43, D146-D152.
World Health Organization (2014) International Agency for Research
on Cancer. World Cancer Report.
Yang, C., Sun, C., Liang, X., Xie, S., Huang, J. and Li, D. (2016) Integrative analysis of microRNA and mRNA expression profiles in
non-small-cell lung cancer. Cancer Gene Ther. 23, 90-97.
Ye, B., Wang, R. and Wang, J. (2016) Correlation analysis of the
mRNA and miRNA expression profiles in the nascent synthetic allotetraploid Raphanobrassica. Sci. Rep. 6, 37416.
Yu, A. M., Tian, Y., Tu, M. J., Ho, P. Y. and Jilek, J. L. (2016) MicroRNA
pharmacoepigenetics: posttranscriptional regulation mechanisms
behind variable drug disposition and strategy to develop more effective therapy. Drug Metab. Dispos. 44, 308-319.
Yu, A. M. and Pan, Y. Z. (2012) Noncoding microRNAs: Small RNAs
play a big role in regulation of ADME? Acta Pharm. Sin. B 2, 93101.
Zheng, N., Yang, P., Wang, Z. and Zhou, Q. (2017) OncomicroRNAsmediated tumorigenesis: implication in cancer diagnosis and targeted therapy. Curr. Cancer Drug Targets 17, 40-47.
489
www.biomolther.org
�
 Nayoung Han