High Resolution Flash Flood Forecasting for the Dallas–Fort
Worth Metroplex
Hamideh Habibi,1 Arezoo Rafieei Nasab,1 Amir Norouzi,1 Behzad Nazari,1 Dong-Jun Seo,1 Ranjan
Muttiah2 and Clair Davis2
1
University of Texas at Arlington, Arlington, Texas;
2
City of Fort Worth, Fort Worth, Texas.
Abstract
Urban flash flooding is a serious problem in large highly populated areas such as the Dallas–Fort Worth metroplex (DFW). Being
able to monitor and predict flash flooding at a high spatiotemporal resolution is critical to mitigating its threats and for
cost effective emergency management. In this work, the prototype high resolution flash flood warning system under de
velopment for DFW is described and a case study of the flash flooding event of 2014-06-24 in Fort Worth presented. The high
resolution (500 m, 1 min) precipitation input comes from the DFW Demonstration Network of the Collaborative Adaptive Sensing
of the Atmosphere (CASA) X-band radars. The hydrologic model used is the National Weather Service Hydrology Laboratory’s
Distributed Hydrologic Model (HL-RDHM) operating at a 500 m resolution. The model simulation results are assessed using the
flooding reports received from residents throughout the event by the City of Fort Worth.
1 Introduction
National Weather Service (NWS) West Gulf River Forecast Center
(WGRFC). The model simulation results are qualitatively assessed
based on the location and timing of local flooding as reported by
the residents of Fort Worth throughout the event.
More than three-quarters of the population of the United States
lives in urban areas that comprise only about 3% of the total land
area. According to the U.S. Census Bureau, the urban population
increased by 12.1% from 2000 to 2010 compared to the overall
population increase of 9.7% for the same period. For the 486 large
urbanized areas, the rate was even higher at 14.3%. Given the
high population density, high resolution observations and modeling capabilities are necessary for the prediction of flash floods in
urban areas. The increasing occurrences of extreme precipitation
expected from the changing climate have put such areas in an
increasingly vulnerable position as even a small but intense rainfall event can cause deadly flash floods and extensive damages.
If effective high resolution prediction and warning capabilities
were to exist for all urban areas, many lives would be saved and
economic losses would be greatly reduced.
2 Study Area and Precipitation Data Used
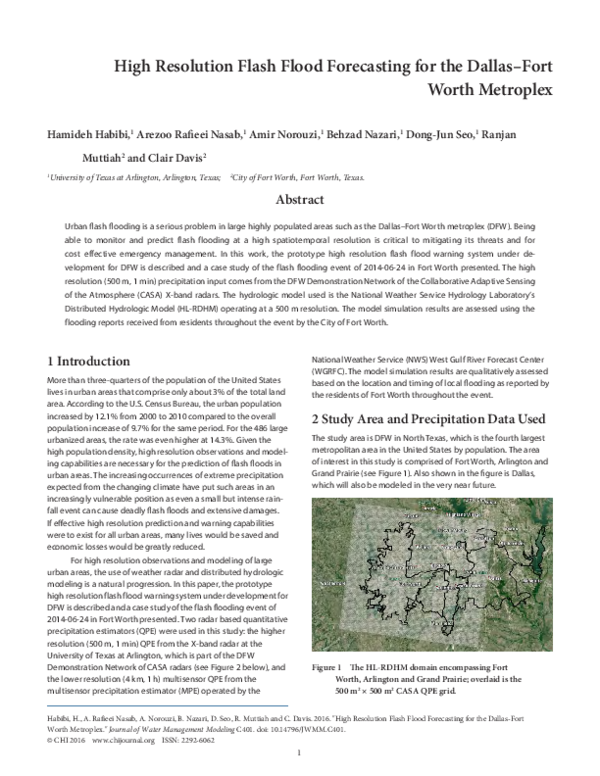
The study area is DFW in North Texas, which is the fourth largest
metropolitan area in the United States by population. The area
of interest in this study is comprised of Fort Worth, Arlington and
Grand Prairie (see Figure 1). Also shown in the figure is Dallas,
which will also be modeled in the very near future.
For high resolution observations and modeling of large
urban areas, the use of weather radar and distributed hydrologic
modeling is a natural progression. In this paper, the prototype
high resolution flash flood warning system under development for
DFW is described and a case study of the flash flooding event of
2014-06-24 in Fort Worth presented. Two radar based quantitative
precipitation estimators (QPE) were used in this study: the higher
resolution (500 m, 1 min) QPE from the X-band radar at the
University of Texas at Arlington, which is part of the DFW
Demonstration Network of CASA radars (see Figure 2 below), and
the lower resolution (4 km, 1 h) multisensor QPE from the
multisensor precipitation estimator (MPE) operated by the
Figure 1 The HL-RDHM domain encompassing Fort
Worth, Arlington and Grand Prairie; overlaid is the
500 m2 × 500 m2 CASA QPE grid.
Habibi, H., A. Rafieei Nasab, A. Norouzi, B. Nazari, D. Seo, R. Muttiah and C. Davis. 2016. "High Resolution Flash Flood Forecasting for the Dallas-Fort
Worth Metroplex." Journal of Water Management Modeling C401. doi: 10.14796/JWMM.C401.
© CHI 2016 www.chijournal.org ISSN: 2292-6062
1
�For precipitation forcing, the QPEs from the MPE (Seo et
al. 2010; Kitzmiller et al. 2011) and from the DFW Demonstration
Network of CASA radars are used. The MPE product, which is
routinely used in operational hydrologic forecasting, is obtained
from WGRFC and has a spatiotemporal resolution of 1 hydrologic
rainfall analysis projection (1 HRAP, approximately 4 km × 4 km)
and 1 h.
One of the limitations of NEXRAD (Next Generation Radar)
data is that they do not observe the lower atmosphere away
from the radar, which causes degradation of spatial resolution
at far ranges. Also, the temporal resolution is constrained by a
fixed set of volume coverage patterns. This lack of resolution
arises because the radar operation is independent of the weather
conditions. To maximize its utility, the radar may adapt to the
time-varying needs of the users (Junyent et al. 2010). To address
these gaps in the current weather observation system, the NSF
Engineering Research Center (ERC) for CASA developed a new
weather warning system based on dense networks of small radars
(McLaughlin et al. 2005) with an adaptive scanning strategy (Junyent et al. 2010). The CASA Integrated Project was the first testbed
of a networked CASA radar system composed of four X-band
radars in Oklahoma. Each radar node was approximately 30 km
distant from the next unit. The details of the radar network hardware and software architectures are described in Junyent et al.
2010. The network was evaluated using rain gauge observations
for a 5 y period which showed a good agreement between radar
QPE and rain gauge observations with a standard deviation of
25% and a bias of 3.7% (Chandrasekar and Cifelli 2012).
Figure 2 The DFW demonstration network (the red circle
indicates the UTA radar coverage).
The spatiotemporal resolution of the QPE from the DFW
Demonstration Network is 500 m and 1 min. The QPE products
include instantaneous rain rate and 1 h and 3 h rainfall accumulations. Recently, comparative evaluation of different radar based
QPE products was carried out based on a limited period of record
of about 1 y (Rafieei Nasab et al. 2014; Rafieei Nasab et al. 2015).
The results show that, in general, the CASA QPE is more accurate
for larger precipitation amounts whereas the MPE estimates are
more accurate for smaller amounts in the study area.
Because CASA QPE is based on a specific differential propagation phase, it is immune to absolute calibration errors (Bringi
and Chandrasekar 2001). Attenuation is a known issue for precipitation estimation using X-band radars (Seo et al. 2010; Berne and
Krajewski 2013). The CASA system uses the network reflectivity
retrieval technique (Chandrasekar and Lim 2008) and the network
based attenuation correction technique (Lim et al. 2011) to mitigate the effects of attenuation. Lim et al. (2011) showed that the
technique works robustly in real time in retrieving attenuation
corrected reflectivity.
3 Hydrologic Model
The distributed hydrologic model used in this work is the
Hydrology Laboratory–Research Distributed Hydrologic Model
(HL–RDHM) developed by the NWS Hydrology Laboratory (HLRDHM 2009; Koren et al. 2004). Koren et al. (2004) showed that
HL–RDHM results are comparable to well calibrated lumped model simulations, and that the former outperform the latter when
spatial rainfall variability is significant. The operational version of
HL–RDHM, the Distributed Hydrologic Model (DHM), is used at
various river forecast centres (RFC) for flash flood and river flood
forecasting.
A network of four CASA X-band radars, the DFW Demonstration Network, has been deployed in the area thus far. Figure 2
shows the radar locations at the University of Texas at Arlington
(UTA), Cleburne, Midlothian and Addison, and their coverage.
The network is expected to expand to seven or eight locations in
2015. Radar QPE from the network is based on:
R =18.15KDP 0.791
For rainfall–runoff modeling, the Sacramento soil moisture
accounting (SAC–SMA) model is used. For routing of hillslope and
channel flows, kinematic wave routing is used. SAC–SMA was first
introduced by Burnash et al. (1973; see Figure 3) and has been
used widely from local to continental scales. SAC–SMA is a conceptual model of the land surface phase of the hydrologic cycle.
It accounts for percolation, soil moisture storage, drainage and
evaporation processes. The model inputs rainfall, evaporation and
snow cover (optional) and outputs runoff to the channel system.
The basic SAC–SMA has sixteen parameters, of which the most
important are given in Table 1.
(1)
where:
R = rain rate (mm/h), and
KDP = specific differential phase (º/km).
2
�are delineated with high accuracy and resolution. In this study, the
percent impervious area maps (PCTIM in Table 1) based on a set of
GIS layers obtained from the Cities of Fort Worth, Arlington and
Grand Prairie are derived (see Table 2). Figure 4 shows the
resulting PCTIM map at a 500 m resolution over the three cities.
Table 2 GIS layers from Fort Worth, Arlington and Grand
Prairie used for estimation of PCTIM.
Map Layer
Building footprint
Impervious cover of commercial
Pavements
Centerline of sidewalk
Centerline of streets
Figure 3
Table 1
Fort Worth
√
√
√
√
−
Arlington
√
−
√
−
−
Grand Prairie
√
√
−
−
√
Schematic of the SAC–SMA model.
SAC-SMA parameters, the units and description.
Parameters
UZTWM
UZFWM
LZTWM
LZFSM
LZFPM
UZK
LZSK
LZPK
PCTIM
ADIMP
RIVA
ZPERC
REXP
PFREE
Units
mm
mm
mm
mm
mm
day-1
day-1
day-1
%
%
%
none
none
%
Description
Upper zone tension water maximum storage
Upper zone free water maximum storage
Lower zone tension water maximum storage
Lower zone free water supplementary maximum storage
Lower zone free water primary maximum storage
Upper zone free water withdrawal rate
Lower zone supplementary withdrawal rate
Lower zone primary withdrawal rate
% permanent impervious area
% area contributing as impervious when saturated
% area affected by riparian vegetarian, streams and lakes
Maximum percolation rate under dry condition
Percolation equation exponent
% of percent going directly to lower zone free water
Figure 4 PCTIM at 500 m resolution within Fort Worth,
Arlington and Grand Prairie.
Hillslope and channel routing in HL–RDHM is performed
using kinematic wave routing (Chow et al. 1988; Koren et al.
2004). HL–RDHM routes runoff through the natural channels
identifiable from the digital elevation model (DEM) by the Cell
Outlet Tracing with an Area Threshold (COTAT) algorithm (Reed
et al. 2002). Within each cell, fast runoff is first routed over conceptual hillslopes, and then the combination of channel inflow
from hillslope routing, slow (i.e. subsurface or ground) runoff and
inflow from upstream cells is routed via channel routing (Koren
et al. 2004). A conceptual hillslope consists of multiple uniform
hillslopes, the number of which depends on the stream channel
density specified for the cell. The conceptual channel that transfers water from one cell to another usually represents the highest
order stream in the cell selected. The cell-to-cell connectivity is
used to transfer water from upstream to downstream cells and to
the basin outlets. For hillslope routing, discharge per unit area of
hillslope (qh) is given (Koren et al. 2004) by:
Koren et al. (2000) and Koren et al. (2003) related the SAC–
SMA parameters with soil properties such as porosity, field capacity and wilting point, and derived a priori settings for a subset
of the SAC–SMA parameters using the U.S. Department of Agriculture’s State Soil Geographic Database (STATSGO) soil texture
data in eleven soil layers.
Anderson et al. (2006) and Zhang et al. (2006) improved the
quality of the a priori parameters by replacing the STATSGO data
with the finer scale Soil Survey Geographic Database (SSURGO).
The a priori grids of the SAC–SMA and kinematic wave routing
parameters are provided by NWS for the continental United
States at a 4 km × 4 km resolution. For modeling at higher resolutions, it is necessary to re-derive the parameters using higher
resolution physiographic data.
Because impervious areas play a very important role in
rainfall–runoff processes in urban areas, it is important that they
qh = 2kq D
3
sh 5 3
h
nh
(2)
�where:
kq = unit transformation coefficient,
D = stream channel density in km-1,
Sh = hillslope slope,
nh = hillslope roughness coefficient, and
h = average depth of water on the hillslope.
For channel routing, the discharge for each cell, Qc, is defined as:
Qc = q0 Aqm
(3)
where:
A = cross sectional area,
q0 = specific discharge (i.e. discharge per unit channel
cross section area), and
qm = exponent in the power-law relationship.
The specific discharge may be evaluated if A and Qc are
known. Mean annual flow may be derived from the mean average
annual runoff data over the continental United States available from
the United States Geological Survey (USGS) (Slack and Landwehr
1992). The wetted channel cross section, A, may be obtained from:
A = Q /V
Figure 5 Maps of specific discharge at different spatial resolutions over the model domain: 4 km (upper left), 2 km (upper right), 1 km (lower left) and 500 m (lower right).
(4)
where:
V = the mean velocity.
The mean velocity may be evaluated using the empirical
equation developed by Jobson (1996):
0.919
⎛ D1.25 g ⎞
Q
a
(5)
⎟⎟ S 0.159
V = 0.094+0.0143⎜⎜
Q
D
⎠
⎝
a
where:
Da = upstream drainage area calculated using the flow
direction and cell size grids,
g = gravitational acceleration, and
S = channel slope.
The two kinematic wave channel routing parameters,
q0 and qm, were derived using the above relationships and the
National Elevation Dataset (NED) with 30 m resolution from the
NHDPlus version 2 dataset (David et al. 2011). Figure 5 opposite
shows the derived specific discharge at different resolutions over
the model domain.
4 Case Study
To assess the performance of the system, the flash flooding event
of 2014-06-24 in Fort Worth is used which 2 in. (5.1 mm) to 3 in.
(7.6 mm) rain fell in just 90 min. The largest rainfall in June since
2007, the rain event was the result of small impulses moving
through the upper level in which disturbances rotated around
the low. The heaviest rain occurred where the boundaries
intersected (Dallas News 2014). Over 3 h in the afternoon of
2014-06-24, Fort Worth fire officials responded to 420 calls. More
than 40 of the calls were high water rescues, >20 were for
downed power lines, and 8 fire calls were made during the
flooding (Fox4 News 2014).
Figure 6 Total precipitation for 2014-06-24: (upper panel)
MPE (1 HRAP, 1 h) and (lower panel) CASA QPE
(1/8 HRAP, 1 min); mm = 25.4 × in.
4
�To warm up the model states, HL–RDHM was run at a
spatiotemporal resolution of 1 HRAP and 1 h using the MPE data
from 1996 to 2014. The model was then run at spatiotemporal
resolution of 1/8 HRAP (~500 m) and 1 min for 2014-06-24, using
CASA QPE and MPE over the domain. For qualitative assessment
of the model results, the flooding reports received by the City of
Fort Worth from the residents throughout the event are used.
Figure 6 shows the total precipitation for 2014-06-24, as observed
by MPE (upper panel) and CASA QPE (lower panel).
As readily seen in Figure 6 above, the higher resolution
CASA QPE presents details much better than the lower resolution
MPE. There are, however, areas in the CASA QPE where rainfall
amounts appear depressed due to attenuation. Note that for this
study the CASA QPE was based only on the radar at the University
of Texas at Arlington (XUTA) located at the center of the radar
um-brella in the lower panel of Figure 6. It is also noted that the
CASA QPE products will soon be based on multiple radars,
thereby greatly mitigating the ill effects of attenuation.
Figure 7 (opposite) and Figure 8 (below) show the hourly
precipitation, hourly runoff and streamflow ending or valid at
16:00 on 2014-06-24, for the MPE and CASA QPE based results respectively. Note that in Figure 8 that CASA QPE is used within the
XUTA umbrella but MPE is used elsewhere.
In Figures 7 and 8, the circles denote the locations of
flooding as reported by the residents. The red circles indicate that
flooding was first reported within the hour ending at 16:00.
Figure 7 shows that most of the reports are located in the areas of
heavy precipitation, and that the runoff and streamflow maps
successfully narrow down the areas where most reports originated. The CASA QPE-forced results in Figure 8, on the other hand,
show the ill effects of attenuation due to the fact that the QPE
is derived only from a single X-band radar. As noted above, the
effects of attenuation are expected to be addressed with network
based QPE.
Comparison of the simulation results in Figures 7 and 8
indicates that higher resolution QPE and modeling improves
location and temporal specificity of flooding threats, and that
high-quality QPE is necessary to benefit from high resolution
modeling.
For the above products to be readily utilized by the users it
is necessary to translate them into easy-to-understand and
actionable information.
Figure 7 Hourly MPE precipitation (upper panel), hourly
MPE-forced runoff (middle panel) and MPE-forced
streamflow in CMS (lower panel), valid at 2014-06-24
16:00; mm = 25.4 × in.
Toward that end, the Threshold Frequency (TF) component
of HL-RDHM (HL-RDHM 2009) will be added to the prototype
system; it will express the streamflow map in terms of return
periods, with which most engineers are familiar. Also, a decision
support component based on indicator cokriging (Brown and Seo
2013; Seo et al. 2010; Seo 1996) is currently under development
to de-lineate areas that are most likely to flood, the results of
which will be reported in the near future.
5
�5 Conclusions
The purpose of this paper is to describe the prototype high
resolution flash flood forecast system under development for
the areas of Fort Worth, Arlington and Grand Prairie in northern
Texas and to qualitatively assess its performance through a case
study of the flash flooding event of 2014-06-24 in Fort Worth.
The hydrologic model used is HL–RDHM developed by the U.S.
National Weather Service operating at a 500 m resolution. The
precipitation input used are the radar QPE at 500 m and 1 min
resolution from the DFW Demonstration Network of CASA radars
and the MPE product operationally produced by the West Gulf
River Forecast Centre with a spatiotemporal resolution of 4 km
and 1 h. The model simulation results are qualitatively assessed
using the flooding reports received from the residents of Fort
Worth throughout the event. The results indicate that higher resolution QPE and modeling improves location and temporal specificity of flooding threats, that high quality QPE is necessary to
benefit from high resolution modeling, and that translation of the
base products into easy-to-understand and actionable information is necessary for decision support of the users. It is expected
that the benefits from high resolution distributed modeling are
larger in large urban areas such that population density is high
and increasing urbanization changes physiography. In such areas,
the impact of climate change may be larger due to changing
hydrologic and hydraulic conditions. The prototype flash flood
prediction system is currently implemented for the spring storm
season of 2015. Deployment of additional sensors and data
collection are also under way and quantitative evaluation based
on larger sample and network-based QPE will be reported in the
near future.
Acknowledgments
This material is based upon work supported by the National
Science Foundation, under IIP grant 1237767 (Brenda Philips,
University of Massachusetts Amherst, principal investigator)
and CCF grant 1442735 (principal investigators: Dong-Jun Seo,
Michael Zink , Xinbao Yu, Zheng Fang, Jean Gao, UTA), and by the
City of Fort Worth. These supports are gratefully acknowledged.
The authors would like to thank Victor Koren (retired), Mike Smith,
Zhengtao Cui and Brian Cosgrove of NWS/OHD for expert help
on HLRDHM; Tom Donaldson (retired), Bob Corby (retired), Paul
McKee, Greg Waller and Greg Story of NWS/WGRFC for providing
various data and support; Tom Bradshaw and Greg Patrick of
NWS/WFO Dallas–Fort Worth for helpful discussions and support;
Seann Reed of NWS/MARFC for expert help on HLRDHM and derivation of routing parameters; Dave Streubel of NWS/APRFC for
sharing experience with high resolution implementation of HLRDHM; Laura Pham of the City of Fort Worth for providing various
GIS data; and Brenda Philips of the University of Massachusetts
Amherst for providing the flood reports.
Figure 8 Hourly CASA precipitation (upper panel), hourly
CASA QPE-based runoff (middle panel), and CASA
QPE-based streamflow in CMS (lower panel) valid at
2014-06-24 16:00; mm = 25.4 × in.
6
�References
Kitzmiller, D., S. V. Cooten, F. Ding, K. Howard, C. Langston, J.
Zhang, H. Moser, Y. Zhang, J. J. Gourley, D. Kim and D. Riley. 2011. “Evolving Multisensor Precipitation Estimation
Methods: Their Impacts on Flow Prediction Using a Distributed Hydrologic Model.” Journal of Hydrometeorology
12: (6) 1414–31.
Anderson, R. M., V. Koren and S. M. Reed. 2006. “Using SSURGO
Data to Improve Sacramento Model A Priori Parameter Estimates.” Journal of Hydrology 320 (1): 103–16.
Berne, A. and W. F. Krajewski. 2013. “Radar for Hydrology: Unfulfilled Promise or Unrecognized Potential?” Advances in
Water Resources 51:357–66.
Koren, V. I., S. M. Reed, M. B. Smith, Z. Zhang and D.-J. Seo. 2004.
“Hydrologic Laboratory Modeling System (HL-RMS) of the
US National Weather Service.” Journal of Hydrology 291:297–
318.
Bringi, V. N. and V. Chandrasekar. 2001. Polarimetric Doppler
Weather Radar: Principles and Applications. Cambridge:
Cambridge University Press.
Koren, V. I., M. B. Smith and Q. Duan. 2003. Use of A Priori Parameter Estimates in the Derivation of Spatially Consistent
Parameter Sets of Rainfall–Runoff Models. Chap 18 in
Calibration of Watershed Models edited by Q. Duan, S.
Sorooshian, H. Gupta, H. Rosseau and R. Turcotte, 239–54.
Washington, DC:American Geophysical Union.
doi:10.1002/9781118665671.ch18.
Brown, J. D. and D.-J. Seo. 2013. “Evaluation of a Nonparametric
Post-Processor for Bias Correction and Uncertainty Estimation of Hydrologic Predictions.” Hydrological Processes
27 (1): 83–105.
doi:10.1002/hyp.9263.
Burnash, R. J. C., R. L. Ferral and R. A. McGuire. 1973. A Generalized
Streamflow Simulation System: Conceptual Modeling for
Digital Computers. US Department of Commerce National
Weather Service and State of California Department of
Water Resources.
Koren, V. I., M. Smith, D. Wang and Z. Zhang. 2000. “Use of Soil
Property Data in the Derivation of Conceptual Rainfall–
Runoff Model Parameters.” Presented at the15th Conference on Hydrology, American Meteorological Society,
January 9–14, 2000, Long Beach, CA, 103-106.
http://www.nws.noaa.gov/oh/hrl/papers/ams/
ams_2000_2.16.pdf.
Chandrasekar, V. and R. Cifelli. 2012. “Concept and Principles of
Rainfall Estimation from Radar: Multi Sensor Environment
and Data Fusion.” Indian Journal of Radio & Space Physics
41:389–402.
Lim, S., V. Chandrasekar, P. Lee and A. P. Jayasumana. 2011. “Real-Time Implementation of a Network-Based Attenuation
Correction in the CASA IP1 Testbed.” Journal of Atmospheric and Oceanic Technology 28:197–209.
doi:10.1175/2010JTECHA1441.1
Chandrasekar, V. and S. Lim. 2008. “Retrieval of Reflectivity in a
Networked Radar Environment.” Journal of Atmospheric and
Oceanic Technology 25:1755–67.
Chow, V. T., D. R. Maidment and L. W. Mays. 1988. Applied Hydrology. New York: McGraw-Hill.
McLaughlin, D. J., V. Chandrasekar, K. Droegemeier, S. Frasier,
K. Kurose, F. Junyent, B. Philips, S. Cruz-Pol and J. Colom.
2005. “Distributed Collaborative Adaptive Sensing (DCAS)
for Improved Detection, Understanding, and Prediction of
Atmospheric Hazards.” Presented at Ninth Symposium on
Integrated Observing and Assimilation Systems for the Atmosphere, Oceans, and Land Surface (IOAS-AOLS), American Meteorological Society. Boston, MA: American Meteorological
Society.
Dallas News. 2014. (http://thescoopblog.dallasnews.
com/2014/06/page/4/).
David, C. H., D. R. Maidment, G.-Y. Niu, Z.-L. Yang, F. Habets and
V. Eijkhout. 2011. “River Network Routing on the NHDPlus
Dataset.” Journal of Hydrometeorology 12:913–34.
Fox4 news. 2014. (http://www.fox4news.com/flash-story/
25860827/flooding-across-tarrant-county-on-tuesday)
HL-RDHM. 2009. Hydrology Laboratory-Research Distributed
Hydrologic Model (HL-RDHM) User Manual v. 3.0.0 (Last
Modified 12/29/09).
http://www.cbrfc.noaa.gov/present/rdhm/RDHM_3_0_0_
User_Manual.pdf ).
Rafieei Nasab, A., A. Norouzi, T. Mathew, D.-J. Seo, H. Chen, V.
Chandrasekar, P. Rees and B. Nelson. 2014. “Comparative
Evaluation of Multiple Radar-Based QPEs for North Texas.”
Presented at the 9th International Symposium on Weather
Radar and Hydrology, April 7–10, 2000 organized by the Environmental and Water Resources Institute of the American
Society of Civil Engineers.
Jobson, H. E. 1996. Prediction of Traveltime and Longitudinal Dispersion in Rivers and Streams. Reston, VA: U.S. Geological Survey. Water Resources Investigations Report 96-4013.
http://pubs.usgs.gov/wri/1996/4013/documents/dispersion.pdf.
Rafieei Nasab, A., A. Norouzi and D.-J. Seo and B. Nelson. 2015.
“Improving High Resolution Quantitative Precipitation
Estimation via Fusion of Multiple Radar-Based Precipitation
Products.” Journal of Hydrology 531 (2): 320–36.
doi:10.1016/j.jhydrol.2015.04.066.
Junyent, F., V. Chandrasekar, D. McLaughlin, D. Insanic and N. Bharadwaj. 2010. “The CASA Integrated Project 1 Networked
Radar System.” Journal of Atmospheric and Oceanic Technology 27:61–78.
doi:10.1175/2009JTECHA1296.1.
Reed, S., V. Koren, Z. Zhang, M. Smith and D.-J. Seo. 2002. “Distributed Modeling for Improved NWS River Forecasts.” In
Hydrologic Modeling for the 21st Century. Proceedings of the
7
�Slack, J. R. and J. M. Landwehr. 1992. Hydro-Climatic Data Network:
A U. S. Geological Survey Streamflow Data Set for the United
States for the Study of Climate Variations, 1874–1988. Reston,
VA: U.S. Geological Survey. Open-File Report 92–129.
http://pubs.usgs.gov/of/1992/0129/report.pdf.
Second Federal Interagency Hydrologic Modeling Conference, July 28–August 1, 2002, Las Vegas, Nevada.
http://acwi.gov/hydrology/mtsconfwkshops/conf_proceedings/second_fihmc_nevada.pdf.
Seo, D.-J. 1996. “Nonlinear Estimation of Spatial Distribution of
Rainfall: An Indicator Cokriging Approach.” Stochastic Hydrology and Hydraulics 10:127–50.
doi:10.1007/BF01581763
Zhang, Z., V. Koren, S. Reed, M. B. Smith and F. Moreda. 2006.
“Comparison of Simulation Results Using SSURGO-Based
and STATSGO-Based Parameters in a Distributed Hydrologic Model.” In Proceedings of the Third Federal Interagency
Hydrologic Modeling Conference April 2–6, 2006, Reno, Nevada.
http://acwi.gov/hydrology/mtsconfwkshops/conf_proceedings/3rdFIHMC/8D_ZhangZi.pdf.
Seo, D.-J., A. Seed and G. Delrieu. 2010. “Radar-Based Rainfall
Estimation.” In Rainfall: State of the Science, edited by F.
Testik and M. Gebremichael, Geophysical Monograph 191,
79–104. Washington, DC: American Geophysical Union.
doi:10.1029/2010GM000952.
8
�
 Dong-jun Seo