Earth and Planetary Science Letters 295 (2010) 195–204
Contents lists available at ScienceDirect
Earth and Planetary Science Letters
j o u r n a l h o m e p a g e : w w w. e l s e v i e r. c o m / l o c a t e / e p s l
A model of degassing for Stromboli volcano
A. Aiuppa a,b,⁎, A. Bertagnini c, N. Métrich c,d, R. Moretti e, A. Di Muro f, M. Liuzzo b, G. Tamburello a
a
CFTA, Università di Palermo, Italy
INGV, Sezione di Palermo, Italy
c
INGV, Sezione di Pisa, Italy
d
LPS, CEA-CNRS, Saclay, France
e
INGV, Sezione di Napoli, Osservatorio Vesuviano, Italy
f
IPGP/UPMR, Paris, France
b
a r t i c l e
i n f o
Article history:
Received 8 January 2010
Received in revised form 29 March 2010
Accepted 30 March 2010
Available online 7 May 2010
Editor: R.W. Carlson
Keywords:
volcanic degassing
Stromboli
volcanic gases
CO2 fluxing
a b s t r a c t
A better understanding of degassing processes at open-vent basaltic volcanoes requires collection of new
datasets of H2O–CO2–SO2 volcanic gas plume compositions, which acquisition has long been hampered by
technical limitations. Here, we use the MultiGAS technique to provide the best-documented record of gas
plume discharges from Stromboli volcano to date. We show that Stromboli's gases are dominated by H2O
(48–98 mol%; mean, 80%), and by CO2 (2–50 mol%; mean, 17%) and SO2 (0.2–14 mol%; mean, 3%). The
significant temporal variability in our dataset reflects the dynamic nature of degassing process during
Strombolian activity; which we explore by interpreting our gas measurements in tandem with the melt
inclusion record of pre-eruptive dissolved volatile abundances, and with the results of an equilibrium
saturation model. Comparison between natural (volcanic gas and melt inclusion) and modelled compositions
is used to propose a degassing mechanism for Stromboli volcano, which suggests surface gas discharges are
mixtures of CO2-rich gas bubbles supplied from the deep (N4 km) plumbing system, and gases released from
degassing of dissolved volatiles in the magma filling the upper conduits. The proposed mixing mechanism
offers a viable and general model to account for composition of gas discharges at all volcanoes for which
petrologic evidence of CO2 fluxing exists. A combined volcanic gas-melt inclusion-modelling approach, as
used in this paper, provides key constraints on degassing processes, and should thus be pursued further.
© 2010 Elsevier B.V. All rights reserved.
1. Introduction
The processes driving the endless degassing activity of openconduit basaltic volcanoes have attracted the attention of volcanologists for decades, and have extensively been studied in recent times
thanks to the advent of more and more sophisticated observation
techniques. One of the most important though often overlooked
aspects of basaltic volcanism is its exceptional gas productivity. The
so-called “excess degassing” (Shinohara, 2008), the fact that basaltic
volcanoes no doubt emit more gas than potentially contributed by
erupted magma, implies an effective gas bubble-melt separation at
some point during the ascent. However, while it is universally
accepted that separate gas transfer exerts a key control on both
quiescent (Burton et al., 2007a) and eruptive (Edmonds and Gerlach,
2007) degassing of basaltic volcanoes, the mechanisms (structural vs.
fluid-dynamic control) and depths (shallow vs. deep) of such gas
separation are still not entirely understood (Edmonds, 2008).
⁎ Corresponding author. CFTA, Università di Palermo, Italy. Tel.: + 39 091 23861624;
fax: + 39 091 6168376.
E-mail address: aiuppa@unipa.it (A. Aiuppa).
0012-821X/$ – see front matter © 2010 Elsevier B.V. All rights reserved.
doi:10.1016/j.epsl.2010.03.040
Volcanic gas investigations have long been hampered by measurement of the most abundant volcanic volatile, water vapour (H2O):
because of the large H2O concentrations in the background atmosphere, volcanic H2O detection using FTIR and solar oscultation is
currently impossible, thus demanding either active (Burton et al.,
2000) or passive (using the magma as the source of radiation; Allard
et al., 2004) measurements. These limitations have long precluded the
acquisition of robust and systematic volcanic gas datasets at openvent volcanoes, thus making degassing processes easier to probe by
studying volatile contents in silicate melt inclusions (MIs) (Blundy
and Cashman, 2008; Métrich and Wallace, 2008). Recently, however,
the MultiGAS technique (Shinohara et al., 2008) has been established
as a cheap and powerful tool for in-situ simultaneous sensing of the
three major volcanogenic components (H2O, CO2 and SO2) in volcanic
gas plumes (Aiuppa et al., 2007). This, combined with recent
developments in H2O–CO2 micro-analysis in silicate materials and
the refinement of thermodynamic saturation codes, now opens the
way to more detailed inspection of degassing processes.
Here, we report on the first MultiGAS measurements including
H2O of the volcanic gas plume of Stromboli, an active basaltic volcano
in Southern Italy (Fig. 1). Stromboli, world-known for its mild and
uninterrupted Strombolian activity (Rosi et al., 2000), is an ideal
�196
A. Aiuppa et al. / Earth and Planetary Science Letters 295 (2010) 195–204
Fig. 1. A map of Stromboli showing the location of the permanent MultiGAS on Pizzo Sopra la Fossa.
target for the modelling of degassing processes, since (i) the
persistent open-vent gas emissions are relatively easy to measure
(Allard et al., 2008), (ii) the mechanisms driving the persistent
Strombolian activity of the volcano and the related seismicity are well
characterised (Ripepe et al., 2008), (iii) the petrology of the magmas is
intensively studied (Bertagnini et al., 2008), and (iv) clear experimental evidence exists for an efficient gas-melt separation in the
plumbing system (Burton et al., 2007b). In spite of this existing
knowledge, the structure of the deep and shallow plumbing system is
still a matter of debate (Métrich et al., 2010; Pichavant et al., 2009),
and information of volcanic gas compositions is still fragmentary,
particularly for H2O. In the attempt to provide a comprehensive model
of degassing, we integrate here our volcanic gas observations with
recent determinations of volatile contents in melt inclusions (Métrich
et al., 2010); and we compare the natural (volcanic gas and MI) data
with results from the Moretti and Papale (2004) equilibrium
saturation model, which we use to numerically reproduce the
degassing trends of Stromboli's magmas upon their ascent and
decompression. This combined volcanic gas-melt inclusion-thermodynamic approach finally leads to thorough characterization of
degassing processes at Stromboli volcano, with general implications
for all basaltic volcanism. Our focus is on the routine Strombolian
activity, making our study complementary to recent work (Métrich
et al., 2010; Allard, 2010) on the genetic mechanisms of the
Stromboli's large scale explosions.
2. Stromboli volcano
The persistent Strombolian activity, for which the volcano is
famous, began after the 3rd–7th centuries AD, and since then has
continued without significant breaks or variations (Rosi et al., 2000).
The current activity takes place at three main craters located in a NE–
SW elongated area (the crater terrace) at about 750 m a.s.l. within the
Sciara del Fuoco, a deep horse-shoe depression resulting from several
lateral collapses (Fig. 1). A variable number of vents (5–15) sustain
the typical activity, consisting of intermittent mild explosions lasting
few seconds (4–30 s), and with a typical frequency of 13 events/
h (Ripepe et al., 2008). The activity is highly variable over timescales
of hours and days, and ranges from ash-dominated eruptions to bursts
throwing incandescent scoriae and bombs. Emitted products attain
heights of a few tens up to hundreds of meters and usually fall in the
vicinity of the craters. Explosive activity is associated with a
continuous “passive” streaming of gas from the crater area and with
active degassing (“puffing”) originating from discrete small gas
bursts, every 1–2 s.
This routine activity is sporadically interrupted by more energetic
explosive events (paroxysms) in which the ejecta fallout reaches the
volcano slopes and settled areas along the coast in the largest
eruptions. Paroxysms are impulsive events consisting of several
explosions from different craters, associated with the ejection of large
ballistic blocks and the emission of vertical jets of gas and pyroclasts
evolving in short-lived convective columns. A peculiar feature of
paroxysms is the co-emission of a nearly aphyric basaltic pumices
along with the “usual” crystal-rich scoria (Bertagnini et al., 2003).
Effusive phases also occur on Stromboli, on average every 4 years
since 1888. Lava flows are usually related to overflows from the
craters or vent opening inside the Sciara del Fuoco. The last effusive
episode occurred from 27 February to 2 April 2007, and emitted
∼107 m3 of lava. During the lava effusion, a paroxysmal eruption also
occurred (on 15 March), which erupted a significant amount of
basaltic pumice (Landi et al., 2009).
During July–December 2008 (the period over which the volcanic
gas measurements are reported here), the volcano showed its typical
activity, with rhythmic Strombolian explosions of variable energy at
�197
A. Aiuppa et al. / Earth and Planetary Science Letters 295 (2010) 195–204
an average frequency of 10–15 events/h (see open-file reports at
www.ct.ingv.it). On September 7, December 6 and 17, three slightly
more energetic events occurred.
3. Technique
The volcanic gas measurements reported here were carried out
from July to December 2008, using the permanent MultiGAS installed
on the summit of Stromboli by Istituto Nazionale di Geofisica and
Vulcanologia (Sezione di Palermo). This fully-automated instrument
has been used for routine measurements of CO2 and SO2 concentrations in Stromboli's plume since 2006 (Aiuppa et al., 2009 report on
principles of operation, and on CO2/SO2 plume ratios in the period
from May 2006 to December 2007). In order to measure H2O, and
improve further the quality of CO2 and SO2 detection, we used in this
study an updated MultiGAS configuration, and more specifically a LI840 NDIR closed-path spectrometer for both CO2 (measurement
range, 0–3000 ppm; accuracy, ±1.5%) and H2O (measurement range,
0–80 ppt; accuracy, ±1.5%) (see Shinohara et al., 2008 for details);
and a sensitive electrochemical sensor (model 3ST/F, Cod.TD2D-1A,
City Technology Ltd., calibration range, 0–30 ppmv; repeatability 1%)
for SO2. Signals from both sensors were captured every 9 s from a
data-logger board, which also enabled data logging and storage. After
a cycle of 200 measurements, lasting 1800 s in total, a radio link
operated automatic data transfer from the remote MultiGAS to the
base station in Palermo, where data were elaborated.
Four measurement cycles were operated daily. However, because
the instrument is located ∼150 m S–SE of the crater terrace (Fig. 1),
plume gas sensing was only possible when moderate to strong winds
from the northern quadrants blew on the island. In contrast when the
plume was gently lofting, rising vertically, or being dispersed north,
the MultiGAS consistently detected the typical H2O (13,000–
18,000 ppm), CO2 (∼380 ppm), and SO2 (b0.1 ppm) concentrations
in background air, and the cycle was considered null (e.g., no ratio was
calculated from the data). In addition, volcanic H2O detection was
limited to relatively dry and cloud-free conditions on Stromboli's
summit (when the plume was not condensing), and in situations
Fig. 2. An example of a 1800 s MultiGAS acquisition at Stromboli (acquisition frequency,
9 s). Whilst small erratic variations of H2O concentrations are typically measured when
the plume is condensing (curve a), more systematic variations (curve b) are observed in
dry weather conditions and when the plume fumigates the Pizzo Sopra la Fossa area.
These are correlated with variations of CO2 (curve c) and SO2 (curve d) concentrations.
In such circumstances, volcanic H2O was derived from the raw data (b) by subtracting
background air H2O content; this required fitting a polynomial function (shown as a
dotted line) to H2O measurements for which a SO2 content of nearly 0 was consistently
detected.
when the plume was dense enough for volcanic H2O to be
distinguished from background variations (Fig. 2). In summary, whilst
a record of CO2/SO2 ratios was achieved on a nearly daily basis,
simultaneous detection of the 3 species was only attained 124 times
during the record period (Table 1). Accuracy and precision on the
Table 1
Compositions of Stromboli's volcanic gas plume (in mol%). We derive compositions for
both the bulk plume (essentially contributed by persistent passive degassing) and the
syn-explosive plume (the gas jet of a Strombolian explosion, reaching the MultiGAS a
few seconds after the burst, and before being diluted in the main plume).
Date
H2O
CO2
SO2
Date
H2O
CO2
SO2
Bulk plume
24/7/08
25/7/08
27/7/08
28/7/08
29/7/08
30/7/08
31/7/08
1/8/08
3/8/08
4/8/08
5/8/08
6/8/08
7/8/08
8/8/08
9/8/08
10/8/08
11/8/08
13/8/08
14/8/08
17/8/08
18/8/08
20/8/08
23/8/08
25/8/08
29/8/08
31/8/08
1/9/08
2/9/08
5/9/08
6/9/08
7/9/08
7/9/08
7/9/08
7/9/08
7/9/08
8/9/08
9/9/08
9/9/08
10/9/08
11/9/08
11/9/08
12/9/08
12/9/08
13/9/08
13/9/08
15/9/08
15/9/08
16/9/08
16/9/08
16/9/08
17/9/08
0.91
0.91
0.95
0.89
0.94
0.95
0.97
0.97
0.97
0.83
0.97
0.81
0.87
0.97
0.98
0.85
0.97
0.98
0.96
0.91
0.94
0.72
0.98
0.98
0.90
0.86
0.95
0.96
0.93
0.95
0.78
0.96
0.91
0.97
0.88
0.73
0.89
0.86
0.75
0.93
0.74
0.64
0.91
0.95
0.97
0.90
0.77
0.81
0.88
0.60
0.89
0.06
0.07
0.03
0.08
0.04
0.04
0.02
0.02
0.02
0.07
0.02
0.13
0.12
0.03
0.02
0.11
0.02
0.02
0.03
0.07
0.04
0.25
0.02
0.02
0.09
0.10
0.02
0.03
0.05
0.05
0.15
0.04
0.05
0.03
0.10
0.24
0.10
0.13
0.22
0.05
0.16
0.34
0.08
0.04
0.03
0.09
0.21
0.17
0.11
0.31
0.06
0.03
0.02
0.02
0.03
0.02
0.02
0.01
0.01
0.01
0.10
0.01
0.06
0.01
0.01
0.01
0.04
0.01
0.01
0.01
0.03
0.01
0.03
0.01
0.01
0.01
0.05
0.03
0.01
0.02
0.00
0.07
0.01
0.04
0.00
0.02
0.03
0.01
0.01
0.03
0.02
0.10
0.02
0.01
0.01
0.00
0.01
0.02
0.02
0.01
0.09
0.04
17/9/08
21/9/08
22/9/08
25/9/08
25/9/08
26/9/08
26/9/08
29/9/08
29/9/08
3/10/08
4/10/08
4/10/08
5/10/08
5/10/08
5/10/08
8/10/08
12/10/08
12/10/08
13/10/08
14/10/08
15/10/08
17/10/08
17/10/08
25/10/08
31/10/08
4/11/08
7/11/08
8/11/08
11/11/08
11/11/08
11/11/08
18/11/08
19/11/08
19/11/08
22/11/08
22/11/08
23/11/08
26/11/08
27/11/08
1/12/08
6/12/08
7/12/08
7/12/08
7/12/08
7/12/08
9/12/08
10/12/08
12/12/08
17/12/08
24/12/08
24/12/08
0.81
0.56
0.93
0.72
0.78
0.56
0.82
0.59
0.79
0.48
0.75
0.96
0.70
0.80
0.82
0.89
0.93
0.95
0.89
0.90
0.83
0.77
0.86
0.75
0.79
0.80
0.83
0.68
0.55
0.80
0.54
0.89
0.91
0.77
0.90
0.65
0.49
0.78
0.64
0.71
0.54
0.72
0.65
0.90
0.60
0.63
0.58
0.59
0.78
0.80
0.85
0.16
0.38
0.07
0.26
0.19
0.39
0.17
0.39
0.19
0.47
0.19
0.04
0.27
0.17
0.15
0.10
0.06
0.04
0.08
0.09
0.16
0.20
0.13
0.22
0.19
0.17
0.15
0.27
0.31
0.17
0.38
0.10
0.07
0.19
0.07
0.30
0.41
0.19
0.28
0.26
0.39
0.23
0.28
0.07
0.34
0.34
0.35
0.34
0.20
0.16
0.13
0.02
0.06
0.01
0.02
0.04
0.05
0.01
0.02
0.02
0.05
0.05
0.01
0.03
0.03
0.03
0.01
0.02
0.01
0.02
0.02
0.01
0.03
0.02
0.03
0.02
0.03
0.02
0.06
0.14
0.03
0.08
0.01
0.02
0.03
0.03
0.04
0.10
0.03
0.08
0.03
0.07
0.05
0.07
0.03
0.06
0.04
0.07
0.07
0.02
0.04
0.02
Syn-explosive gas
27/7/08
0.66
2/8/08
0.88
7/9/08
0.88
13/9/08
0.86
15/9/08
0.72
15/9/08
0.77
16/9/08
0.72
17/9/08
0.83
17/9/08
0.58
23/9/08
0.71
29/9/08
0.49
0.31
0.12
0.11
0.14
0.27
0.23
0.25
0.16
0.41
0.28
0.50
0.03
0.00
0.01
0.00
0.01
0.01
0.02
0.01
0.01
0.01
0.01
4/10/08
6/10/08
12/10/08
14/10/08
15/10/08
27/10/08
11/11/08
19/11/08
4/12/08
7/12/08
12/12/08
0.83
0.59
0.87
0.78
0.85
0.72
0.60
0.70
0.71
0.67
0.65
0.16
0.39
0.12
0.21
0.15
0.28
0.36
0.27
0.28
0.31
0.34
0.01
0.02
0.01
0.01
0.01
0.01
0.04
0.02
0.01
0.02
0.01
�198
A. Aiuppa et al. / Earth and Planetary Science Letters 295 (2010) 195–204
sensors was periodically checked (every 2 moths) using standard gas
mixtures and a dew point generator (for H2O).
4. Results
4.1. Raw data and calculation of volcanic gas composition
Fig. 2 shows an example of 1-cycle acquisition from the permanent
MultiGAS at Stromboli. When the plume was condensing, H2O
concentrations varied smoothly and randomly during the 1800 s
acquisition period (curve a), precluding any retrieval. In contrast,
larger variations of H2O concentrations (curve b) were captured in the
optimal conditions (dry weather conditions, plume fumigating the
area of Pizzo Sopra la Fossa, see Fig. 1), which were broadly correlated
with time variations of CO2 (curve c) and SO2 (curve d). In these
circumstances, the temporal changes of concentrations reflected
variable extents of dilution of volcanic gases in the background
atmosphere upon plume dispersal (due to changes in plume travelling
speed and direction, or changes in source strength).
From the raw plume concentration data (in ppm), the volcanic gas
plume H2O/SO2 and H2O/CO2 ratios were derived by calculating the
gradients of the best-fit regression lines in H2O vs. SO2 and H2O vs. CO2
scatter plots (Fig. 3), as previously reported for Etna (Shinohara et al.,
2008). Then, the (air-free) composition of volcanic gases (in mol%;
Table 1) was finally calculated by combing together each suit of gas
concentration ratios, and normalizing to 100%. This assumes that
contributions from undetected species (e.g., H2, H2S, HCl) are
relatively minor.
While plume ratios were generally relatively constant within each
measurement cycle (e.g., R2 of best-fit regression lines were normally
N0.7, and standard deviations of the derived ratios ≤25%), brief but
significant variations of the ratios were sometimes observed (Fig. 4).
Visual observations and cross correlations of our dataset with seismic
and thermal signals (available at http://www.ct.ingv.it) indicated that
such short-term variations (generally lasting less than 2 min)
systematically occurred soon after individual Strombolian bursts.
We therefore suggest they reflect our measurements capturing of the
composition of the syn-explosive gas phase (e.g., the gas jet released
during the short-lived Strombolian explosions). When the wind was
particularly strong and explosive activity high, this syn-explosive gas
phase, known to be compositionally distinct from the quiescent
plume (Burton et al., 2007b), eventually reached the instrument (a
few seconds after the explosion) before being diluted (and homogenised) within the bulk plume. Our data support further the earlier
conclusions of Burton et al. (2007b), demonstrating that the synexplosive gas phase is significantly richer in CO2 (and poorer in H2O
and SO2) than the bulk plume (Fig. 4 and Table 1). The latter is mainly
contributed by (quiescent) passive degassing in between the explosions, and by puffing activity at the open vents (Ripepe et al., 2008).
Fig. 3. Scatter diagram of H2O vs. SO2 and H2O vs. CO2 concentrations acquired during 1
measurement cycle. The H2O/SO2 and H2O/CO2 plume ratios are calculated from the
gradient of the best-fit regression lines.
Fig. 4. High-resolution (9 s) record of (a) plume ratios and (b) CO2 concentrations,
showing the contrasting compositions of the passive and syn-explosive gas plume
emissions. In the most favourable conditions (strong winds blowing from the N), a
Strombolian explosion (grey arrow labelled “EXP”) is followed (with a time-lag of a few
seconds) by a brief (lasting a few minutes) but significant increase of CO2
concentrations and CO2/SO2 ratios detected by the MultiGAS. The syn-explosive gas
phase is typically H2O-poorer (and CO2-richer) than the passive plume released in
between explosions (this contribution by far dominating Stromboli's bulk plume
emissions in the long-term).
4.2. The H2O–CO2–SO2 composition of Stromboli's plume
Ignoring minor components, Stromboli's gas composition is
dominated by H2O (48–98 mol%; mean, 80%), CO2 (2–50 mol%;
mean, 17%) and SO2 (0.2–14 mol%; mean, 3%) (Table 1). As such,
they resemble quite closely the typical composition of volcanic gases
from arc-settings, though sharing with nearby Etna (Shinohara et al.,
2008) a characteristic of CO2-enrichment (most volcanic gases from
arc basaltic volcanoes have N90% H2O; Shinohara, 2008).
Stromboli's syn-explosive gas phase is richer in CO2 (11–50%;
mean 26%) and poorer in H2O (48–88%; mean, 73%) than the bulk
plume passively released by the volcano's open vents in between the
explosions (mean CO2 and H2O, 15 and 82%, respectively) (Table 1).
Our measurements of the syn-explosive gas phase are in qualitative
agreement with previous determinations (CO2 19–33%; H2O 64–79%;
Burton et al., 2007b), and thus confirm further the bimodal nature of
the emission chemistry at Stromboli.
The most striking feature of the dataset is the large spread of
plume compositions observed in only 6 months of observations. This
is clearly shown in Fig. 5, where H2O/CO2 and CO2/SO2 ratios show a
distinct antithetic behaviour: the syn-explosive gas phase is characterised by high CO2/SO2 ratios (N10, and as high as 47) and low H2O/
CO2 ratios (b6, but typically between 1 and 3); while the bulk plume is
Fig. 5. In a H2O/CO2 vs. CO2/SO2 scatter plot, Stromboli's plume gas emissions are shown
to range from CO2-rich to H2O-rich. The syn-explosive (black circles) and quiescent
(open circles) plumes have distinct compositions, with some overlap. Grey circles are
FTIR-sensed gas compositions for Strombolian explosions (Burton et al., 2007b). Curves
labelled “Mixing lines” are calculated as described in the caption of Fig. 8, and in
Section 5.2.
�A. Aiuppa et al. / Earth and Planetary Science Letters 295 (2010) 195–204
generally characterised by lower (b15) CO2/SO2 ratios and higher
H2O/CO2 ratios (1.5–65). Note that virtually all H2O-rich (H2O/CO2
ratios N30) bulk plume compositions have low (b6) CO2/SO2 ratios.
The same diagram highlights however that syn-explosive and bulk
plume compositions are somewhat overlapping, and that the bulk
plume can be substantially CO2-richer (but also more H2O rich) than
previously measured (representative CO2/SO2 and H2O/CO2 ratios of
∼ 8 and ∼6 were previously quoted for the bulk plume, respectively;
Burton et al., 2007b). The results are in agreement with the large
variation of the bulk plume CO2/SO2 ratio (range, 0.9–26) observed in
a 19 months period encompassing the recent February–April 2007
effusive eruption of Stromboli (Aiuppa et al., 2009); including the
detection of an exceptionally CO2-rich plume (CO2/SO2 up to 26)
before the onset of the eruption, and prior to the paroxysm on March
15, 2007.
5. Discussion
The striking range of volcanic gas compositions at Stromboli
suggest dynamic magma degassing processes at this open-vent
volcano. Indeed, whilst some persistently degassing volcanoes display
an apparent stability in both activity state and volcanic gas
composition for years (e.g., Nyiragongo, Sawyer et al., 2008),
Stromboli shares with nearby Etna (Aiuppa et al., 2007) a timechanging nature of both volcanic activity state and volcanic gas
composition.
Remarkable short-period (seconds) variations in volcanic gas
compositions at Stromboli were first documented based on highfrequency FTIR measurements (Burton et al., 2007b); these demonstrated that the volcanic gas phase released during the short-lived
Strombolian explosions are richer in CO2 (and poorer in Cl) than the
bulk (quiescent) plume. Since CO2 is significantly less soluble in
basaltic melts than H2O, S, and Cl, and thus deeply exsolved, it was
concluded that the gas slugs feeding Strombolian explosions have a
relatively deep provenance (0.8–2.7 km below the summit vents).
This deep source area also supported the idea of a separate ascent of
gas and melt in the shallow (less than 2.7 km) plumbing system, as
also proposed for other basaltic systems (Edmonds and Gerlach,
2007). Our measurements here extend further the conclusions of
Burton et al. (2007b): the temporal variability of the composition of
the bulk (quiescent) plume requires the existence of a complex
degassing regime in which a separate gas ascent plays a key role
(Pichavant et al., 2009). Visual observations suggest that the bulk
Stromboli's plume is essentially contributed by both quiescent
(passive) gas release from the magma ponding at the crater terrace'
open vents, and by small bursts of over-pressurised gas pockets at the
magma-free atmosphere (Harris and Ripepe, 2007). It follows then
that the most obvious source for the bulk gas emissions would be
degassing of volatiles dissolved in the magma filling the upper
conduits, and ultimately the high porphyricity (HP) magma ponding
at the open vents, and erupted as scoriae during Strombolian
explosions. However, the variable composition of the bulk plume,
and its recurrent CO2-rich signature (see Fig. 5) are not consistent
with this hypothesis: the HP magma is volatile-poor (see Sections 5.1
and 5.2 below), and its degassing upon decompression (followed by
near-surface gas separation) cannot produce a gas phase with a CO2/
SO2 ratio greater than ∼0.5–1 (see Section 5.3 below), which is
substantially lower than observed (Fig. 5).
In order to model the source processes controlling the chemistry of
Stromboli's volcanic gases, we combine in the sections below the
record of pre-eruptive volatile contents in Stromboli's magma, as
derived from MI analysis (Section 5.1), with the results of numerical
simulations carried out using the Moretti and Papale (2004)
saturation model (Section 5.2). These calculations allow quantitative
reproduction of the evolving composition of the gas phase released by
Stromboli's magmas upon their storage and ascent within the crust.
199
Finally, comparison between modelled and observed volcanic gas
compositions (Section 5.3) offers new clues on volcanic degassing
processes, and on the structure of the magmatic plumbing system of
Stromboli.
5.1. Melt inclusion record of magma ascent and degassing
There is consensus (Bertagnini et al., 2008) that two magma types
are involved in the present-day Stromboli's activity. The emission of
nearly aphyric highly vesicular pumice during paroxysmal eruptions
highlights the existence of a low porphyritic (LP), volatile-rich HK
basalt magma residing in the deep volcano plumbing system (Fig. 6).
Dissolved CO2 and H2O contents (0.15–0.2 and 2.5–3.5 wt.%, respectively; Fig. 7a) in olivine-hosted basaltic melt inclusions (MIs) were
used (Métrich et al., 2010) to show that the LP magma is stored in a 7–
10 km deep reservoir (equivalent to 190–260 MPa pressure) (all
depths are below the summit vents, bsv). The LP magma is thought to
coexist with a substantial (∼2 wt.%) fraction of CO2-rich gas bubbles
at reservoir conditions (Burton et al., 2007a,b). Observations on
erupted pumices strongly suggest that, prior to a paroxysm, the LP
magma is rapidly decompressed, maintaining virtually unchanged his
“deep” petrological (Métrich et al., 2010) and textural (Polacci et al.,
2009) properties.
The persistent behaviour of the volcano implies that a supply of
deeply derived magmas must occur not only prior to/during a
paroxysm, but also during the normal Strombolian activity (yet at a
slower rate). However, since the LP magma is only erupted during
high energy explosive activity, while a volatile-poor shoshonitic
basalt (the HP magma) feeds the normal Strombolian activity, a
mechanism leading to LP to HP magma transition must “normally”
take place somewhere in the plumbing system. According to melt
inclusion record (Métrich et al., 2010), ascending LP magmas
undertake an extensive water loss in the 2–4 km bsv depth range
(equivalent to 50–100 MPa pressure), with H2O decreasing to
b1.5 wt.%. This has three main implications and consequences:
(i) first, de-hydration of a magma can be caused by fluxing with
deep-rising CO2-rich gas (Spilliaert et al., 2006), a fact which is
suggestive of the presence of a magma ponding zone at 2–4 km
bsv, where CO2-rich gas bubbles accumulate to contents N5 wt.
% (Métrich et al., 2010). An intermediate magma ponding zone
at Stromboli is also supported by geodetic data (Bonaccorso et
al., 2008);
(ii) secondly, for the magma to become extensively de-hydrated, it
is required that gas bubbles escape from this ponding zone, a
fact which might be favoured by the presence of a geological
discontinuity (the interface between volcanic rocks and the
basement lies at about 2.4–3.5 km depth; Di Roberto et al.,
2008), and/or promoted by vesicularity of the magma reaching
a critical threshold for gas percolation (and permeable gas
flow) (Burton et al., 2007a). Whatever the cause, magma dehydrated thus implies gas-melt separation (and thus transition
to open-system degassing regime) at 2–4 km bsv depth;
(iii) finally, de-hydration of the stored magmas raises their liquidus
temperatures, hence promoting extensive crystallization
(Métrich et al., 2001, 2010; Di Carlo et al., 2006), and ultimately
leading to transition from the LP to the H2O poor (b1.5 wt.%;
Fig. 7a) and crystal-rich (30–50%) HP magma (Fig. 6). The
highest dissolved volatiles contents in MIs from the plagioclase-bearing HP magma (Fig. 7a) indicate entrapment pressures of ∼ 50–100 MPa pressure (Métrich et al., 2010),
confirming that a change from closed- to open-system
degassing regime (with the consequent water depletion
being the trigger for transition from LP to HP magma) occurs
in the 2–4 km bsv depth range.
�200
A. Aiuppa et al. / Earth and Planetary Science Letters 295 (2010) 195–204
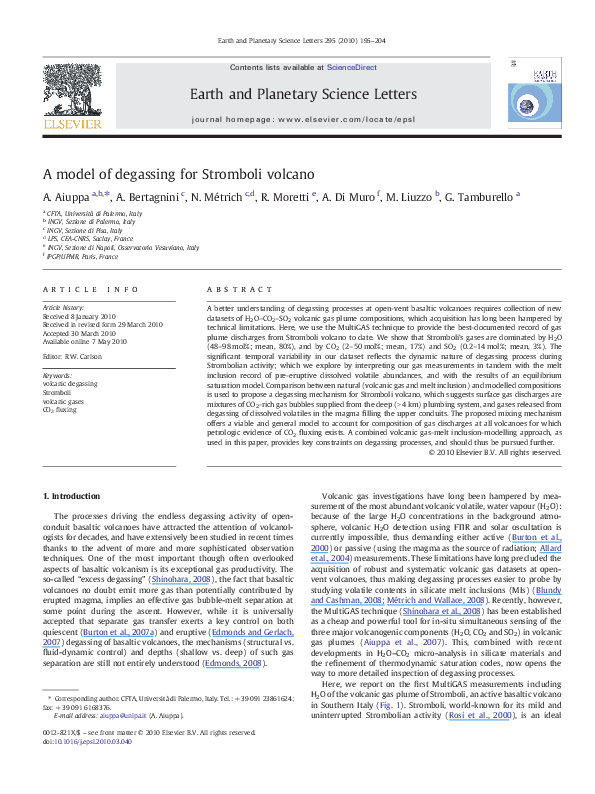
Fig. 6. Schematic cross-section showing the main features of Stromboli's crustal plumbing system (modified from Métrich et al., 2010). See text for discussion.
The contrasting compositions, volatile contents, and depth of
storage of LP and HP magmas (Table 2) imply that the magmatic gas
phases in equilibrium with (and separated from) these two magma
types are inevitably different, as calculated below.
5.2. Numerical modelling
Volatile contents in MIs (Table 2) are used here to initialize model
calculations of volatile partitioning between the magmatic gas phase
and the melt, which we performed using the code described in
Moretti and Papale (2004). This code allows calculating the volatile
(C–H–O–S system) equilibrium composition of coexisting magmatic
vapour and silicate melt at a given set of pressure and temperature
conditions.
In this study, we utilised the code to perform two sets of
complementary calculations. In a first set of model runs (hereafter
referred as LP runs), we calculated the composition of the magmatic
gas phase in equilibrium with Stromboli's LP magma, in a range of
pressure conditions representative of the deep plumbing system. LP
runs were initialised with the input parameters summarised in
Table 2. All LP runs were carried out by stepwise decreasing pressure
from an initial value of 300 MPa (the deepest roots of the plumbing
system probed by MIs) down to 100 MPa (the entrapment pressure of
the most volatile-depleted MIs or glass embayments in LP magmas;
Fig. 7a). The model results are critically dependent on the choice of the
total (exsolved + dissolved) magma CO2 content: four sets of LP runs
were thus carried out at different CO2 contents (0.2, 2, 5 or 20%,
respectively), to account for the presence of a non-negligible (but
poorly constrained) fraction of CO2-rich gas bubbles at reservoir
conditions. While a 2 wt.% CO2 content is supported by gas budget
computations (Allard et al., 2008; Allard, 2010), an even higher (5 wt.
%) content is consistent with melt inclusion evidences (Métrich et al.,
2010); the run at 20% CO2 content should only be viewed as an endmember composition calculation (and not an authentic representation of the natural case).
The second set of model runs (referred as HP runs) attempted at
calculating the composition of the magmatic gas phase in equilibrium
with Stromboli's HP magma. The input parameters of HP runs
(Table 2) were adapted to fit at best conditions prevailing in the
shallowest part of the plumbing system. The highest entrapment
pressure (∼ 100 MPa) derived from volatile contents in MIs (Table 2)
was taken as the starting pressure of our simulations, followed by
step-wise pressure decrease in first closed-system to then opensystem conditions. Transition from closed- to open-system conditions
was fixed at 50 MPa (or ∼ 2 km bsv), the pressure at which
vesicularity of the HP magma is thought to become high enough for
gas percolation through a network of inter-connected bubbles to
occur (Burton et al., 2007a). As discussed before (cfr. 5.1), opensystem degassing may prevail from even deeper (to as deep as 4 km
bsv, or 100 MPa pressure); sensitivity tests made with different
(deeper) closed-open transition depths demonstrated however a
minor effect on the degassing trends.
5.2.1. Model results, and comparison with natural data
The outputs of model calculations are, for each run and at each
pressure, the equilibrium volatile compositions of coexisting melt and
vapour phases. These are contrasted against natural (MIs and volcanic
gas) data in Figs. 7 and 8, respectively. Our model results are
�A. Aiuppa et al. / Earth and Planetary Science Letters 295 (2010) 195–204
Fig. 7. Volatile abundances in Stromboli's melt inclusions and glass embayments
contrasted against results of the saturation model. Data from Métrich et al. (2001, 2005,
2009) and Bertagnini et al. (2003). (a) H2O vs. CO2; (b) H2O vs. S. The grey solid lines are
model results from LP runs 1–4, whilst black dashed lines show model results from HP
runs 5–6. Comparison of natural and modelled compositions confirms that the deep
(P N 100 MPa) LP magma contains a high (2–5 wt.%; model curves 2–3) fraction of gas
bubbles at reservoir conditions. Glass embayment formed at P ∼ 100 MPa are H2Opoorer than predicted by model curves 2–3, suggesting some extent of gas fluxing with
CO2-rich gas bubbles. This triggers de-hydratation of the LP magma, and probably
controls transition to HP magma. The same process likely occurs also in the upper
conduit system (compare model trends 5–6 with volatile abundances in HP magmas).
In a, isobars are traced under a fixed Fe2/Fetot ratio of 0.24 (Table 2), and are thus
slightly different than those originally reported by Métrich et al. (2010) (who, yet using
the same saturation model, used a constant ΔNNO value, thus yielding variable Fe2/Fe3
proportions depending on melt composition, and water particularly).
qualitatively similar to the pressure-related model degassing trends
presented by Allard (2010) (see his Fig. 3), which were yet based on
the use of different saturation model and assumptions.
Fig. 7a and b reveal a reasonable agreement between modelled
dissolved volatile contents in melt and measured H2O–CO2–S
abundances in MIs and glass embayments. The plots demonstrate
that model runs 2–3 are those showing the best fitting with MI data
(squares), suggesting that the LP magma may actually coexist at
reservoir conditions with a significant (2–5 wt.%) fraction of CO2-rich
gas bubbles (Allard et al., 2008). Glass embayments (triangles)
provide a snapshot of the decompression path of the LP magma
shortly prior to a paroxysm (Métrich et al., 2010), and are
201
substantially more volatile-depleted than melt inclusions: their
H2O-poor compositions (Fig. 7a), with most samples trapped in the
150–50 MPa pressure range plotting to the left of curves 2–3, support
re-equilibration of the melt with an even larger (N5 wt.%) proportions
of CO2-rich gas bubbles. As such, the volatile compositions of glass
embayments may reflect gas-melt interactions within the CO2-rich
intermediate (2–4 km deep) magma ponding zone (cfr. 5.1). Finally,
we observe that modelled compositions from HP runs are reasonably
consistent — though richer in H2O — with MI record. The apparent
H2O-depletion captured by MIs (relative to model curves) is an hint
for that magma fluxing by CO2-rich gas bubbles (leading to magma
de-hydration) has a major impact on magma resident in the upper
conduit, as observed elsewhere (Collins et al., 2009). Modelled
dissolved sulphur contents (Fig. 7b) are also consistent with MI
record, and again support a mechanism of progressive increase of the
TOT
COTOT
ratio from trends 1 to 4. We also observe that, at the
2 /H2O
given redox conditions and COTOT
contents, sulphur starts exsolving at
2
high pressure (Fig. 7b), thus accompanying water loss. All degassing
H2O–S trends converge to a common rectilinear path in the H2Odepleted (b1 wt.%) range.
The fair agreement between modelled and natural compositions,
observed in Fig. 7, supports the computational capabilities of the code,
and therefore provides confidence of the calculated composition of
the magmatic gas phase. Our model results, summarised in Fig. 8,
indicate that a CO2-rich magmatic gas phase coexists with the LP
magma over its entire 300–100 MPa decompression path (curves 1–
4). At the reservoir pressure of ∼ 210 MPa, the most likely source area
for LP magmas erupted on the most recent (15th March 2007)
paroxysm (Métrich et al., 2010), the calculated H2O/CO2 and CO2/SO2
ratios for the modelled magmatic gas are in the range 0.5–0.95 and
176–363, respectively (depending on run conditions). These modelled gas compositions for the LP runs are therefore more CO2 rich
than our measured volcanic gas compositions (Fig. 8). We note
however that some of the richest CO2 volcanic gas data are consistent
with model gas compositions calculated at P = 100–120 MPa in the LP
= 0.2 wt.%; Fig. 8).
model run 1 (COTOT
2
As for the HP run results, the calculated pressure-dependent
evolution of the magmatic gas phase released by decompressing HP
magmas is shown in Fig. 8 by curves 5 and 6. The diagram shows an
evident shift in calculated gas compositions, from CO2-rich at high
pressure (100 MPa) to H2O-rich (and CO2-depleted) at low pressure
(0.1 MPa). The latter compositional trends partially overlap the range
of measured volcanic gas compositions (Fig. 8).
5.3. A model of degassing for Stromboli volcano
Our model calculations above provide a quantitative background
for interpreting the source processes controlling the time-changing
composition of Stromboli's volcanic gases. Based on the model results,
we propose that two main gas contributions sustain the persistent
surface gas discharges of the volcano.
To start with, MI determinations (cfr. 5.1) and gas measurements
(Burton et al., 2007a,b, and this study) offer ample evidence for that
the shallow Stromboli's plumbing system is fluxed by the ascent of
CO2-rich gas bubbles. This mechanism of CO2 fluxing is consistent
with the mantle to deep-crustal CO2 exsolution in basaltic systems,
and has been unambiguously supported at several volcanic systems
by recent textural (Rust et al., 2004), melt inclusion (Johnson et al.,
2008), and volcanic gas (Shinohara et al., 2008) studies. At Stromboli,
in particular, the separate ascent of CO2-rich gas bubbles plays a key
control on magma de-hydration in the 0–4 km depth range (e.g., for
P b 100 MPa), and is as such the trigger for the LP to HP magma
transition in the intermediate (2–4 km) magma ponding zone (Fig. 6).
The composition of the deep-rising CO2-rich gas bubbles will be
dependent on the depth on their separation from (and thus last
equilibration with) the silicate melt. In the most extreme conditions,
�202
A. Aiuppa et al. / Earth and Planetary Science Letters 295 (2010) 195–204
Table 2
List of input parameters of model runs. LP runs simulate isothermal closed system ascent of LP magmas (melt composition data Métrich et al., 2010) within their storage zone (300–
190 MPa pressure range), and upon shallow emplacement (down to 100 MPa). Redox conditions along the decompression path were fixed by the Fe2+/Fe3+ buffer, for which we
adopted the value of 3.4. This choice is based on XANES determinations on a hydrous (H2O = 2.9 wt.%) LP magma melt inclusion (Bonnin-Mosbah et al., 2001), but is also consistent
with the olivine-liquid iron and magnesium partition observed in a large set of Stromboli MIs (Bertagnini et al., 2003). The resulting logfO2 conditions range from 0.07 to 0.82 NNO
(NNO is the Nickel–Nickel Oxide buffer). Note that while MI compositions can be taken as good proxies for total (exsolved + dissolved) water and sulphur contents (then evaluated
as H2OTOT: 3.4 wt.%; STOT: 0.16 wt.%, respectively), LP magmas were probably already saturated with a CO2-rich gas phase when the most primitive MIs formed. If such, the highest
measured dissolved CO2 content (∼0.2 wt.%; see Fig. 7a) in MIs would significantly underestimate CO2TOT. Four separate LP runs (with different CO2TOT contents; these should be
viewed as CO2 concentrations in the magma, i.e., in the melt plus gas suspension) were thus carried out. As for HP runs, we considered a shoshonitic melt with total CO2, H2O, and S
contents of 0.04, 1.2 and 0.1 wt.%, respectively (as from representative compositions of MIs in olivines from erupted HP products; Métrich et al., 2010). The recurrent observation of a
sulphide immiscible liquid phase in MIs suggests that the HP magma is potentially in a more reducing redox state than the LP magma; we therefore performed model runs at both
NNO at NNO-1 redox conditions. For both LP and HP runs, melt composition data are from Métrich et al. (2010).
T
(K)
P
(MPa)
Degassing mode
Redoxa
(ΔNNO)
H2OTOT
wt.%
LP runs
1
1423
Decompression from 300 to 100
Closed system
0.07 ÷ 0.82 (Fe3+/Fetot = 0.24)
2
1423
Decompression from 300 to 100
Closed system
0.07 ÷ 0.82 (Fe3+/Fetot = 0.24)
Run ID
3
4
1423
1423
Decompression from 300 to 100
Closed system
COTOT
2
wt.%
STOT
wt.%
Melt composition
3.4
0.2
0.16
SiO2 TiO2 Al2O3 FeOtot
51.6 0.9 16.2 8.42
MgO CaO Na2O K2O
6.64 10.6 2.5 1.9
MgO CaO Na2O K2O
6.64 10.6 2.5 1.9
MgO CaO Na2O K2O
6.64 10.6 2.5 1.9
MgO CaO Na2O K2O
6.64 10.6 2.5 1.9
3.4
2
0.16
0.07 ÷ 0.82 (Fe
3+
3.4
5
0.16
3+
3.4
20
0.16
/Fetot = 0.24)
Decompression from 300 to 100
Closed system
0.07 ÷ 0.82 (Fe
HP runsb
5
1383
Decompression from 100 to 0.1
Closed system from 100 to 50 MPa;
open system from 50 to 0.1
−1
1.2
0.04
0.1
6
Decompression from 100 to 0.1
Closed system from 100 to 50 MPa;
open system from 50 to 0.1
0
1.2
0.04
0.1
1383
/Fetot = 0.24)
SiO2 TiO2 Al2O3 FeOtot
52.6 1.7 15.6 11.27
MgO CaO Na2O K2O
3.27 7.41 3.7 4.2
MgO CaO Na2O K2O
3.27 7.41 3.7 4.2
a
NNO refers to the nickel–nickel oxide buffer.
A note of caution should be spent on the application of the H2O–CO2 model (Papale et al., 2006) on shoshonitic composition. This model is in fact highly sensitive on Fe2+/Fe3+
partition, hence fO2. Only few data with known experimental oxygen fugacity were available for model calibration, then limiting the accuracy of predictions on those iron-rich melt
compositions for which CO2 solubility and H2O–CO2 saturation data were missing, such as shoshonites. Standard deviations of model binary interaction terms show maximum values
for iron oxides, because they encompass all uncertainties on fO2 conditions within the calibration dataset (Papale et al., 2006). As such, the high range of entrapment pressures for HP
MIs reported here, estimated at 100 MPa, can be decreased down to 80 MPa when adopting NNO-1 redox conditions.
b
the CO2-rich gas bubbles may be thought to be sourced by the deep
(7–11 km deep) LP magma storage zone; though partial gas-melt reequilibration at shallower depths (and particularly upon gas bubble
accumulation within — before leakage from — the intermediate 2–
4 km deep magma ponding zone) cannot be ruled out.
Secondly, there is supporting evidence at Stromboli for that
continuous magma convection takes place within the shallow
(b1 km) dyke system (Harris and Stevenson, 1997). This degassingdriven process (Shinohara, 2008) occurs in response to the sinking of
the degassed (non-erupted) HP magma back into the conduit, and its
replacement with ascending vesicular (and thus less-dense) magma
blobs. The shallow convective overturning of the HP magma obviously
gives rise to a second source of volatiles: degassing of dissolved
volatiles in the ascending HP magma will produce gas bubbles which
pressure-dependent compositional evolution is best described by
curves 5 and 6 in Fig. 8. According to the figure, the composition of this
shallow gas contribution will be dependent on the final depth
(pressure) of magma ascent in the upper conduits; assuming nearsurface magma ascent and gas separation, the HP gas would
correspond to the modelled gas composition calculated at 0.1 MPa
in HP runs 5–6.
In the light of this dual gas origin at Stromboli, we therefore
consider a mechanism in which surface gas discharges are produced
in the following manner. CO2-rich gas bubbles are persistently
supplied to the shallow plumbing system by degassing (and gasmelt separation) in the LP magma storage zone. We take the
calculated magmatic gas composition for the LP run 2 at the reservoir
pressure of ∼ 210 MPa as representative of this rising CO2-rich vapour
phase. We then make the guess that the rising gas bubbles mix, upon
their ascent, with gases released by degassing of dissolved volatiles in
the shallow HP magma. Taking the modelled gas composition at
0.1 MPa (from HP runs 5 and/or 6) as representative of this shallow
gas contribution, we obtain the mixing lines drawn in Figs. 5 and 8.
Fig. 5, in particular, demonstrates a fair agreement between the model
mixing lines and the compositional trends shown by our volcanic gas
measurements. From this, we therefore conclude that a time-variable
but persistent supply of deeply derived CO2-rich gas bubbles, mixing
in variable proportions with gases derived from the shallow HP
reservoir, is a sound mechanism to generate Stromboli's surface gas
discharges; and we calculate that LP gas contributions to the mixture
of 6–40% (∼20% as time average) well account for the temporal range
of our gas compositions. If this interpretation is correct, an increase in
CO2 proportions (relative to H2O and SO2) in gas discharges at
Stromboli should be taken as sign of increasing deep gas supply
relative to the shallow gas contribution, and thus possibly as
precursory sign of LP magma degassing prior to paroxysm (Aiuppa
et al., 2009).
6. Conclusions
The MultiGAS volcanic gas observations presented here show
that, in spite of the relatively uniform activity and petrology of
erupted solid materials, Stromboli shares with other basaltic
volcanoes an exceptional variability in gas compositions. The
mechanisms controlling such time-changing nature of Stromboli's
gas emissions have been explored by combining gas measurements
with the MI record of volatile abundance in magmas, and by
contrasting natural compositions with model results derived with
an equilibrium saturation code. From this, we propose that the
compositional features of Stromboli's quiescent and syn-explosive
gas emissions result from the mixing of gases persistently sourced by
(i) degassing of dissolved volatiles in the porphyric magma filling the
�A. Aiuppa et al. / Earth and Planetary Science Letters 295 (2010) 195–204
Fig. 8. Gas-phase model results summarised in a H2O/CO2 vs. CO2/SO2 scatter plot. The
grey solid lines show modelled gas compositions in LP runs 1–4 over the 300–100 MPa
pressure range. Black dashed lines illustrate model results of the evolution of the
magmatic gas phase formed by decompression (100–0.1 MPa pressure range) of the HP
magma (HP runs 5–6). The curves labelled “Mixing lines” simulate mixing of CO2-rich
gas bubbles in equilibrium with the LP magma at 210 MPa (LP run 2) with the gas phase
produced by degassing of dissolved volatiles in the HP magma at 0.1 MPa (runs 5–6).
The dashed area marks the field of measured gas compositions. The black square
symbol labelled “bulk HP magma degassing” represents the hypothetical composition
of the gas phase produced via closed system (bulk) degassing of the HP magma upon
decompression from 100 to 0.1 MPa. Clearly, this is CO2-poorer than our observed gas
compositions. A zoom on the comparison between measured and modelled gas
compositions is given in Fig. 5.
upper (b1 km) dyke-conduit system; and (ii) CO2-rich gas bubbles,
originated at depth (at depths N4 km, or P N 100 MPa) in the
plumbing system. Both gas contributions are persistent and concur
to determine gas discharges, and the temporal fluctuations in their
source strengths (which may reflect the simultaneous action of a
number of factor, such as changes in magma convection rate or gas
content, and/or a structural/tectonic control on the rate of gas bubble
supply from depth) are at the base of the striking variability in
Stromboli's gas emissions; with phases of increasing supply of deeprising gas bubbles reflecting into CO2-enriched signatures of surface
emissions, potentially being precursory to large scale deeply-sourced
paroxysms.
The proposed mixing mechanism is constrained by independent
petrologic and model data, and it is geologically straightforward since
it only requires a persistent but time-modulated source of deep gas
bubbles; this however does not exclude that additional control
mechanisms on volcanic gas composition might be at work. We
conclude however that, since magma fluxing by a free CO2-rich
vapour phase is a recurrent process, the proposed degassing
mechanism is probably a key to interpret volcanic gas observations
at many basaltic volcanoes.
Acknowledgements
This manuscript has benefited from the valuable comments of two
anonymous reviewers and the editor (R.W. Carlson). S. Gurrieri, G.
Giudice and the INGV staff are acknowledged.
References
Aiuppa, A., Moretti, R., Federico, C., Giudice, G., Gurrieri, S., Liuzzo, M., Papale, P.,
Shinohara, H., Valenza, M., 2007. Forecasting Etna eruption by real time evaluation
of volcanic gas composition. Geology 35 (12), 1115–1118 doi:10.1130/G24149A.
Aiuppa, A., Federico, C., Giudice, G., Giuffrida, G., Guida, R., Gurrieri, S., Liuzzo, M.,
Moretti, R., Papale, P., 2009. The 2007 eruption of Stromboli volcano: insights from
real-time measurements of the volcanic gas plume CO2/SO2 ratio. J. Volcanol.
Geoth. Res. 182, 221–230.
203
Allard, P., 2010. A CO2-rich gas trigger of explosive paroxysms at Stromboli basaltic
volcano, Italy. J. Volcanol. Geoth. Res. 189, 363–374.
Allard, P., Burton, M., Muré, F., 2004. Spectroscopic evidence for a lava fountain driven
by previously accumulated magmatic gas. Nature 433, 407–410 doi:10.1038/
nature03246.
Allard, P., Aiuppa, A., Burton, M., Caltabiano, T., Federico, C., Salerno, G., La Spina, A.,
2008. Crater gas emissions and the magma feeding system of Stromboli volcano. In:
Calvari, S., Inguaggiato, S., Puglisi, G., Ripepe, M., Rosi, M. (Eds.), Learning from
Stromboli: AGU Geophysics Monograph Series, 182, pp. 65–80. Washington DC.
Bertagnini, A., Métrich, N., Landi, P., Rosi, M., 2003. Stromboli an open window on the
deep feeding system of a steady state volcano. J. Geophys. Res. 108 (B7), 2336
doi:10.1029/2002JB002146.
Bertagnini, A., Métrich, N., Francalanci, L., Landi, P., Tommasini, S., Conticelli, S., 2008.
Volcanology and magma geochemistry of the present-day activity: constraints on
the feeding system. In: Calvari, S., Inguaggiato, S., Puglisi, G., Ripepe, M., Rosi, M.
(Eds.), Learning from Stromboli: AGU Geophysics Monograph Series, 182, pp.
19–38. Washington DC.
Blundy, J., Cashman, K., 2008. Petrologic reconstruction of magmatic system variables
and processes. Rev. Mineralog. Geochem. 69, 179–239.
Bonaccorso, A., Gambino, S., Guglielmino, F., Mattia, M., Puglisi, G., Boschi, E., 2008.
Stromboli 2007 eruption: deflation modeling to infer shallow-intermediate
plumbing system. Geophys. Res. Lett. 35, L06311 doi:10.1029/2007GL032921.
Bonnin-Mosbah, M., Simionovici, A.S., Métrich, N., Duraud, J.P., Massare, D., Dillmann, P.,
2001. Iron oxidation states in silicate glass fragments and glass inclusions with a
XANES micro-probe. J. Non-Cryst. Solids 288, 103–113.
Burton, M.R., Oppenheimer, C., Horrocks, L.A., Francis, P.W., 2000. Remote sensing of
CO2 and H2O emission rates from Masaya volcano, Nicaragua. Geology 28 (10),
915–918.
Burton, M.R., Mader, H.M., Polacci, M., 2007a. The role of gas percolation in quiescent
degassing of persistently active basaltic volcanoes. Earth Planet. Sci. Lett. 264,
46–60.
Burton, M.R., Allard, P., Muré, F., La Spina, A., 2007b. Magmatic gas composition reveals
the source depth of slug-driven strombolian explosive activity. Science 37,
227–230.
Collins, S.J., Pyle, D.M., Maclennan, J., 2009. Melt inclusions track pre-eruption storage
and dehydration of magmas at Etna. Geology 37, 571–574 doi:10.1130/G30040A.1.
Di Carlo, I., Pichavant, M., Rotolo, S., Scaillet, B., 2006. Experimental crystallization of a
high-K arc basalt: the Golden Pumice, Stromboli Volcano (Italy). J. Petrol. 1–27
doi:10.1093/petrology/egl011.
Di Roberto, A., Bertagnini, A., Pompilio, M., Gamberi, F., Marani, M.P., Rosi, M., 2008.
Newly discovered submarine flank eruption at Stromboli volcano (Aeolian Islands,
Italy). Geophys. Res. Lett. 35, L16310 doi:10.1029/2008GL034824.
Edmonds, M., 2008. New geochemical insights into volcanic degassing. Philos. Trans. R.
Soc. A 366, 4559–4579.
Edmonds, M., Gerlach, T.M., 2007. Vapor segregation and loss in basaltic melts. Geology
35, 751–754 doi:10.1130/G2346A.1.
Harris, A., Ripepe, M., 2007. Temperature and dynamics of degassing at Stromboli.
J. Geophys. Res. 112, B03205 doi:10.1029/2006JB004393.
Harris, A.J.L., Stevenson, D.S., 1997. Magma budgets and steady-state activity of Vulcano
and Stromboli volcanoes. Geophys. Res. Lett. 24, 1043–1046.
Johnson, E.R., Wallace, P.J., Cashman, K.V., Delgado Granados, H., Kent, A.J.R., 2008.
Magmatic volatile contents and degassing-induced crystallization at Volcán Jorullo,
Mexico: implications for melt evolution and the plumbing systems of monogenetic
volcanoes. Earth Planet. Sci. Lett. 269, 478–487.
Landi, P., Corsaro, R.A., Francalanci, L., Civetta, L., Miraglia, L., Pompilio, M., Tesoro, R.,
2009. Magma dynamics during the 2007 Stromboli eruption (Aeolian islands,
Italy): mineralogical, geochemical and isotopic data. J. Volcanol. Geoth. Res. 182,
255–268 doi:10.1016/j.jvolgeores.2008.11.010.
Métrich, N., Wallace, P., 2008. Volatile abundances in basaltic magmas and their
degassing paths tracked by melt inclusions. In: Putirka, K., Tepley, F. (Eds.),
Minerals, Inclusions and Volcanic Processes: Reviews in Mineralogy and Geochemistry, 69, pp. 363–402.
Métrich, N., Bertagnini, A., Landi, P., Rosi, M., 2001. Crystallisation driven by decompression
and water loss at Stromboli volcano (Aeolian Islands). J. Petrol. 42, 1471–1490.
Métrich, N., Bertagnini, A., Landi, P., Rosi, M., Belhadj, O., 2005. Triggering mechanism at
the origin of paroxysms at Stromboli (Aeolian archipelago, Italy): the 5 April 2003
eruption. Geophys. Res. Lett. 32, L103056 doi:10.1029/2004GL022257.
Métrich, N., Bertagnini, A., Di Muro, A., 2010. Conditions of magma storage, degassing
and ascent at Stromboli: new insights into the volcano plumbing system with
inferences on the eruptive dynamics, J. Petrol. 51, 603–626. doi: 10.1093petrology-egp083.
Moretti, R., Papale, P., 2004. On the oxidation state and volatile behaviour in
multicomponent gas-melt equilibria. Chem. Geol. 213, 265–280.
Papale, P., Moretti, R., Barbato, D., 2006. The compositional dependence of the
saturation surface of H2O + CO2 fluids in silicate melts. Chem. Geol. 29, 78–95.
Pichavant, M., Di Carlo, I., Le Gac, Y., Rotolo, S.G., Scaillet, B., 2009. Experimental
constraints on the deep magma feeding system at Stromboli volcano, Italy. J. Petrol.
50, 601–624 doi:10.1093/petrology/egp014.
Polacci, M., Baker, D.R., Mancini, L., Favretto, S., Hill, R.J., 2009. Vesiculation in magmas
from Stromboli and implications for normal Strombolian activity and paroxysmal
explosions in basaltic systems. J. Geophys. Res. 114 art. no. B01206.
Ripepe, M., Delle Donne, D., Harris, A., Marchetti, E., Ulivieri, G., 2008. Dynamics of
Stromboli activity. In: Calvari, S., Inguaggiato, S., Puglisi, G., Ripepe, M., Rosi, M. (Eds.),
Learning from Stromboli: AGU Geophysics Monograph Series, 182, pp. 39–48.
Washington DC.
�204
A. Aiuppa et al. / Earth and Planetary Science Letters 295 (2010) 195–204
Rosi, M., Bertagnini, A., Landi, P., 2000. Onset of the persistent activity at Stromboli
volcano (Italy). Bull. Volcanol. 62, 294–300.
Rust, A.C., Cashman, K.V., Wallace, P.J., 2004. Magma degassing buffered by vapour flow
through brecciated conduit margins. Geology 32 (4), 349–352 doi:10.1130/G20388.1.
Sawyer, G.M., Carn, S.A., Tsanev, V.I., Oppenheimer, C., Burton, M., 2008. Investigation
into magma degassing at Nyiragongo volcano, Democratic Republic of Congo.
Geochem. Geophys. Geosyst. 9, Q02017 doi:10.1029/2007GC001829.
Shinohara, H., 2008. Excess degassing from volcanoes and its role on eruptive and
intrusive activity. Rev. Geophys. 46 doi:10.1029/2007RG000244 RG4005.
Shinohara, H., Aiuppa, A., Giudice, G., Gurrieri, S., Liuzzo, M., 2008. Variation of H2O/CO2
and CO2/SO2 ratios of volcanic gases discharged by continuous degassing of Mt.
Etna Volcano, Italy. J. Geophys. Res. doi:10.1029/2007JB005185
Spilliaert, N., Allard, P., Métrich, N., Sobolev, A., 2006. Melt inclusion record of the
conditions of ascent, degassing and extrusion of volatile-rich alkali basalt during
the powerful 2002 flank eruption of Mount Etna (Italy). J. Geophys. Res. 111,
B04203 doi:10.1029/2005/JB003934.
�
 Marco Liuzzo