Urban Ecosyst (2011) 14:361–376
DOI 10.1007/s11252-011-0164-9
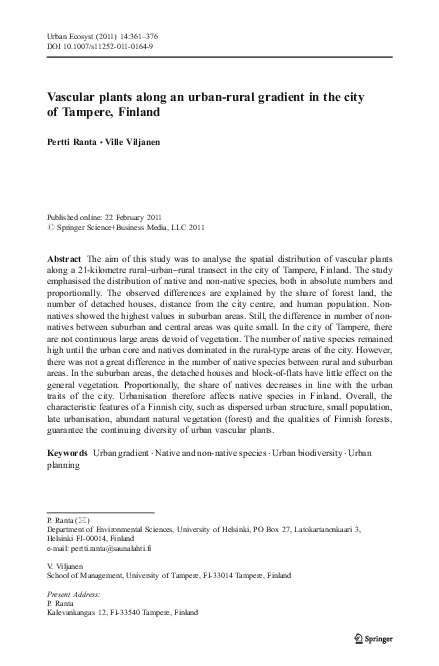
Vascular plants along an urban-rural gradient in the city
of Tampere, Finland
Pertti Ranta & Ville Viljanen
Published online: 22 February 2011
# Springer Science+Business Media, LLC 2011
Abstract The aim of this study was to analyse the spatial distribution of vascular plants
along a 21-kilometre rural–urban–rural transect in the city of Tampere, Finland. The study
emphasised the distribution of native and non-native species, both in absolute numbers and
proportionally. The observed differences are explained by the share of forest land, the
number of detached houses, distance from the city centre, and human population. Nonnatives showed the highest values in suburban areas. Still, the difference in number of nonnatives between suburban and central areas was quite small. In the city of Tampere, there
are not continuous large areas devoid of vegetation. The number of native species remained
high until the urban core and natives dominated in the rural-type areas of the city. However,
there was not a great difference in the number of native species between rural and suburban
areas. In the suburban areas, the detached houses and block-of-flats have little effect on the
general vegetation. Proportionally, the share of natives decreases in line with the urban
traits of the city. Urbanisation therefore affects native species in Finland. Overall, the
characteristic features of a Finnish city, such as dispersed urban structure, small population,
late urbanisation, abundant natural vegetation (forest) and the qualities of Finnish forests,
guarantee the continuing diversity of urban vascular plants.
Keywords Urban gradient . Native and non-native species . Urban biodiversity . Urban
planning
P. Ranta (*)
Department of Environmental Sciences, University of Helsinki, PO Box 27, Latokartanonkaari 3,
Helsinki FI-00014, Finland
e-mail: pertti.ranta@saunalahti.fi
V. Viljanen
School of Management, University of Tampere, FI-33014 Tampere, Finland
Present Address:
P. Ranta
Kalevankangas 12, FI-33540 Tampere, Finland
�362
Urban Ecosyst (2011) 14:361–376
Introduction
From an ecological point of view, cities are usually disturbed, highly modified environments with large areas that are devoid of vegetation. Urbanisation is often a major cause of
local extinction. In some countries, urbanisation endangers more species than other human
activities (Hansen et al. 2005).
In addition, city expansion can lead to the loss of many native species; they are replaced
by non-native species, which promotes biotic homogenisation. Urbanisation is seen as one
of the most homogenising human activities and, as a result, the biota of central business
districts, suburbs and residential areas are becoming increasingly similar (McKinney 2006).
Unlike the non-urban matrix ecosystem, where native species dominate, cities can be seen
as concentrations of alien species and ‘islands’ in the uniform cover of native species.
There have been considerable losses of native species in some American and European
cities. New York City, for example, has lost 578 native species (46% of all its native
herbaceous species) since the mid-19th century (DeCandido et al. 2004). The history of
land use seems to play an important part in the change. Staten Island has lost 443 native
species (41%) since 1879, while the Finger Lakes Region of Central New York State has
lost only 43 native species since the early 1800s. Most of the natural habitat in Staten Island
has been lost to urbanisation and deforestation (Robinson et al. 1994). In the case of the
Finger Lakes, numerous forest areas persisted along with other types of natural areas
(Marks et al. 2008). The city of Plzen in the Czech Republic has lost 368 native species
(31%) in the last 120 years or so (Chocholouskova and Pysek 2003).
According to the general trend, species richness declines from the rural area to the urban
core (McKinney 2002). This can be partly explained by the disappearance of vegetation and
the increase of impervious areas. However, the relationship between plants and urbanisation
may appear paradoxical and the complex nature of urban land use can have a complicated
influence on local biodiversity. Cities may be rich in species (Gödde et al. 1995; Kühn, et
al. 2004), in some cases even richer than the surrounding countryside (Knapp et al. 2008).
Urban disturbance and management practices create new habitat types, which are missing
elsewhere and are colonised by plants that arrive intentionally and non-intentionally. Urban
green areas are often kept in early stages of succession, such as traffic corridors and parks.
Several studies have also revealed the so-called suburban peak, with higher number of
species than in the rural or urban ends of the city area. This has been observed in several
taxonomic groups, including vascular plants (Kowarik 1995). These results may be in
accordance with the so-called intermediate disturbance hypothesis proposed by Grime
(1973) and Connell (1978), which predicts that species diversity reaches its maximum at an
intermediate level of disturbance (Grime 1973; Connell 1978; Bongers et al. 2009; Niemelä
and Kotze 2009).
If disturbances occur only rarely, some species are excluded by competitive exclusion.
Disturbance frequency in suburban areas is modest and a large number of species may
coexist. With high disturbance frequency, only stress tolerant species are selected, which
means that urbanisation has different effects on various taxonomic groups (McKinney
2008; Luck et al. 2009; Gray 1989). It is also essential to study the distribution of species
based on their taxonomic group. The reaction to urbanisation may differ, even within the
same taxonomic group. According to McKinney (2002), organisms may be classified as
urban avoiders, adapters or exploiters. The usual terminology when applied to vascular
plants is urbanophobic, urbanoneutral and urbanophilous species (e.g. Bomanowska and
Witosławski 2008; Wittig 1993). Urban avoiders or urbanophobic species are sensitive to
disturbance and prefer stability (long-lived shade tolerants). Typical urban avoiders in
�Urban Ecosyst (2011) 14:361–376
363
Finland are native species of the coniferous forests. The other extreme, the urbanophilous
species, prefer frequent disturbance, nitrogen-rich habitats and urban climatic conditions
(short-lived shade-intolerants). Urbanophilous species are mostly ruderals.
The rapid and global spread of urbanisation has meant that a basic challenge for
conservation is to understand how it affects biodiversity (McKinney 2008) and the biotic
homogenisation of species. The present study sought to identify the physical factors that
have decisive importance in terms of the distribution, number and quality of urban vascular
plants in the city of Tampere, Finland. In addition to the absolute number of species, the
study analysed the point at which the share of non-native species takes over and the nonnatives become more frequent than the natives. Since the introduction of the gradient
paradigm to study urban ecology, the gradient approach has proven to be a useful tool for
describing human-induced disturbances in urban areas (e.g. McDonnell and Pickett 1990;
McDonnell et al. 1997; McDonnell and Hahs 2008; Burton et al. 2005; Niemelä et al. 2009;
Zipperer et al. 2000; Pickett et al. 2009). Studies have been conducted regarding the
response to urban gradiants of various groups of organisms, such as birds (Garaffa et al.
2008; Blair 2004; Gering and Blair 1999), butterflies (Blair 1999; Clark et al. 2007)
vascular plants (Tonteri and Haila 1990), carabid beetles (Niemelä and Kotze 2009),
mammals (Mahan and O’Connell 2005) and fishes (Horwitz et al. 2001).
This study analysed and tested the theories of urban ecology in connection with
gradients in a Finnish environment. The research objective of this article can be divided into
four sub-questions: (1) Is it possible to detect any differences in the distribution of species
along the urban–rural gradient? (2) How does the distribution of native and non-native
species differ? (3) What factors in the urban structure may explain the observed
differences? and (4) Do the theories on spatial distribution of species (intermediate
disturbance hypothesis and the decline of species richness towards the city core) apply in
the city of Tampere in the zone of boreal coniferous forests.
Study area and the urban–rural gradient
The study area is situated in the City of Tampere (pop. 210,000) in Southern Finland (61° 30′ N,
23° 45′ E). The matrix ecosystem consists mostly of coniferous forest that is dominated by
Picea abies, Pinus sylvestris and Betula spp. Most tree species are native species with some
extralimital natives (like Quercus robur and also Acer platanoides, which occur as natives
south of the study area). The forests are usually managed as urban green areas and used for
the recreation of local habitants. There are no forest plantations in the area.
The herbaceous vegetation is basically seminatural or nearly naturally, with the dominant
species being Vaccinium myrtillus, Vaccinium vitis-idaea, Calamagrostis arundinacea,
Ocalis acetosella, Convallaria majalis and Carex digitata.
An esker formation with a length of more than 20 km runs through the city from east to
west. Two large lakes, Näsijärvi and Pyhäjärvi, dominate the city landscape. According to
the comprehensive habitat mapping of the city in 2000 (Ranta and Rahkonen 2008), the
general land use of the city consists of residential areas (44.8%), forests (28.0%), industrial
areas (14.9%), lakes (11.8%) and agricultural areas (0.7%).
The study examined the spatial distribution of the vascular plant species along an urban–
rural gradient. The urban–rural gradient explores the changes in plants from the rural area to
the city core. Comprehensive grid mapping reveals the distribution of plants in relation to
urbanisation (Wittig et al. 1985). Along an urban–rural gradient, the different groups take
typical positions (Wittig et al. 1993; Guntensbergen and Levenson 1997).
�364
Urban Ecosyst (2011) 14:361–376
To study a possible gradient, a 21 km long rural–urban–rural transect was established.
The transect runs through the whole city, from west to east (Fig. 1.) The transect line
consists of 42 connected quadrates of 500 m×500 m. These 42 quadrates were chosen
because they form the longest possible transect-line through the city, that includes both
urban and rural areas.
On the transect, the human population density is highest at the centre of the city, which
has a high number of apartment buildings, but at the rural ends of the gradient line the
population drops to zero (Fig. 2). The proportion of forest curve is practically the opposite:
low in the centre but high at the rural ends (Fig. 3). There are few detached houses in the
centre but many in the suburbs (Fig. 4). As matter of fact, the transect could be called a
rural–urban–rural transect because of its rural features at the beginning and at the end. In
the study area, rural quadrates at the both ends of the transect are covered with forests.
Floristic data
The material collected for this study is derived from the comprehensive floristic mapping of
the city of Tampere (Ranta and Rahkonen 2008). The city was divided into 596 quadrates
of 500 m×500 m. Observations of 1239 species (409 of which were natives) were made in
the original citywide mapping. There were 200 000 observations in total.
As noted by Zipperer and Guntensbergen (2009), species richness must be separated into
native and non-native categories in order to capture changes along the transect. In this
study, all the species were divided into native and non-native groups. Absolute and
percentage numbers of species were compared (see Table 1) as they tell different stories.
Absolute numbers reveal the amplitude of species, while percentage numbers depict the
relationship and interdependence between the species.
Fig. 1 The urban–rural transect (500×500 m) and human population density in the city of Tampere
�Urban Ecosyst (2011) 14:361–376
365
4000
Number of people
3500
3000
2500
2000
1500
1000
500
0
1 2 3 4 5 6 7 8 9 10 11 12 13 14 15 16 17 18 19 20 21 22 23 24 25 26 27 28 29 30 31 32 33 34 35 36 37 38 39 40 41 42
Transect
Fig. 2 Human population along the transect
A total of 8267 plant observations (presence of species in 500×500 cell) were made along the
entire transect (an average of 197 observations per quadrate). The share of natives on the transect
is 44%. The native species arrived in Finland without human assistance after the last glaciation,
about 10,000 years ago (Hämet-Ahti et al. 1998). The division into natives and non-native
species follows The Field Flora of Finland (Hämet-Ahti et al. 1998). The group of non-natives
consists of archaeophytes (24.6%), ornamentals (6.9%), garden escapes (9.7%) and neophytes
(14.2%). The non-natives were introduced by humans during different periods. The oldest
plants of this group are the archaeophytes, which arrived in Finland before the 17th century. In
Finland and other Nordic countries this time limit is later than in many other countries, because
of the remoteness of the area (Hämet-Ahti et al. 1998). Most of the ornamentals, garden
escapes and neophytes arrived during the 20th century. The number of the non-natives started
to increase after the construction of the railway line to Tampere in 1876.
Statistical methods
Three different methods were used to study the relationships between urbanisation and
spatial patterns of species richness. All the analyses were conducted using SPSS version
13.0. The first involved studying variation in species along the urban–rural gradient with
the help of graphic diagrams.
100
Proportion of forest
80
60
40
20
0
1 2 3 4 5 6 7 8 9 10 11 12 13 14 15 16 17 18 19 20 21 22 23 24 25 26 27 28 29 30 31 32 33 34 35 36 37 38 39 40 41 42
Transect
Fig. 3 Proportion of forest land along the transect
�366
Urban Ecosyst (2011) 14:361–376
Proportion of detached houses
80
60
40
20
0
1 2 3 4 5 6 7 8 9 10 11 12 13 14 15 16 17 18 19 20 21 22 23 24 25 26 27 28 29 30 31 32 33 34 35 36 37 38 39 40 41 42
Transect
Fig. 4 Proportion of detached houses along the transect
Secondly, in order to capture the effects of urbanisation on the native and non-native
species and their numbers and percentage, a multiple regression analysis was conducted
(model: Y ¼ a þ b1 X1 þ b2 X2 þ b3 X3 þ b4 X4 ). Regression analysis selects the independent variables that significantly affect the dependent variable. On the basis of the reviewed
Table 1 Description of the measures of species and urbanisation used to characterise the 0.25 km2 quadrates
in the study area
Measure
Description
Minimum
Maximum
Number of species
Total number of species in comprehensive
floristic mapping on the city of Tampere
in 2000 (Ranta and Rahkonen 2008)
Total number of native species in
comprehensive floristic mapping on the
city of Tampere in 2000 (Ranta and
Rahkonen 2008)
114
308
19
143
Total number of native species in
comprehensive floristic mapping on
the city of Tampere in 2000 (Ranta
and Rahkonen 2008)
Total number of native species in
comprehensive floristic mapping on
the city of Tampere in 2000 (Ranta
and Rahkonen 2008)
18
232
16,7
85,0
Percentage of
non-natives
Total number of non-native species in
comprehensive floristic mapping on
the city of Tampere in 2000 (Ranta
and Rahkonen 2008)
15
83,3
Percentage of
forest land
Comprehensive habitat mapping of the
city in 2000
0
88,0
Percentage of
detached houses
Data provided by the municipal office
in 2000
0
67,4
Distance to the
city centre
Linear distance (meters) from the central
business district
0
10000
Human population
Number of people in the 2000 census
(Statistics Finland
0
3663
Absolute number
of natives
Absolute number
of non-natives
Percentage of
natives
Transformation
method
log
�Urban Ecosyst (2011) 14:361–376
367
literature, the following four variables were selected to identify urban and rural features (see
Table 1): (1) Percentage of forest land, (2) percentage of detached houses, (3) distance to
the city centre (the cell that represents the city centre shows the highest number of retail and
commercial services, the central business district of the city of Tampere) and (4) population
(log transformation was performed on population, because of its non-normal distribution).
The predictor variables didn’t correlate too highly with each other (the highest correlation
between independent variables was .764; distance to the city centre and percentage of forest
land).
Thirdly, in order to examine the relationships between species and the urban structure in
more detail, we studied the variables in relation to the proportion of forest land with a
simple linear regression analysis (model: Y ¼ a þ b1 X1 ). In addition, we analysed the
nonlinear relationships between the variables with a quadratic model (model:
Y ¼ a þ b1 X1 þ b2 X1 2 ).
Results
The urban–rural gradient in Tampere
The comparison of the different quadrates reveals differences in the number of species
(Fig. 5), and gradients of several types can be observed along the transect.
In Tampere, the quadrates at the rural ends of the gradient with coniferous forest
have the lowest total number of species (114 species), while the number of species
in some suburban areas was over 300. The highest number of species in one
quadrate was 143 natives and 232 non-natives. At the other end of the spectrum,
one quadrate had 19 natives and 18 non-natives. The natives are more numerous at
the rural end of the transect but there are more non-native species in the most
urbanised area (Fig. 5). The number of natives exceeds the number of non-natives in only
15 quadrates. The highest difference between the number of native species and non-natives
species is 161.
Number of non-natives
Number of natives
260
240
Number of species
220
200
180
160
140
120
100
80
60
40
20
0
1 2 3 4 5 6 7 8 9 10 11 12 13 14 15 16 17 18 19 20 21 22 23 24 25 26 27 28 29 30 31 32 33 34 35 36 37 38 39 40 41 42
Transect
Fig. 5 Absolute number of natives and non-natives along the transect
�368
Urban Ecosyst (2011) 14:361–376
The percentage of non-natives exceeds the percentage of natives in 26 quadrates. The
highest difference between the percentage of native species and non-natives is
approximately 70% (Fig. 6).
Total number of species
In the regression model, approximately 30% of the total variability in the number of species
among the quadrates is accounted for by the variables (see Tables 2 and 3). Compared to
other variables, the total number of species has the lowest coefficient of determination; this
is because the total number of species includes a large variety of species. The total number
of species has a statistically significant correlation with the percentage of detached houses.
This high correlation suggests high species richness in semi-urban areas.
Figure 7 depicts the relationship between proportion of forest land and total number of
species, native and non-native species. The number of species has a significant quadratic
response to the proportion of forest land (Tables 4 and 5). Species richness is highest in
quadrates with proportion of forest land between 20 and 40%. These areas are typically
dominated by detached houses. In the city centre, the average number of all species is lower
because the building area dominates over habitats that are suitable for plants. The large
impervious areas in the city centre explain the lower numbers of all plant groups. On the
other hand, the number of species in northern boreal coniferous forest is low because of the
uniformity and acidity of soils (Reinikainen et al. 2001). In general, boreal coniferous
forests are poorer in species richness than hemiboreal forests.
Occurrence of native species
Approximately 76% of the variability of the absolute number of native species in the
regression model is accounted for by the four variables (Table 2). The absolute number of
natives has a positive and statistically highly significant correlation with the percentage of
detached houses and the distance to the city centre and significant correlation with the
percentage of forest land. The absolute number of natives correlates negatively with
population. The total number of natives shows the highest coefficient of determination with
% of natives
% of non-natives
Proportion of species
100
80
60
40
20
0
1 2 3 4 5 6 7 8 9 10 11 12 13 14 15 16 17 18 19 20 21 22 23 24 25 26 27 28 29 30 31 32 33 34 35 36 37 38 39 40 41 42
Gradient
Fig. 6 The percentage distribution of native and non-native species along the transect
�Urban Ecosyst (2011) 14:361–376
369
Table 2 Multiple linear regression: coefficients of determination (R2) and standardized regression
coefficients
Coefficient of
determination R2
Standardized regression coefficient
% of forest
land
% of detached
houses
Distance to
the city centre
(m)
Number or
people
Total number
of species
0,298a
−0,006
0,578b
0,237
−0,085
Absolute number
of natives
0,764c
0,320a
0,353c
0,485c
−0,359b
% of native species
0,880c
0,345c
0,072
0,451c
−0,374c
c
a
Absolute number
of non-native
species
0,476
−0,246
0,366
−0,12
0,179
% of non-native
species
0,877c
−0,342c
−0,081
−0,454c
0,376c
a
Significant at the level of 0.05
b
Signicant at the level of 0.01
c
Signicant at the level of 0.001
distance to the city centre. Increased distance indicates more forests or other habitats that
are suitable for native species, such as natural lakes and shores, brooks, bogs, rocky
outcrops and meadows. The natives are basically forest species but the distance from the
city centre explains the number of natives better than the share of forested land. These
habitats are not abundant near the most densely populated and built-up parts of the city.
The number of natives increases quite continuously with the proportion of forest land
(Fig. 7). Both the linear and the quadratic model show statistically highly significant
relation to the proportion of forest land (Tables 4 and 5). However, the quadratic response is
stronger. The curve shows a peak at 50% of forest land. At the very rural ends of the
gradient, the number of natives represents the undisturbed and monotonous nature of
coniferous forests. The absolute number of natives is quite similar in the rural and suburban
areas. Suburban settlement does not necessarily correspond to lower numbers of native
species in Finnish conditions. In Finnish suburbia, buildings are like small isolated spots in
the wide forest and they have little effect on general vegetation, but in the city centre, there
Table 3 Multiple linear regression: unstandardized regression coefficients and constants
Unstandardized regression coefficient
Constant
% of forest % of detached Distance to the Number or
land
houses
city centre (m) people
−0,013
0,424
0,004
−4,927
171,5
Absolute number of natives
Total number of species
0,454
0,18
0,006
−14,011
71,8
% of native species
0,222
0,017
0,002
−6,794
41,2
Absolute number of non-native species −0,446
0,237
−0,002
9,136
99,2
−0,019
−0,002
6,787
58,6
% of non-native species
−0,219
�370
Urban Ecosyst (2011) 14:361–376
Fig. 7 Relationships between
proportion of forest land and
total numbers of all (a), native (b)
and non-native species (c)
is very little forests or any type of vegetation and consequently relatively few native
species.
Eighty-eight percent of the variability in the percentage of natives is accounted by the
four variables in Table 2. The percentage of natives has a statistically highly significant
relation to the distance from the city centre and the percentage of forest land and a negative
relation to population. The percentage of the natives follows the proportion of forest land
continuously, which reflects the importance of the forests to the natives (Fig. 8 and
Table 4). When the proportion of forest land is lower than approximately 30%, the nonnatives take over. Landscaping of these areas has brought ornamentals and other non-native
species to the area.
�Urban Ecosyst (2011) 14:361–376
371
Table 4 Simple linear regression model (independent variable: proportion of forest land): coefficients of
determination (R2), constants, unstandardized regression coefficients
Coefficient of
determination R2
Constant
Unstandardized
regression coefficient
−0,427
Total number of species
0,053
218,6
Absolute number of natives
0,393***
68,1
0,741
% of native species
0,716***
28,3
0,547
Absolute number of non-native species
% of non-native species
0,433***
0,708***
149,2
71,1
−1,15
−0,54
***Signicant at the level of 0.001
Occurrence of non-native species
Forty-eight percent of the variability of the absolute number of non-natives is accounted for
by the four variables (Table 2). It is the second lowest of the explained variances studied.
There are other factors that may explain the distribution of non-native species better than
the analysed variables. The effect of unstudied measures can be noticed in Fig. 5. The
variation of adjacent quadrates is much bigger with non-natives than natives. The
correlation of the absolute number of the non-natives with population and the percentage
of the detached houses significantly positive. The non-native species can be regarded as
typical city-species and, more specifically, as suburban species.
The number of non-natives decreases as the share of forest increases (Fig. 7). Both the
linear and the quadratic model show statistically highly significant linear relation to the
proportion of forest land (Tables 4 and 5). The share of forests and the share of other
habitats is lower in the suburban and central parts of the city than in the rural areas, which
correlates with the high numbers of non-native species. The non-native species are not
forest species, so where the forests dominate, the non-native species will be low.
The variables account for as much as 88% of the variability of the percentage of the nonnatives (Table 2). The percentage of non-natives has a highly significant negatively relation
to the distance from the city centre and the percentage of forest land. The percentage of
non-natives has a highly significant positively relation to the population.
The non-native species dominate in the most urban quadrates (low in forests) but with
more forests the share of non-native species drops (Fig. 8 and Table 4). The decrease in the
share of forest land results in a linear increase in the share of non-native species. The
Table 5 Simple quadratic regression model (independent variable: proportion of forest land): coefficients of
determination (R2), constants, unstandardized regression coefficients
Coefficient of determination R2 Constant Unstandardized
regression coefficients
Total number of species
0,266*
193,2
2,11
−0,033
Absolute number of natives
0,597***
52,3
2,33
−0,021
% of native species
0,719***
Absolute number of non-native species 0,469***
27,2
139,3
0,656
−0,167
−0,001
−0,013
% of non-native species
72,1
−0,631
0,001
*Significant at the level of 0.05
***Signicant at the level of 0.001
0,710***
�372
Urban Ecosyst (2011) 14:361–376
Fig. 8 Relationships between
proportion of forest land and
proportion of native and nonnative species
proportion of natives and non-natives are inversely related to the proportion of forest. In the
very city centre, the absolute number of non-natives drops but the percentage of non-natives
does not (Figs. 7 and 8). In the most urban areas, only a few habitats are available for any
plants but the non-natives are not replaced with the natives either.
Discussion
This study aimed to examine the relationship between urbanisation and plant species and
the loss of native species in a Finnish city, thereby contributing to the understanding of
urban ecology. Quite few urban–rural gradient studies have analyzed the boreal zone.
Several studies have suggested that the relationship between vascular plants and
urbanisation is somewhat paradoxical. The complex nature of land use can have intricate
influences on local biodiversity. According to the general trend, species richness declines
linearly from rural areas to urban ones. In our study, species richness is highest in suburban
areas (so called suburban peak) (Fig. 9). The result supports the general intermediate
disturbance hypothesis.
In addition to the total number of species, we studied the distribution of native and nonnatives. Both the number of native species and the number of non-natives varied across the
gradient, with non-natives showing the highest values in suburban areas. Still, the
difference in number of non-natives between suburban and central areas is quite small. In
the city of Tampere, there are not continuous large areas devoid of vegetation.
�Urban Ecosyst (2011) 14:361–376
All species
Number of species
Fig. 9 Urban–rural gradient in
Tampere according to the study.
The figure gives a generalized
depiction of the positions of
species groups along the gradient
373
Non-natives
Natives
Urban
Suburban
Rural
In Tampere, natives dominate at the rural end of the transect, yet there are no major
differences in the number of natives between the rural and suburbia. There are several reasons
for this. When the share of forest increases, also the absolute number of native species
increases, but only to a certain limit. When the share of forest reaches about 50%, the natives
reach their maximum number, which will not rise any higher in spite on the rising share of
forest. The reason is the exhaustion of the species pool of native forest species. The Finnish
forests are typically boreal coniferous forests, which are relatively poor in species.
Nestedness is also an explaining factor: the larger forests include all the species of the
smaller forest fragments. In a study with forested islands outside the city of Helsinki, the
number of species could be estimated accurately by the area of an island (Ranta et al. 1999).
In addition, the forests dominate also in the discontinuous residential areas. Even in the
central business districts there are fragments of natural vegetation and some native species.
The occurrence of the native species reflects the resilience of Finland’s forests. In Finnish
cities, the suburbia consists mostly of forests and have a much smaller effect on species
composition than American-style cities (for example DeCandido et al. 2004).
Along with the loss of biodiversity, the homogenisation of flora is a significant global
urban challenge (Olden et al. 2004). “Urban ecosystems are quite similar worldwide in
terms of structure, functions, and constraints” (Savard et al. 2000). Basically, urbanisation
causes the loss of native species, which can lead to biotic homogenisation. This is true also
for Finnish urban ecosystems, but with some qualifications.
Proportionally, urbanisation has a negative effect on native species also in Finland; the share of
natives diminishes as soon as the share of forest land begins to decrease. However, the absolute
number of natives begins to decrease not until the share of forests goes under 30%, approximately.
Finnish urban structure has some features that preserve the natives. Firstly, the boreal coniferous
forests are well buffered against the invasion of alien species because of the acid, podsolic soils
with low calcium content and the solid cover of field layer vegetation (Reinikainen et al. 2001).
Secondly, Finnish cities have certain general features, such as small population (all cities in
Finland have less than 500,000 inhabitants), late urbanisation, abundance of natural vegetation
(forest) and a scattered sparse urban structure. These features have saved the Finnish cities
from the losses of native species that have occurred elsewhere (Hahs et al. 2009). In
Finland, urbanisation is not considered an especially significant cause of loss of species
(Rassi et al. 2010). In the city of Helsinki, for example, only 37 species (30 natives) have
been lost out of over 1100 species over a period of 100 years (Kurtto and Helynranta 1998).
Helsinki has an average of 40% of native species, which is typical in Finland, compared with
33% in Tampere (pop. 210,000) (Ranta and Rahkonen 2008) and 47% in Oulu (pop.
140,000) (Väre et al. 2005). In spite of the homogenisation of urban areas throughout the
world, different kind of models are needed in different climatic and vegetation zones.
�374
Urban Ecosyst (2011) 14:361–376
The current urban structure of Finnish cities actually preserves the biodiversity quite well.
However, this favourable situation may be lost in the future because the recent trend in urban
planning is defragmentation—the avoidance of urban sprawl. Finnish per capita urban land use
is much larger than that of most other European countries (Kasanko et al. 2006). Meanwhile a
more compact urban structure could benefit the environment in several ways, such as by
reducing greenhouse gas emissions, but it could also mean the loss of the current favourable
situation. Urban diversity depends on the remaining fragments of semi-natural vegetation
inside the urban structure. Together with the diversity values, these fragments represent
considerable amenity values for local residents. Even the small remaining fragments could
help maintain the diversity of vascular plants; our data suggest that only in the very urban
core of Tampere, where the share of forest falls low, also the number of non-natives begins to
decrease. On the other hand, defragmentation could potentially have positive effects on some
species, if large areas, at least in theory, are left untouched.
In this study, we explained the number of species by the share of forests, distance from
the city centre, detached houses and population. These variables explain 76% of the
variability of native species but less then 50% of non-natives. In general, native species are
more ‘predictable’ than non-natives because of their dependence on natural vegetation.
Human disturbance, landscaping and city planning tend to affect non-natives more; the
number of detached houses explains well the number of non-natives.
It is possible to detect two different dimensions in the data: the urban–rural and the
suburban. The number of natives is associated with the degree of urbanisation, but the nonnatives with suburbanisation. The distance from the city centre and the share of forests are
strongly positively correlated. Population correlated negatively with distance from the city
centre and share of forests. Population, distance and the share of forests represent the
urban–rural dimension in the data. In a way, these variables tell the same story. However,
distance is kind of a surrogate variable which covers the real effective factors. Besides,
from the point of view of city planning it is not possible to control the distance as a variable
we can have an affect on. Neither population is an unambiguous indicator, because it has
not a direct influence on plants. In the study area, the density of population is relatively low
with little effect on the general vegetation. In Finnish conditions, the share of forest may be
the most relevant indicator of urbanisation. Nonetheless, we suppose that soil sealing may
turn out to the best factor to describe human disturbance in cities. At the time of the study,
the variable of soil sealing was not yet available.
Acknowledgements Mr. Jouko Sipari helped with the field work, Dr. Tarmo Virtanen gave advice on the
statistical analysis and prof. Jari Niemelä provided comments on the manuscript. Their contributions are
gratefully acknowledged.
References
Blair R (1999) Birds and butterflies along an Urban Gradient: surrogate Taxa for assessing Biodiversity?
Ecol Appl 9(1):164–170
Blair RB (2004) The effects of urban sprawl on birds at multiple levels of biological organization. Ecology
and Society 9(5). URL: http//www.ecologyandsociety.org/vol9/iss5/art2/
Bomanowska A, Witosławski P (2008) Selected aspects of diversity of synanthropic flora in chosen cities of
central Poland. Biodiv Res Conserv 9–10:35–42
Bongers F, Poorter L, Hawthorne WD, Sheil D (2009) The intermediate disturbance hypothesis applies to
tropical forest, but disturbance contributes little to tree diversity. Ecol Lett 12(8):798–805
�Urban Ecosyst (2011) 14:361–376
375
Burton ML, Samuelsson LJ, Pan S (2005) Riparian Woody plant diversity and forest structure along an
urban–rural gradient. Urban Ecosyst 8:93–106
Chocholouskova Z, Pysek P (2003) Changes in composition and structure of urban flora over 120 years: a
case study of the city of Plzen. Flora 198:366–376
Clark PJ, Reed JM, Chew FS (2007) Effects of urbanization on butterfly species richness, guild structure, and
rarity. Urban Ecosyst 10(3):157–164
Connell JH (1978) Diversity in the tropical rain forests and coral reefs. Science 199:1302–1310
DeCandido R, Muir AA, Gargiullo MB (2004) A first approximation of the historical and extant vascular flora of
New York City: implications for native plant species conservation. J Torrey Bot Soc 131:243–251
Garaffa PI, Filloy J, Bellocq MI (2008) Bird community responses along urban–rural gradient: does the size
of the urbanized area matter? Landsc Urban Plann 90(1–2):33–41
Gering JC, Blair RB (1999) Predation of artificial bird nests along an urban gradient: predatory risk or
relaxation in urban environments? Ecography 22(5):532–541
Grime JP (1973) Competitive exclusion in herbaceous vegetation. Nature 242:344–347
Gray JS (1989) Effects of environmental stress on species assemblages. Biol J Linn Soc 37:19–32
Guntensbergen GR, Levenson JB (1997) Understorey plant species composition in remnant stands along an
urban-to-rural land-use gradient. Urban Ecosyst 1:155–169
Gödde M, Richarz N, Walter B (1995) Habitat conservation and development in the city of Düsselforf,
Germany. In: Sukopp H, Numata M, Huber A (eds) Urban ecology as the basis for urban planning. SPB
Academic Publishing, The Hague, pp 163–171
Hahs AK, McDonnel MJ, McCarthy MA, Vesk PA, Corlett RT, Norton BA, Clemants SE, Duncan RP,
Thompson K, Schwartz MW, Williams NSG (2009) A global synthesis of plant extinction rates in urban
areas. Ecol Lett 12:1165–1173
Horwitz RJ, Johnson T, Hession WC (2001) Fish Communities along an Urban Gradient: Influences of
Riparian Vegetation. Conference Proceeding Paper: Bridging the Gap: Meeting the World’s Water and
Environmental Resources Challenges. Section 1, chapter 173
Hämet-Ahti L, Suominen J, Ulvinen T, Uotila P (eds) (1998) Retkeilykasvio (Field Flora of Finland), Ed. 4.
656 pp. Finnish Museum of Natural History, Botanical Museum. Helsinki
Hansen A, Knight R, Marzluff J, Powell S, Brown K, Gude P, Jones K (2005) Effects of exurban
development on biodiversity: patterns, mechanisms, and research needs
Kasanko M, Barredo JI, Lavalle C, McCormick N, Demicheli L, Sagris V, Brezger A (2006) Are European cities
becoming dispersed? A comparative analysis of 15 European urban areas. Landsc Urban Plan 77:111–130
Knapp S, Kuhn I, Schweiger O, Klotz S (2008) Challenging urban species diversity: contrasting
phylogenetic patterns across plant functional groups in Germany. Ecol Lett 11(10):1054–1064
Kowarik I (1995) On the role of alien species in urban flora and vegetation. In: Pysek P, Prach K, Rejmánek
M, Wade M (eds) Plant invasions—general aspects and special problems. SPB Academic Publishing,
Amsterdam, p 263
Kühn I, Brandl R, Klotz S (2004) The flora of German cities is naturally species rich. Evol Ecol Res 6:749–764
Kurtto A, Helynranta L (1998) Helsingin kasvit. (Flora oh Helsinki). – Helsingin kaupungin ympäristökeskus
and Helsinki University Press. 400 p
Luck GW, Smallbone LT, O’Brien R (2009) Socio-economics and vegetation change in urban ecosystems:
patterns in space and time. Ecosystems 12(4):604–620
Mahan C, O’Connell T (2005) Small mammal use of suburban and urban parks in Central Pennsylvania.
Northeast Nat 12(3):307–314
Marks PL, Wesley FR, Gardescu S (2008) The vascular plant diversity of the Finger Lakes region of central
New York State: changes in the 1800s and 1900s. J Torrey Bot Soc 135(1):53–69
McDonnell MJ, Hahs AK (2008) The use of gradient analysis studies in advancing our understanding of the
ecology of urbanizing landscapes: current status and future directions. Landsc Ecol 2008(23):1143–1155
McDonnell MJ, Pickett STA (1990) Ecosystem structure and function along urban-rural gradients: an
unexploited opportunity for ecology. Ecology 71:1232–1237
McDonnell MJ, Pickett S, Groffman P, Bohlen P, Bouyat R, Zipperer W, Parmelee R, Carreiro M, Medley K
(1997) Ecosystem processes along an urban–rural gradient. Urban Ecosyst 1:21–36
McKinney M (2002) Urbanization, Biodiversity and Conservation. Bioscience 52(10):883–890
McKinney ML (2006) Urbanization as a major cause of biotic homogenization. Biol Cons 127:247–260
McKinney ML (2008) Effects of urbanization on species richness: a review of plants and animals. Urban
Ecosyst 11(2):161–176
Niemelä J, Kotze J (2009) Carabid beetle assemblages along urban to rural gradients: a review. Landsc Urban
Plan 92(2):65–71
Niemelä J, Kotze JD, Yli-Pelkonen V (2009) Comparative urban ecology: challenges and possibilities. In:
Ecology of cities and Towns: A Comparative Approach. Cambridge University Press 2009. 714 pp
�376
Urban Ecosyst (2011) 14:361–376
Olden JD, LeRoy Poff N, Douglas MR, Douglas M, Fausch KD (2004) Ecological and evolutionary
consequences of biotic homogenization. Trends Ecol Evol 19(1):18–24
Pickett STA, Cardenasso ML, McDonnell MJ, Burch WR (2009) Frameworks for urban ecosystem studies:
gradients, patch dynamics and the human ecosystem in the New York metropolitan area and Baltimore,
USA. In: Ecology of cities and Towns: A Comparative Approach. Cambridge University Press 2009.
714 pp
Ranta P, Rahkonen P (2008) Tampereen kaupunkiluonto. Opas kaupunkiekologiaan (A guide to urban
ecology of the city of Tampere). Tampere-Seura. 235 pp
Ranta P, Tanskanen A, Niemelä J, Kurtto A (1999) Selection of islands for conservation in the Urban
Archipelago of Helsinki, Finland. Conserv Biol 13(6):1293–1300
Rassi P, Hyvärinen E, Juslén A, Mannerkoski I (eds) (2010) The 2010 Red Lists of Finnish Species.
Ympäristöministeriö & Suomen ympäristökeskus. Helsinki. 685 p
Reinikainen A, Mäkipää R, Vanha-Majamaa I, Hotanen J-P (eds) (2001) Kasvit muuttuvassa metsäluonnossa. (Changes in the frequency and abundance of forest and mire plants in Finland since 1950s. In
Finnish with English summary). Tammi. 384 pp
Robinson GR, Yurlina ME, Handel SN (1994) A century of change in the Staten Island flora: ecological
correlates of species losses and invasions. Bull Torrey Bot Club 121(2):119–129
Savard JPL, Clergeau P, Mennechez G (2000) Biodiversity concepts and urban ecosystems. Landsc Urban
Plan 48:131–142
Tonteri T, Haila Y (1990) Plants in a boreal city: ecological characteristics of vegetation in Helsinki and its
surroundings; southern Finland. Ann Bot Fenn 27(4):337–352
Väre H, Ulvinen T, Vilpa E, Kalleinen L (2005) Oulun kasvit-Piimäperältä Pilpasuolle. Norrlinia 11:1–512,
Abstract: The flora of the city of Oulu in northern Finland
Wittig R (1993) Flora und vegetation. In: Sukopp H, Wittig R (eds) Stadtökologie. Gustav Fischer Verlag.
402 pp
Wittig R, Diesing D, Gödde M (1985) Urbanophob-urbanoneutral-urbanophil—Das Verhalten der Arten
gegenüber dem Lebensraum Stadt. Flora 177:265–282
Wittig R, Sukopp H, Klausnitzer B (1993) Die Ökologische Gliederung der Stadt. In: Sukopp H, Wittig R
(eds) Stadtökologie. Gustav Fischer Verlag. 402 pp
Zipperer W, Guntensbergen G (2009) Vegetation composition and structure of forest patches along urbanrural gradients. – In: McDonnell. M., Hahs, A. and Breuste, J. (eds.): Ecology of Cities and Towns.
Cambridge University Press. 714 p
Zipperer WC, Wu J, Pouyat RV, Pickett STA (2000) The application of ecological principles to urban and
urbanizing landscapes. Ecol Appl 10(3):685–688
�
 Pertti Ranta