www.nature.com/scientificreports
OPEN
Deep genetic structure at a small
spatial scale in the endangered land
snail Xerocrassa montserratensis
Cristina Català1, Vicenç Bros2, Xavier Castelltort3, Xavier Santos4,5 & Marta Pascual1,5*
Species with small geographic ranges do not tend to have a high genetic structure, but some land
snail species seem to be an exception. Xerocrassa montserratensis, an endangered land snail endemic
to Catalonia (northeastern Iberian Peninsula), is an excellent model to study the processes affecting
the phylogeography of specialized species of conservation concern. This species is restricted to
xerophilous stony slopes and occurs within a small and fragmented area of ca. 500 km2. We sequenced
the COI barcode region of 152 individuals from eight sites covering the entire range of the species.
We found four genetic groups mostly coincident with their geographic distribution: a central
ancestral group containing shared haplotypes among five localities and three groups restricted to
a single locality each. Two of these derived groups were geographically and genetically isolated,
while the third and most differentiated group was not geographically isolated. Geomorphologic and
paleoclimatic processes during the Pleistocene can explain the divergence found between populations
of this low dispersal species with historical fragmentation and secondary contacts. Nonetheless,
recent passive large dispersal through streams was also detected in the central group. Overall, our
study uncovered four evolutionary units, partially matching morphologically described subspecies,
which should be considered in future conservation actions.
Invertebrate species represent the majority of multicellular organisms but are often neglected from conservation policies mostly due to lack of knowledge1. Land snails are highly diverse in the number of species although
frequently unknown because of cryptic morphological speciation2. Projections since the 1980s estimate that 7%
of land snails have been probably lost in front of the suggested 0.04% considering all taxa3. Although few genetic
studies focused on European Mediterranean land snails, this group is composed by ca. 2700 species with a high
rate of endemism and evolutionary diversification4. Land snails are organisms with very low dispersal abilities5.
Some snail species have large distribution ranges, often associated to generalist ecological requirements6–8. However, many species have small distribution ranges and a considerable ecological specialization9,10. Life-history
traits such as low mobility and ecological specialization make land snails good candidates to exhibit a high genetic
structure11. Phylogeographic studies can provide information on genetic diversity and historical demographic
processes such as isolation, gene flow and range expansion/contraction12,13. This approximation can help delineating conservation measures of threatened endemic species, such as some land snails10,14, and thus in setting
species recovery priorities15.
Land snails of the genus Xerocrassa are distributed across the Mediterranean basin16, and include ca. 50
described species in the European side of the basin plus many subspecies17. Some species are morphologically
cryptic and only molecular studies may uncover specific delimitations14. Many species are concentrated in Greece
and in the Balearic Islands, and most of them are endemics (17 species in Greece and 11 in Balearic Islands), indicating the potential for genetic differentiation due to ecological specialization and low dispersal ability10,18. High
endemism is also observed in the mainland, as exemplified by Xerocrassa montserratensis, a species restricted to
the north-eastern part of the Iberian Peninsula with a small geographic distribution (< 3600 km2) and an area of
occupancy of 448 km219, fragmented in several isolated patches20. This snail shows a high habitat specialization,
living almost exclusively in mountain xerophilous bare stony slopes of conglomerate lithology with narrow soil
1
Departament de Genètica, Microbiologia i Estadística and IRBio, Universitat de Barcelona, Diagonal 643,
08028 Barcelona, Spain. 2Oficina Tècnica de Parcs Naturals, Diputació de Barcelona, Urgell 187, 08036 Barcelona,
Spain. 3ETSEA, Departament de Ciències del Sòl i Medi Ambient, Universitat de Lleida, Alcalde Rovira Roure, 191,
25198 Lleida, Spain. 4CIBIO/InBIO, Centro de Investigação em Biodiversidade e Recursos Genéticos, Universidade
do Porto, Campus Agrário de Vairão, R. Padre Armando Quintas s/n, 4485-661 Vairão, Portugal. 5These authors
jointly supervised this work: Xavier Santos and Marta Pascual. *email: martapascual@ub.edu
Scientific Reports |
(2021) 11:8855
| https://doi.org/10.1038/s41598-021-87741-7
1
Vol.:(0123456789)
�www.nature.com/scientificreports/
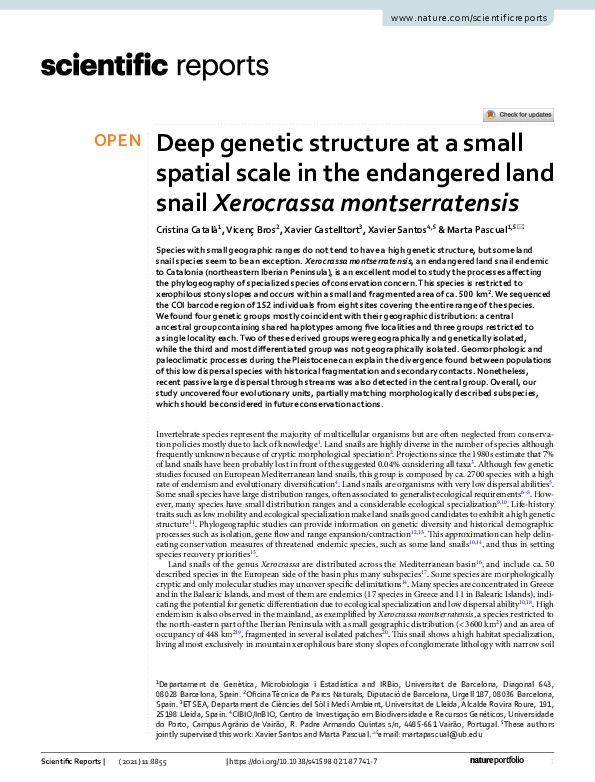
Figure 1. Distribution range, habitat and sampling information of Xerocrassa montserratensis. (A) Distribution
map of X. montserratensis with shell photographs of the three morphologically described subspecies. The arrows
point to their locus typicus20. (B) Location and codes of the eight sampling sites (Table 1). (C) Photography of a
bare stony slope, the preferred habitat of X. montserratensis. (D) Distribution of bare stony slopes (red patches)
in Sant Llorenç del Munt i l’Obac Natural Park including the three locations sampled in this park. The map in
(A) was performed with ArcGIS 10x (ESRI, https://www.esri.com/). The maps in (B,D), are in UTM coordinates
for zone 31 T, and have been plotted with Surfer20 (Golden Software, https://www.goldensoftware.com/).
and little shrub and grass vegetation21. Currently, bare stony slopes are patchily distributed in isolated points
surrounded by dense unsuitable forest and scrubland22.
At the end of the XIXth century three subspecies were described based on morphological traits of the shell:
X. m. montserrantesis23, X. m. betulonensis24 and X. m. delicatula25. The distribution of these subspecies was
limited to a few localities25. However, there is some controversy on their taxonomic status in the literature. One
morphological study suggested that the subspecies X. m. betulonensis was a different species26. Nonetheless, a
recent study that analysed characters of the shell and anatomical traits of the reproductive organs in individuals
from the different areas failed to identify morphological differences in the traits historically used to discriminate
among the three subspecies20.
Our study aims at understanding the processes structuring the populations of ecological specialist species
with reduced distribution ranges by analysing the genetic structure of Xerocrassa montserratensis across its whole
distribution range. Specifically, we (1) evaluate the genetic diversity of the species; (2) analyse the differentiation
among populations; (3) test if the population genetic structure is explained by expansion, isolation by distance, or
barriers to gene flow, and (4) investigate the validity of its subspecies. We hypothesize that the species will present
high inter-population genetic differentiation caused by its suitable habitat fragmentation and low dispersal ability.
Results
Genetic diversity and population differentiation. A total of 615 bp of the Cytochrome Oxidase I
(COI) barcode fragment were aligned for 152 Xerocrassa montserratensis individuals from eight localities
across the whole distribution range of the species (Fig. 1, Table S1). Overall, 33 different haplotypes were found
(Table S2), of which 30 were private, meaning that they were found in only one locality. Total genetic diversity
was high in both haplotype (0.91 ± 0.01) and nucleotide (0.011 ± 0.001) diversity. No differentiation in nucleotide diversity was found between localities (Table S3). However, haplotype diversity varied significantly between
some of the localities (Table S3) with Montcau, Castellsapera and Els Munts showing higher haplotype diversity values (Table 1). Population diversity did not deviate from neutrality, except for Sant Jeroni (D = − 1.962,
p = 0.01), although this deviation seems not due to a population expansion given that R2 values were not significant (Table 1).
Four well-differentiated groups were identified with the haplotype network (Fig. 2). A central group including
haplotypes mostly present in five localities, and three peripheral groups, each almost restricted to a single locality.
Sant Jeroni group was composed by 4 haplotypes exclusively found in this locality, in the Montserrat Mountain
(Figs. 1 and S1), from where the species was described23. The Montcau group contained 7 haplotypes all from that
locality, from where the subspecies X. m. delicatula was initially described (Fig. 1)25, and one highly differentiated haplotype from the neighbouring locality of Castellsapera. Finally, the Els Munts group was formed by 5
haplotypes only present in that geographically distant locality (Fig. 2). Interestingly, the Central group contained
haplotypes from Marina, the only sampling site located near the coast. This group included individuals from
Scientific Reports |
Vol:.(1234567890)
(2021) 11:8855 |
https://doi.org/10.1038/s41598-021-87741-7
2
�www.nature.com/scientificreports/
Locality
Code
N
h
S
AR
Hd
π (%)
D
R2
Sant Jeroni
JE
21
5 (5)
10
2.8
0.486 ± 0.124
0.195 ± 0.108
− 1.962*
0.151
Montcau
MU
19
8 (8)
19
5.9
0.877 ± 0.044
0.626 ± 0.162
− 1.119
0.146
Castellsapera
CA
20
9 (8)
22
5.8
0.832 ± 0.063
0.649 ± 0.155
− 1.366
0.102
La Mola
LA
20
2 (1)
1
1.0
0.505 ± 0.056
0.082 ± 0.009
1.430
0.253
Gallifa
GA
13
3 (1)
2
2.0
0.410 ± 0.154
0.088 ± 0.036
− 0.462
0.164
Sentmenat
SE
20
4 (1)
3
2.5
0.647 ± 0.072
0.125 ± 0.022
− 0.244
0.133
Marina
MA
20
3 (1)
5
1.9
0.426 ± 0.122
0.167 ± 0.070
− 0.832
0.103
Els Munts
EM
19
5 (5)
5
3.6
0.731 ± 0.080
0.267 ± 0.032
0.450
0.160
Total
–
152
33
51
–
0.909 ± 0.014
1.131 ± 0.074
− 0.721
0.067
Table 1. Genetic diversity values and neutrality tests of Xerocrassa montserratensis from the analysed
localities. N number of individuals analysed, h number of haplotypes, private haplotypes in parentheses, S
segregating sites, AR allelic richness for a sample of 12 individuals, Hd haplotype diversity ± standard deviation,
π % of nucleotide diversity ± standard deviation; Tajima’s D and R2 neutrality tests. *p values < 0.05.
Figure 2. Median-joining network of X. montserratensis COI haplotypes with the four identified groups
(A). Each haplotype is identified with its number and circle colour coded by locality. The size of the circles
is proportional to the number of sequences with the same haplotype. Dashes represent nucleotide changes
between haplotypes. Principal Coordinates Analysis (PCoA) based on pairwise populations FST values (B). The
haplotype network was built and edited with Network 10 (https://fluxus-engineering.com/). The PCoA plot was
built with GenAlEx (https://biology-assets.anu.edu.au/GenAlEx/).
the populations described as X. m. betulonensis (Marina, Gallifa and Sentmenat)25. In the case of Montcau and
Sant Jeroni, it is interesting to emphasize that we also found haplotypes clustering in the central group (Fig. 2).
The differentiation among populations explained the largest variation (77.5%) of the global variance, as
revealed by an AMOVA without any a priori grouping. The rest of the total variation (22.5%) was explained by
differences within populations. In both cases, the differences were significant (P < 0.001). All pairwise populations’
comparisons (FST values) were significant after FDR correction except for the comparison between Sentmenat
and Gallifa (Table 2). The plot representing the localities with a Principal Coordinates Analysis (PCoA) based on
the pairwise FST matrix explained 51.25% of the differences between populations with the first two axes (Fig. 2).
Marina (MA), Sentmenat (SE), Gallifa (GA) and La Mola (LA) were relatively close to each other, all of them
with haplotypes in the central group of the network. Montcau (MU), Sant Jeroni (JE) and Els Munts (EM) were
far away from the rest while Castellsapera (CA) had an intermediate ordination in the PCoA plot.
Scientific Reports |
(2021) 11:8855 |
https://doi.org/10.1038/s41598-021-87741-7
3
Vol.:(0123456789)
�www.nature.com/scientificreports/
JE
JE
MU
MU
CA
< 0.001
0.834
CA
0.624
0.685
LA
0.871
0.789
LA
GA
SE
MA
EM
< 0.001
< 0.001
< 0.001
< 0.001
< 0.001
< 0.001
< 0.001
< 0.001
< 0.001
< 0.001
< 0.001
< 0.001
< 0.001
0.427
GA
0.865
0.758
0.525
0.641
SE
0.849
0.785
0.515
0.421
< 0.001
< 0.001
< 0.001
< 0.001
< 0.001
< 0.001
< 0.001
< 0.001
0.019
< 0.001
< 0.001
0.004
< 0.001
0.182
MA
0.823
0.781
0.429
0.257
0.420
0.120
EM
0.892
0.855
0.722
0.891
0.893
0.889
< 0.001
0.872
Table 2. Pairwise genetic distances between Xerocrassa montserratensis localities. FST values are shown below
the diagonal and P values above. P values < 0.013 are significant according to FDR correction. Locality codes as
in Table 1.
No isolation by distance was observed with a Mantel Test when all localities were used (r = 0.439, P = 0.092;
Figure S2), suggesting that genetic distances between populations were not explained by geographic distances.
We suspected that some localities could be acting as outliers, according to the haplotype network and PCoA plot
(Fig. 2). For instance, Montcau located in the same natural park as Castellsapera and La Mola (Fig. 1), and thus
in close proximity to them, was highly differentiated. On the contrary, Marina although geographically distant
had haplotypes in the central group and shared with other localities. For this reason, we performed Mantel Tests
without these localities resulting in a significant isolation by distance when excluding either Montcau (r = 0.599,
P = 0.048), Marina (r = 596, P = 0.009) or both (r = 0.745, P = 0.001) (Figure S2). Finally, we identified two barriers
with the Monmonier Maximum Difference Algorithm: the first separated Els Munts from the rest, and the second
separated Montcau. However, when using ‘pseudoslopes’ to reflect the change in genetic composition relative
to the change in physical distance, a maximum differentiated peak was obtained around Montcau (Figure S3).
Phylogenetic analysis and molecular dating. The X. montserratensis haplotype phylogenetic trees
obtained by Maximum likelihood (ML) and Bayesian inference (BI), using X. chiae as outgroup, were concordant and grouped all haplotypes with high support values (Fig. 3). The haplotypes in the central group of the
network (Fig. 2) had a more basal position in the phylogenetic tree and presented low support values, while
the three external groups in the network (Montcau, Sant Jeroni and Els Munts) had high support values with
both phylogenetic methodologies (Fig. 3). Considering the differentiation in these three groups we carried out a
phylogenetic reconstruction and molecular dating with BEAST to estimate the time of coalescence of the haplotypes in the different groups. We used as outgroups 11 species (Table S4), six from the three main clades of the
Balearic Islands and five considered as the closest relatives of X. montserratensis from the Iberian Peninsula18.
We based the separation of the three main clades of Xerocrassa species in the Balearic Islands around 5.3 ± 0.3
Mya, as done by previous authors18. The mean substitution rate per site and Myr was 0.0203 (95% HPD interval:
0.0136, 0.0274), within the range of the rate calculated for other land snails27. All X. montserratensis haplotypes
grouped with high support values (Fig. 4) and the time to their most recent common ancestor was dated around
(mean ± sd) 1.91 ± 0.64 Mya. We also estimated the coalescence time of the haplotypes in each of the three
divergent groups, according to the network and the phylogenetic tree reconstruction. The most recent common
ancestor of all haplotypes found in the Montcau group, exclusive from that locality, dated from 0.65 ± 0.31 Mya
(Fig. 4), from the Els Munts group dated from 0.40 ± 0.23 Mya, and from Sant Jeroni, coalesced 0.33 ± 0.21 Mya.
Discussion
In this work, we assessed the population structure of the xerophilous land snail Xerocrassa montserratensis, an
endemic species of a small region in Catalonia (northeastern Iberian Peninsula). We detected significant genetic
differentiation among localities as expected for a species with a low mobility and a high habitat specialization.
The population differentiation followed an isolation by distance model with some exceptions. On one hand,
the two closest neighbouring localities showed a high differentiation. On the other hand, one of the most geographically distant localities showed a low differentiation. Finally, three of the main mitochondrial genetic groups
encountered matched the distribution area of subspecies morphologically described in the XIXth century but
the taxonomy of which had recently been discussed controversially.
Population genetic diversity and differentiation. Haplotype diversity was high in Xerocrassa montserratensis populations, as found in other terrestrial-snails13,27,28. This high genetic diversity could be explained
by cryptic initial speciation processes, fragmentation of the suitable habitat, secondary contacts, local adaptation and ultimately reduced gene flow14,29. We found differences in genetic diversity among localities that could
be related to their extent of suitable habitats, as observed in other species where a positive correlation between
allelic richness and habitat patch size had been reported30. This pattern seems to be concordant in Sant Llorenç
del Munt i l’Obac Natural Park (Fig. 1), where Montcau and Castellsapera, the two localities with the highest
haplotype diversities, have the largest extent of bare stony slopes, whereas La Mola has only a small extension of
suitable habitat, in agreement with the lowest values of haplotype diversity. In the study area bare stony slopes are
patchily distributed and surrounded by oak forests that natural reforestation and fire can contract and expand
Scientific Reports |
Vol:.(1234567890)
(2021) 11:8855 |
https://doi.org/10.1038/s41598-021-87741-7
4
�www.nature.com/scientificreports/
Figure 3. Maximum likelihood phylogenetic tree of Xerocrassa montserratensis COI haplotypes using
sequences of X. chiae as outgroup (Table S4). Values at the nodes are only shown for high bootstrap values/
posterior probabilities. The colours identify the locality where each haplotype has been detected. The groups are
the same identified in the haplotype network in Fig. 2. The tree was edited using Figtree v. 1.4.4. (http://tree.bio.
ed.ac.uk/software/figtree/).
in a dynamic process22. Thus, fluctuations in habitat extension impacting on population sizes in this species may
determine their present diversity and differentiation. A similar pattern has been observed in Xerocrassa species
from Crete Island due to gene flow barriers and population expansions14.
Although in our study most genetic differentiation among localities could be explained by an isolation by
distance model, two localities deviated from this pattern: Marina and Montcau. In the case of Marina, the locality
presented low genetic distance but high geographic distance from the central populations of X. montserratensis.
This low genetic differentiation could be due to a recent colonization event, most probably through passive dispersal. Despite their low mobility, passive dispersal has been documented for some land snails due to anthropogenic
activities5,31. Dispersal capacity has been shown to be negatively correlated with body size, and long distance
passive dispersal also mediated through wildlife, water and wind32–34. Thus, X. montserratensis might be passively
dispersed probably due to its small size. Based on morphological similarities of the shell, Bofill hypothesized that
the snails from Marina derived from the populations of Gallifa and Sentmenat by passive dispersal through the
Ripoll and Besòs Rivers25. These two localities are upstream of these rivers whereas Marina is located downstream
of the Besòs River. Thus, more than 100 years later we confirmed Bofill’s hypothesis with molecular markers.
The presence of X. montserratensis fossils found in Rubí25, 20 km downstream from its present distribution in
Sant Llorenç del Munt i l’Obac Natural Park, suggests that passive dispersal along streams has occurred multiple
times. This ability to disperse passively over large distances combined with the presence of suitable habitat may
explain the current patchy distribution of this vulnerable species.
Conversely to Marina, Montcau showed high genetic differentiation with Castellsapera and La Mola populations, located less than 4 km apart, all of them within the Sant Llorenç del Munt i l’Obac Natural Park. High
genetic differentiation at small spatial scale may be explained by a past fragmentation and posterior secondary
contact, as already proposed in other land snail studies12,29,35. For instance, high genetic distances among nearby
populations found in X. mesostena from Crete island were explained by geographic barriers and population
expansion facilitated by deforestation14. Other studies have found high genetic differentiation in land snail species
with a reduced geographic range30,36. All these examples suggest that a high genetic distance between nearby snail
populations is a common pattern although the geographic and historical context may change among species.
Scientific Reports |
(2021) 11:8855 |
https://doi.org/10.1038/s41598-021-87741-7
5
Vol.:(0123456789)
�www.nature.com/scientificreports/
Figure 4. Calibrated Bayesian COI tree using BEAST, with the four groups observed for Xerocrassa
montserratensis, colour coded as in the haplotype network and phylogenetic tree (Figs. 2 and 3), and species of
the Iberian Peninsula and the Balearic Islands (Accession numbers in Table S4). The divergence among species
of the Balearic Islands was used to calibrate the tree. The dots in the nodes provide posterior probabilities with
size and grading according to the scale bar. The big black dots represent a posterior probability > 0.99. The tree
was edited using Figtree v. 1.4.4. (http://tree.bio.ed.ac.uk/software/figtree/).
A paleogeographic scenario to explain X. montserratensis differentiation. In X. montserratensis,
the time to the most recent common ancestor of all COI haplotypes was dated around 1.9 Mya, and the three
peripheral haplotype groups, exclusive from a different locality, showed coalescent times between 0.3 and 0.6
Mya, placing the fragmentation of these populations into the Pleistocene. During this geologic period, glaciations have been proposed as mechanisms of population fragmentation in land snails, with interglacial periods promoting expansion from different refugia due to the contraction of ice sheets or changes in vegetation
cover14,36. The coalescent time of the three peripheral haplotype groups of X. montserratensis match different
glacial periods37,38. Thus, changes in vegetation cover during the Pleistocene climatic oscillations, due to fire and
reforestation, could explain the present biogeographic haplotype distribution in X. montserratensis, since this
species is currently observed in non-forested and recently burned areas2239.
Alternatively, geomorphological processes, such as a reorganization of the water drainage system, could also
be responsible for paleogeographic population isolations, explaining the present genetic structure of X. montserratensis. Jointing and homoclinal shifting (i.e. changes in the position of homoclinal ridges in a down-dip
direction) are known to shape drainage rearrangements40. In the study area, homoclinal shifting occurred thanks
to the rifting along transversal basement faults (Vallès-Penedès and Amer Faults, Figure S1). For instance, in the
Guilleries area (Figure S1), homoclinal shifting has caused a scarp retreat of nearly 20 km to the west41, which
might contribute to the genetic isolation of the population of Els Munts. At Sant Llorenç and Montserrat areas, a
set of joints oriented SSW–NNE occurred, exerting significant control on initial drainage rearrangement. In this
area we have calculated a scarp retreat of ca. 5 km due to homoclinal shifting41, which may have isolated snail
populations from La Mola and Montcau, genetically very distinct despite being geographically close.
In addition, species with small dispersal distances and low population sizes might be prone to show phylogeographic breaks that can arise without any barrier to gene flow, especially at maternally inherited markers42. Thus
further research at the genome wide level is needed to evaluate the drivers of the mitochondrial differentiation
identified between the neighbouring localities of X. montserratensis within the Sant Llorenç del Munt i l’Obac
Natural Park.
Mitochondrial revalidation of X. montserratensis taxonomy.
The subspecies described more than
100 years ago are concordant with our observed mitochondrial analyses. Thus, the nominal form X. m. montserratensis would correspond to the Sant Jeroni molecular group coinciding with the locality where the species
was described23. The subspecies described as X. m. betulonensis24 matches some of the locations in the central
molecular group and thus should not be considered a different species as previously claimed based on morphological characters26, and seems to be the subspecies with the largest distribution area. The subspecies X. m.
delicatula25 could correspond to the Montcau molecular group, from where the subspecies was described. This
Scientific Reports |
Vol:.(1234567890)
(2021) 11:8855 |
https://doi.org/10.1038/s41598-021-87741-7
6
�www.nature.com/scientificreports/
group is the most genetically differentiated, although the presence of haplotypes from the central group in the
localities of Montcau would suggest incomplete lineage sorting or present gene flow through secondary contact.
Future studies with genome wide markers using the same individuals are necessary to discriminate between
these two scenarios. Finally, the differentiated molecular group found in Els Munts, the geographically most
distant population, located at the Guilleries (Catalan Transversal Range), could also be considered a different
subspecies with slightly morphological differences since individuals in this locality have more rounded shell and
a less marked carinate shell border20. Despite morphological variation in the shell shape and size among different X. montserratensis populations, Martinez-Ortí & Bros20 recently stated that morpho–anatomical characters
from both the shell and reproductive system cannot be used to discriminate the described taxa. Morpho-static
evolution has been described in some snail species arising from molecular but non-ecological differentiation43.
Moreover, discrepancies between nuclear, mitochondrial and morphological data can result from initial stages
of the speciation processes with ongoing gene flow44,45. Thus, the subspecies status in X. montserratensis should
be considered preliminary since only mitochondrial data has been used. Additional studies using genome-wide
markers should be undertaken to evaluate whether parapatric X. montserratensis populations have current gene
flow, further providing the potential to uncover adaptation processes46,47.
Conservation implications. Our study provides new information for conservation management actions
to be considered by policymakers and stakeholders at the Natural Parks, where most of X. montserratensis populations are located. The genetically differentiated groups found in this species could be considered different
evolutionary significant units, matching the initially described morphological subspecies, with the identification
of a potential new subspecies. According to IUCN, X. montserratensis is listed as endangered because its reduced
distribution range and habitat specialization. Moreover, its populations are decreasing since a low number of
specimens have been found in some populations (https://www.iucnredlist.org/species/22254/9368348 accessed
December 2020)19. The fact that we have found high genetic structuring implies that there is not only the need
of species protection but also to protect each genetic group in a coordinated manner since the risk of extinction
is higher. Although the species inhabits protected Natural Parks, conservation plans are mostly based on largersized fauna and flora. Our study helps to put more emphasis in this kind of fauna (no arthropod invertebrates),
which normally are not considered flag species and deserve less interest from conservation institutions, and
highlights the role of genetic studies in setting species priorities in conservation management plans.
Material and methods
Distribution range and field sampling. Xerocrassa montserratensis is a land snail species of less than
1.5 cm of shell diameter20 inhabiting bare stony slopes of conglomerate lithology in the northeastern Iberian
Peninsula (Fig. 1). This conglomerate lithology is distributed in a clastic sedimentary belt that extends from the
Montserrat area to the Guilleries area, bordering the western margin of the Montseny Massif at heights between
800 and 1200 m (Figure S1 and Table S1). The land snail X. montserratensis is listed as Endangered in the IUCN
Red List of Threatened Species19.
At the end of the XIXth century three subspecies were described based on morphological traits of the shell
(Fig. 1): X. m. montserrantesis23, X. m. betulonensis24 and X. m. delicatula25. The subspecies X. m. delicatula was
only described in the area of La Mata at Sant Llorenç del Munt i l’Obac Natural Park. On the other hand, X. m.
betulonensis was only found in three localities, Gallifa and Sentmenat (Catalan Prelitoral Range) and Marina
(Catalan Litoral Range). Finally, X. m. montserrantesis was described from individuals collected in the Montserrat
Mountain, where the species was initially described23. In a recent morphologic study, a more globose shell shape
and less carinated shell periphery was described in individuals from Els Munts20.
Snails were collected from eight locations, most of them in Natural Park reserves, covering the known range
of the species including the localities where the different subspecies were described and with previous morphologic analyses (Fig. 1 and Table S1). All the collection sites are located across the Catalan Prelitoral Range with
the exceptions of Els Munts located in the Catalan Transversal Range and Marina located in the Catalan Litoral
Range. The lithology of all these localities is composed by xerophilous conglomerates and highly fragmented bare
stony slopes, except Marina which is characterized by Paleozoic granodiorites and located at the lowest altitude.
A total of 152 snail individuals were collected between autumn 2013 and autumn 2014, except for La Mola
which was sampled in winter 2015. For conservation management of this endangered species, juveniles were prioritized over adults for collection. Juveniles are more abundant in the localities and have lower survival capacity
during the summer drought experienced in Mediterranean environments. The permit to collect the specimens
was granted by the corresponding authorities of the natural parks managed by Diputació de Barcelona, Patronat
de la Muntanya de Montserrat, and Servei de Fauna i Flora of the Generalitat de Catalunya. Approximately 20
samples were taken from each locality and preserved in absolute ethanol for further genetic analyses (Table 1).
The epiphragm was broken to ensure correct material preservation for DNA extraction. Two specimens of X.
ripacurcica from Congost de Montrebei (Lleida) were collected and sequenced in the present work.
DNA extraction, amplification and sequencing. For each specimen, the shell was broken and a small
fragment of foot tissue was cut and dried to remove ethanol. Total genomic DNA was extracted using QIAamp
DNA Mini Kit (QIAGEN), according to the manufacturer’s protocol, and resuspended in 50 µl AE buffer. The
universal primers LCO1490/HCO219848 were used to amplify the barcode region of the Cytochrome Oxidase I
(COI) gene. PCR amplifications were carried out in a total volume of 20 µl including: 2 µl of 5 × Buffer (GoTaq,
Promega), 1 µl of 25 nmol MgCl2, 0.5 µl of dNTP (1 mM), 0.4 µl of each primer (10 µM), 0.2 µl of Taq polymerase corresponding to 1 unit (GoTaq, Promega) and 1 µl of DNA. The PCR started with an initial denaturation
at 94 °C for 5 min, followed by 35 cycles of a denaturation step at 94 °C for 1 min, an annealing step at 50 °C for
Scientific Reports |
(2021) 11:8855 |
https://doi.org/10.1038/s41598-021-87741-7
7
Vol.:(0123456789)
�www.nature.com/scientificreports/
1 min and an elongation step at 72 °C for 1 min 30 s, and a final elongation step at 72 °C for 7 min. The amplified DNA was purified with Exo-SAP (0.2 U/µl Exonuclease and 0.2 U/µl Shrimp Phosphatase) at a proportion
of 1:2 (ExoSap:PCR product) and the forward strand was sequenced by Macrogen or Scientific and Technologic
Services at the Universitat de Barcelona. Sequence chromatograms were visually checked, aligned and cut to the
same length with MEGA X49. We only used the forward primer because the obtained sequences had clear nucleotide peaks. Doubtful sequences were repeated for amplification and sequenced from both primers for reliability.
Genetic diversity, haplotype network and population structure. Haplotype diversity, nucleotide
diversity and their standard deviations were calculated for each population using DnaSP 650. To evaluate differences in diversity between localities we carried out a permutation test with 10,000 replicates using genetic_diversity_diffs v1.0.6 (https://github.com/laninsky/genetic_diversity_diffs) 51. To compare the number of haplotypes
among localities with different number of analysed individuals we calculated allelic richness with Contrib52. To
identify signs of population demographic events deviating from neutrality we computed Tajima’s D neutrality
test and R2 test of demographic expansion using DnaSP 6 for each locality separately and the whole area combined. Haplotype frequencies per locality, pairwise genetic distances (FST) between localities and its significance,
and the amount of variation found within and among localities (AMOVA) were calculated using Arlequin ver.
3.5.253. The Benjamini-Yekutieli False Discovery Rate (FDR) correction54 was applied to account for multiple
comparisons. The genetic relations among populations were visualized in a bi-dimensional plot by a principal
coordinates analysis (PCoA) with GenAlEx55 using pairwise FST values. Correlations between pairwise population genetic (FST) and geographic distance matrices were evaluated by Mantel tests and its significance assessed
with 999 permutations using GenAlEx. Pairwise geographic distances were computed as the Euclidean distance
in km between each two collecting sites. Finally, barriers to gene flow among localities were calculated with
Alleles In Space56 using Monmonier Maximum Difference Algorithm and Interpolate Genetic Landscape Shape.
Raw distances and the option “pseudoslope”, which corrects the genetic distances with the geographic ones, were
also used to identify the barriers.
To show the number of nucleotide changes among haplotypes and their relationships we built a haplotype
network using the Median Joining Network Algorithm with the software Network 10 (https://fluxus-engineering.
com/).
Phylogenetic analyses and molecular dating. Phylogenetic relationships among haplotypes were estimated using both Maximum Likelihood (ML) and Bayesian Inference (BI) methods. Xerocrassa chiae was used
as outgroup, since it is the closest relative18. For phylogenetic reconstruction we used the HKY + G + I evolution
model, as identified by the Bayesian information criteria in MEGA X49. For ML analysis, PhyML v 3.157 was ran
with 1000 replicates to obtain the bootstrap support values. MrBayes v. 3.258 was used for BI analysis. The Bayesian posterior probabilities were obtained running 3 heated chains and 1 cold chain for two separate runs, with
1 × 10⁷ generations each, saving one tree every 1000 generations. A consensus tree was obtained after discarding
the first 25% iterations as burn-in.
The time of divergence between groups of X. montserratensis was estimated using a Bayesian approach implemented in BEAST 1.1059. The analysis was based on the geographic calibration followed by Chueca et al.18
considering that the three main clades of Xerocrassa species within the Balearic Island diverged during the
Messinian Salinity Crisis, 5.3 ± 0.3 Mya. Overall, we used 11 additional species (Table S4), six from the three
main clades of the Balearic Islands and five considered the closest relatives of X. montserratensis from the Iberian
Peninsula18. Two specimens of X. ripacurcica analysed in the present work were also included. We tested for
substitution saturation in DAMBE 760 and no saturation was obtained when considering all sites or each codon
position separately. The Yule model was selected as a speciation model, and an exponential relaxed clock without correlation was used. Two independent runs were performed for 1 × 10⁸ generations, with a sampling every
10,000 generations. The two runs were combined using LogCombiner 1.1059 and the first 10% of trees for each
run removed as burn-in. The parameters were verified with Tracer 1.761 ensuring ESS > 200 for all parameters
estimated. The highest credibility tree was identified with TreeAnnotator 1.1059 that summarizes all retained
trees into a single consensus. Phylogenetic trees were visualized and edited using Figtree v. 1.4.4. (http://tree.
bio.ed.ac.uk/software/figtree/).
Data availability
Xerocrassa montserratensis and X. ripacurcica haplotype sequences are deposited in GenBank (Accession numbers
MW642508-40 and MW642546-7, respectively).
Received: 27 December 2020; Accepted: 30 March 2021
References
1. Cardoso, P., Erwin, T. L., Borges, P. A. V. & New, T. R. The seven impediments in invertebrate conservation and how to overcome
them. Biol. Conserv. 144, 2647–2655 (2011).
2. Lydeard, C. et al. The global decline of nonmarine mollusks. Bioscience 54, 321–330 (2004).
3. Régnier, C. et al. Mass extinction in poorly known taxa. Proc. Natl. Acad. Sci. USA 112, 7761–7766 (2015).
4. Cuttelod, A., Seddon, M. & Neubert, E. European Red List of Non-Marine Molluscs (2011).
5. Aubry, S., Labaune, C., Magnin, F., Roche, P. & Kiss, L. Active and passive dispersal of an invading land snail in Mediterranean
France. J. Anim. Ecol. 75, 802–813 (2006).
6. Guiller, A. & Madec, L. Historical biogeography of the land snail Cornu aspersum: A new scenario inferred from haplotype distribution in the Western Mediterranean basin. BMC Evol. Biol. 10, 18 (2010).
Scientific Reports |
Vol:.(1234567890)
(2021) 11:8855 |
https://doi.org/10.1038/s41598-021-87741-7
8
�www.nature.com/scientificreports/
7. Ochman, H., Jonest, J. S. & Selander, R. K. Molecular area effects in Cepaea. Proc. Natl. Acad. Sci. USA 80, 4189–4193 (1983).
8. Chueca, L. J., Gómez-Moliner, B. J., Madeira, M. J. & Pfenninger, M. Molecular phylogeny of Candidula (Geomitridae) land snails
inferred from mitochondrial and nuclear markers reveals the polyphyly of the genus. Mol. Phylogenet. Evol. 118, 357–368 (2018).
9. Moreira, F., Calado, G. & Dias, S. Conservation status of a recently described endemic land snail, Candidula coudensis, from the
Iberian peninsula. PLoS ONE 10, e0138464 (2015).
10. Sauer, J. & Hausdorf, B. Reconstructing the evolutionary history of the radiation of the land snail genus Xerocrassa on Crete based
on mitochondrial sequences and AFLP markers. BMC Evol. Biol. 10, 299 (2010).
11. Davison, A. Land snails as a model to understand the role of history and selection in the origins of biodiversity. Popul. Ecol. 44,
129–136 (2002).
12. Pfenninger, M., Posada, D. & Shaw, K. Phylogeographic history of the land snail Candidula unifasciata (Helicellinae, Stylommatophora): Fragmentation, corridor migration, and secondary contact. Evolution (N. Y). 56, 1776–1788 (2002).
13. Madeira, P. M. et al. High unexpected genetic diversity of a narrow endemic terrestrial mollusc. PeerJ 2017, e3069 (2017).
14. Sauer, J., Oldeland, J. & Hausdorf, B. Continuing fragmentation of a widespread species by geographical barriers as initial step in
a land snail radiation on Crete. PLoS ONE 8, e62569 (2013).
15. Haig, S. M. Molecular contributions to conservation. Ecology 79, 413–425 (1998).
16. Ezzine, I. K., Pfarrer, B., Dimassi, N., Said, K. & Neubert, E. At home at least: The taxonomic position of some North African
Xerocrassa species (Pulmonata, Geomitridae). Zookeys 712, 1–27 (2017).
17. Bank, R. A. & Neubert, E. Checklist of the Land and Freshwater Gastropoda of Europe. http://www.marinespecies.org/aphia.php?p=
sourcedetails&id=279050 (2017).
18. Chueca, L. J., Gómez-Moliner, B. J., Forés, M. & Madeira, M. J. Biogeography and radiation of the land snail genus Xerocrassa
(Geomitridae) in the Balearic Islands. J. Biogeogr. 44, 760–772 (2017).
19. Martínez-Ortí, A. Xerocrassa montserratensis. The IUCN Red List of Threatened Species e.T22254A9368348. https://doi.org/10.
2305/IUCN.UK.2011-1.RLTS.T22254A9368348.en (2011).
20. Martínez-Ortí, A. & Bros, V. Taxonomic clarification of three taxa of Iberian geomitrids, Helix montserratensis Hidalgo, 1870 and
subspecies (Gastropoda, Pulmonata), based on morpho–anatomical data. Anim. Biodivers. Conserv. 40, 247–267 (2017).
21. Bros, V. Composició de la comunitat de mol· luscs de les codines en el Parc Natural de Sant Llorenç del Munt i l’Obac, i l’impacte
del trepig i l’erosió en el Montcau. In VII Monografies de Sant Llorenç del Munt i l’Obac 43–52 (2011).
22. Santos, X., Bros, V. & Ros, E. Contrasting responses of two xerophilous land snails to fire and natural reforestation. Contrib. Zool.
81, 167–180 (2012).
23. Hidalgo, J. G. Description de trois espèces nouvelles d’Helix d’Espagne. J. Conchyliol. 18, 298–299 (1870).
24. Bofill, A. Catálogo de los moluscos testáceos terrestres del llano de Barcelona. Crónica Científ. 3, 1–24 (1879).
25. Bofill, A. La Helix montserratensis. Su origen y su distribución en el tiempo y en el espacio. Mem. Real Acad. Cienc. Artes Barcelona
2, 331–343 (1898).
26. Altimira, C. Notas malacológicas. Contribución al conocimiento de la fauna malacológica terrestre y de agua dulce de Cataluña.
Misc. Zool. 3, 7–10 (1971).
27. Van Riel, P. et al. Molecular systematics of the endemic Leptaxini (Gastropoda: Pulmonata) on the Azores islands. Mol. Phylogenet.
Evol. 37, 132–143 (2005).
28. Kruckenhauser, L. et al. Paraphyly and budding speciation in the hairy snail (Pulmonata, Hygromiidae). Zool. Scr. 43, 273–288
(2014).
29. Dempsey, Z. W., Goater, C. P. & Burg, T. M. Living on the edge: Comparative phylogeography and phylogenetics of Oreohelix land
snails at their range edge in Western Canada. BMC Evol. Biol. 20, 3 (2020).
30. Ursenbacher, S., Alvarez, C., Armbruster, G. F. J. & Baur, B. High population differentiation in the rock-dwelling land snail (Trochulus caelatus) endemic to the Swiss Jura Mountains. Conserv. Genet. 11, 1265–1271 (2010).
31. Jesse, R., Véla, E. & Pfenninger, M. Phylogeography of a land snail suggests trans-Mediterranean Neolithic transport. PLoS ONE
6, e20734 (2011).
32. Hausdorf, B. Biogeography of the Limacoidea sensu lato (Gastropoda: Stylommatophora): vicariance events and long-distance
dispersal. J. Biogeogr. 27, 379–390 (2000).
33. Neiber, M. T., Sagorny, C., Sauer, J., Walther, F. & Hausdorf, B. Phylogeographic analyses reveal Transpontic long distance dispersal
in land snails belonging to the Caucasotachea atrolabiata complex (Gastropoda: Helicidae). Mol. Phylogenet. Evol. 103, 172–183
(2016).
34. Simonová, J., Simon, O. P., Kapic, Š, Nehasil, L. & Horsák, M. Medium-sized forest snails survive passage through birds’ digestive
tract and adhere strongly to birds’ legs: More evidence for passive dispersal mechanisms. J. Molluscan Stud. 82, 422–426 (2016).
35. Watanabe, Y. & Chiba, S. High within-population mitochondrial DNA variation due to microvicariance and population mixing
in the land snail Euhadra quaesita (Pulmonata: Bradybaenidae). Mol. Ecol. 10, 2635–2645 (2001).
36. Nägele, K.-L. & Hausdorf, B. Comparative phylogeography of land snail species in mountain refugia in the European Southern
Alps. J. Biogeogr. 42, 821–832 (2015).
37. Shakun, J. D., Lea, D. W., Lisiecki, L. E. & Raymo, M. E. An 800-kyr record of global surface ocean δ18O and implications for ice
volume-temperature coupling. Earth Planet. Sci. Lett. 426, 58–68 (2015).
38. Lisiecki, L. E. & Raymo, M. E. A Pliocene-Pleistocene stack of 57 globally distributed benthic δ 18O records. Paleoceanography
20, 1–17 (2005).
39. Santos, X., Bros, V. & Miño, À. Recolonization of a burned Mediterranean area by terrestrial gastropods. Biodivers. Conserv. 18,
3153–3165 (2009).
40. Bishop, P. Drainage rearrangement by river capture, beheading and diversion. Prog. Phys. Geogr. Earth Environ. 19, 449–473 (1995).
41. Castelltort, F. X., Balasch, J. C., Cirés, J. & Colombo, F. Consecuencias de la migración lateral de una cuenca de drenaje (Homoclinal
shifting) en la formación de la cuenca erosiva de la Plana de Vic. NE de la Cuenca del Ebro. Geogaceta 61, 55–58 (2017).
42. Irwin, D. E. Phylogeographic breaks without geographic barriers to gene flow. Evolution (N. Y). 56, 2383–2394 (2002).
43. Falniowski, A. et al. Melanopsidae (Caenogastropoda: Cerithioidea) from the eastern Mediterranean: Another case of morphostatic
speciation. Zool. J. Linn. Soc. 190, 483–507 (2020).
44. Proćków, M., Strzała, T., Kuźnik-Kowalska, E., Proćków, J. & Mackiewicz, P. Ongoing speciation and gene flow between taxonomically challenging Trochulus species complex (Gastropoda: Hygromiidae). PLoS ONE 12, e0170460 (2017).
45. Fiorentino, V., Manganelli, G., Giusti, F., Tiedemann, R. & Ketmaier, V. A question of time: The land snail Murella muralis (Gastropoda: Pulmonata) reveals constraints on past ecological speciation. Mol. Ecol. 22, 170–186 (2013).
46. Bamberger, S. et al. Genome‐wide nuclear data confirm two species in the Alpine endemic land snail Noricella oreinos s.l. (Gastropoda, Hygromiidae). J. Zool. Syst. Evol. Res. 00, 1–23 (2020).
47. Torrado, H., Carreras, C., Raventos, N., Macpherson, E. & Pascual, M. Individual-based population genomics reveal different
drivers of adaptation in sympatric fish. Sci. Rep. 10, 12683 (2020).
48. Folmer, O., Black, M., Hoeh, W., Lutz, R. & Vrijenhoek, R. DNA primers for amplification of mitochondrial cytochrome c oxidase
subunit I from diverse metazoan invertebrates. Mol. Mar. Biol. Biotechnol. 3, 294–299 (1994).
49. Kumar, S., Stecher, G., Li, M., Knyaz, C. & Tamura, K. MEGA X: Molecular evolutionary genetics analysis across computing
platforms. Mol. Biol. Evol. 35, 1547–1549 (2018).
50. Rozas, J. et al. DnaSP 6: DNA sequence polymorphism analysis of large data sets. Mol. Biol. Evol. 34, 3299–3302 (2017).
Scientific Reports |
(2021) 11:8855 |
https://doi.org/10.1038/s41598-021-87741-7
9
Vol.:(0123456789)
�www.nature.com/scientificreports/
51. Alexander, A. et al. What influences the worldwide genetic structure of sperm whales (Physeter macrocephalus)?. Mol. Ecol. 25,
2754–2772 (2016).
52. Petit, R. J., El Mousadik, A. & Pons, O. Identifying populations for conservation on the basis of genetic markers. Conserv. Biol. 12,
844–855 (1998).
53. Excoffier, L. & Lischer, H. E. L. Arlequin suite ver 3.5: A new series of programs to perform population genetics analyses under
Linux and Windows. Mol. Ecol. Resour. 10, 564–567 (2010).
54. Narum, S. R. Beyond Bonferroni: Less conservative analyses for conservation genetics. Conserv. Genet. 7, 783–787 (2006).
55. Peakall, R. & Smouse, P. E. GenAlEx 6.5: Genetic analysis in Excel. Population genetic software for teaching and research—An
update. Bioinformatics 28, 2537–2539 (2012).
56. Miller, M. P. Alleles in space (AIS): Computer software for the joint analysis of interindividual spatial and genetic information. J.
Hered. 96, 722–724 (2005).
57. Guindon, S. & Gascuel, O. A simple, fast, and accurate algorithm to estimate large phylogenies by maximum likelihood. Syst. Biol.
52, 696–704 (2003).
58. Ronquist, F. et al. MrBayes 3.2: Efficient Bayesian phylogenetic inference and model choice across a large model space. Syst. Biol.
61, 539–542 (2012).
59. Suchard, M. A. et al. Bayesian phylogenetic and phylodynamic data integration using BEAST 1.10. Virus Evol. 4, vey016 (2018).
60. Xia, X. DAMBE7: New and improved tools for data analysis in molecular biology and evolution. Mol. Biol. Evol. 35, 1550–1552
(2018).
61. Rambaut, A., Drummond, A. J., Xie, D., Baele, G. & Suchard, M. A. Posterior summarization in Bayesian phylogenetics using
Tracer 1.7. Syst. Biol. 67, 901–904 (2018).
Acknowledgements
We thank Àngel Miño, Adrià Fàbrega, Mireia Vila, Daniel Pons and Jordi Calaf for giving logistic support on the
snail sampling. We also thank Víctor Ojeda and Víctor Ordóñez for technical support in the laboratory. Permit
for capture sampling was done by Servei de Fauna i Flora, Sub-direcció General de Biodiversitat i Medi Natural
de la Generalitat de Catalunya. This study was financially supported by CTM2017-88080 (MCIU, AEI/FEDER,
UE) and by the Oficina Tècnica de Parcs Naturals de la Diputació de Barcelona.
Author contributions
V.B., X.S. and M.P. conceived and designed the study. V.B. and X.S. sampled all individuals. C.C. conducted the
laboratory and data analyses with inputs from M.P. All authors wrote and contributed to the final version of the
manuscript.
Competing interests
The authors declare no competing interests.
Additional information
Supplementary Information The online version contains supplementary material available at https://doi.org/
10.1038/s41598-021-87741-7.
Correspondence and requests for materials should be addressed to M.P.
Reprints and permissions information is available at www.nature.com/reprints.
Publisher’s note Springer Nature remains neutral with regard to jurisdictional claims in published maps and
institutional affiliations.
Open Access This article is licensed under a Creative Commons Attribution 4.0 International
License, which permits use, sharing, adaptation, distribution and reproduction in any medium or
format, as long as you give appropriate credit to the original author(s) and the source, provide a link to the
Creative Commons licence, and indicate if changes were made. The images or other third party material in this
article are included in the article’s Creative Commons licence, unless indicated otherwise in a credit line to the
material. If material is not included in the article’s Creative Commons licence and your intended use is not
permitted by statutory regulation or exceeds the permitted use, you will need to obtain permission directly from
the copyright holder. To view a copy of this licence, visit http://creativecommons.org/licenses/by/4.0/.
© The Author(s) 2021
Scientific Reports |
Vol:.(1234567890)
(2021) 11:8855 |
https://doi.org/10.1038/s41598-021-87741-7
10
�
 Vicenç Bros