Package Reports
54
Prism
The Prism System is a computer package for statistical data analysis. It is being
sponsored by the Working Party on Statistical Computing of the Royal Statistical
Society, and is a development from GLIM. The latter was released in 1978 is now
available at nearly 500 sites world-wide, including most British Polytechnics and
Universities.
Prism is an interactive program designed for the simple but flexible manipulation and statistical analysis of data. It is directive-based, each directive performing a specific task. Structures (which include scalars, vectors, strings, macros,
labellings and n-way arrays) may be created, named, manipulated, displayed and
deleted; actions are specified via pathwords, which can be combined in Englishlanguage-like phrases; space is allocated a n d recovered dynamically; multiple
input/output channels (including transcript) are permitted. Full diagnosis of user
faults, plus suggested remedies, are provided.
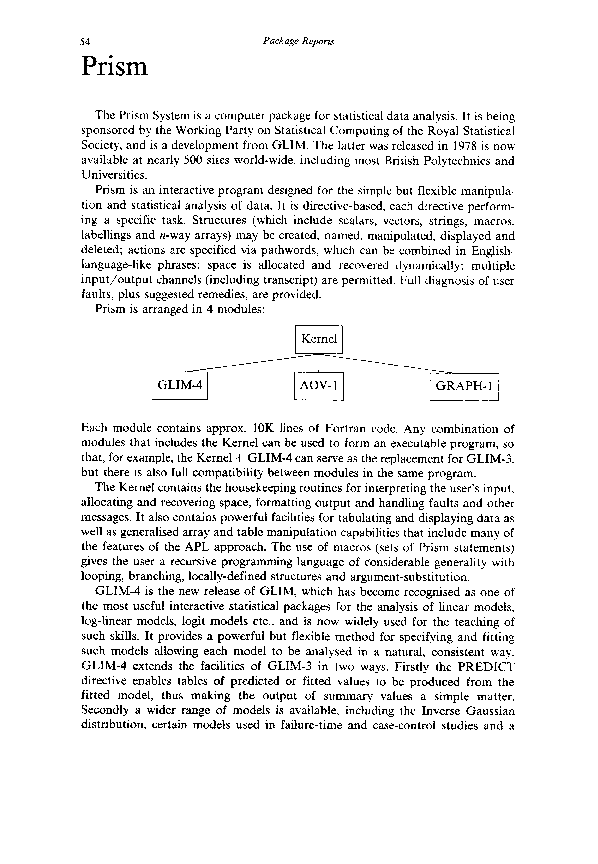
Prism is arranged in 4 modules:
[Kernel]
[OL, r
I ovl]
IOR -I
Each module contains approx. 10K lines of Fortran code. Any combination of
modules that includes the Kernel can be used to form an executable program, so
that, for example, the Kernel + GLIM-4 can serve as the replacement for GLIM-3,
but there is also full compatibility between modules in the same program.
The Kernel contains the housekeeping routines for interpreting the user's input,
allocating and recovering space, formatting output and handling faults and other
messages. It also contains powerful facilities for tabulating and displaying data as
well as generalised array and table manipulation capabilities that include many of
the features of the APL approach. The use of macros (sets of Prism statements)
gives the user a recursive programming language of considerable generality with
looping, branching, locally-defined structures and argument-substitution.
GLIM-4 is the new release of GLIM, which has become recognised as one of
the most useful interactive statistical packages for the analysis of linear models,
log-linear models, logit models etc., and is now widely used for the teaching of
such skills. It provides a powerful but flexible method for specifying and fitting
such models allowing each model to be analysed in a natural, consistent way.
GLIM-4 extends the facilities of GLIM-3 in two ways. Firstly the PREDICT
directive enables tables of predicted or fitted values to be produced from the
fitted model, thus making the output of summary values a simple matter.
Secondly a wider range of models is available, including the Inverse Gaussian
distribution, certain models used in failure-time and case-control studies and a
�Package Reports
55
general facility for forming conditional and marginal models.
The AOV module analyses all generally balanced designs. These include most
commonly-occurring experimental designs, such as randomised blocks, Latin
squares, Graeco-Latin squares and other orthogonal designs, as well as designs
with balanced confounding, like balanced lattices and balanced incomplete block
designs. Many partially-balanced designs can also be handled. Designs may have
more than one error term, as with the split-plot design or in repeated-measures
designs. The output includes the analysis of variance tables, tables of means with
their standard errors, tables of effects, contrasts between effects etc. Full analysis
of covariance and treatment of missing values are available. AOV uses the same
algorithm as the ANOVA directive of Genstat, and has similar syntax.
The new GRAPH module is an easy-to-use, device-independent program for
producing high quality graphic output. Standard statistical capabilities include
histograms, bar-charts, scatterplots, pie-charts, etc. Other standard features include surface views, contour plots, line-charts, etc. Additionally, low-level features
such as the drawing of lines, markers, axes, labelling, colouring, area-infill, etc.,
permit the creation of user-designed graphics; similarly, more complex features
such as the provision of picture segments, input devices, multiple work-stations,
generalised text drawing, together with the Prism macro facilities, enable very
complex pictures to be displayed and manipulated. To ensure device-portability
G R A P H has been written in terms of the new ISO draft graphics standard, GKS.
An implementation of GKS, up to version 7.0, will also be available with
GRAPH.
Prism is due for release towards the end of 1983. Prices will not be available
until nearer the release date.
•
Minitab
Minitab is a general purpose, interactive statistics package. The design and
syntax was originally based on Omnitab, a computer program developed at The
National Bureau of Standards. Minitab is very easy to use: researchers and
students who have no experience with computers can make effective use of
Minitab with about one hour of instruction. Minitab has been found especially
useful for exploring data in the early phases of analysis, for producing plots,
tables, and other descriptive summaries, and for regression analysis.
Users of Minitab are in most areas of business, industry, government, and
education. They include engineers, biologists, chemists, sociologists, psychologists,
accountants, statisticians, teachers, and students.
As with most statistical software, Minitab is in a state of evolution. Its
capabilities in 1982 include:
(1) Descriptive statistics such as mean, medians, and maximums.
�
 Berthold Horn