Slotline Operating within a Wide Frequency Band: Excitation of Waves
by a Real Source
Vaclav Kotlan1, Jan Machac1, Francisco Mesa2
1
Czech Technical University in Prague, Technicka 2, 16627 Prague, Czech Republic
2
University of Seville, 41012 Seville, Spain
Abstract — This paper presents a full wave analysis of a
slotline including the excitation source. All kinds of modes are
taken into account, including a bound mode, leaky modes, and a
residual wave. The line is excited by the source of constant
current connected across the line slot. The paper specifies more
correctly or improves some of our views about wave transmission
along the slotline obtained by an eigen mode analysis. This
considers namely slotline applications and wide frequency bands.
The theoretically predicted results are verified by experiments
and by simulations in the CST Microwave Studio.
Index Terms — Bound mode, leaky waves, microstrip line,
slotline, spectral domain method.
I. INTRODUCTION
Planar transmission lines are the basic building blocks of all
planar microwave circuits, and thus they have been of great
interest to many researchers in the last four decades [1]. There
have been many studies of the properties of waves
propagating along the slotline, aimed at determining their
dispersion characteristics and characteristic impedance [2].
However, the slotline, like other transmission lines, is capable
of exciting leaky waves in addition to transmitting the bound
mode [3]. These leaky waves affect the behavior of the line, as
they may cause strong attenuation of the transmitted signal.
The dispersion characteristics were determined by solving the
eigenmode problem, in the first studies, e.g., in [2], [3]. As a
result one gets propagation constants and field distribution of
modes that can propagate along the line. A superior way of
analysis takes into account a source that excites a field on the
transmission line [4]. Here we have a tool for determining the
real field of a total wave on a line. Choosing properly the
integration path, we can even determine the particular
components of this wave with proper amplitudes.
Most work with planar transmission lines has focused on
microstrip lines and various strip lines. Waves excited by a
voltage source connected into a gap in the strip of the
microstrip line were studied in [4], [5], and in the case of
striplines in [6].
This paper presents the results of an investigation of a
slotline fed by a current source connected across the slot. The
distribution of the voltage along the slotline of the excited
wave is calculated using the spectral domain method [4]. The
calculated voltage distributions have been verified by
measuring the electric field along the line and by simulating
the slotline structure at the CST Microwave Studio. These
document that the excited wave is composed of a bound mode
and leaky modes, together with a residual wave. In this way
we obtain a precise picture of the wave behavior in a wide
frequency band, including inside a spectral gap predicted by
the eigenmode analysis. The field distribution, and therefore
the slotline transmission properties, evolve continuously with
raised frequency. The total wave excited on the slotline “does
not see” the spectral gap, when its frequency increases, and is
excited in accordance with [7] even in this gap.
II. EIGENMODE ANALYSIS VERSUS EXCITATION PROBLEM
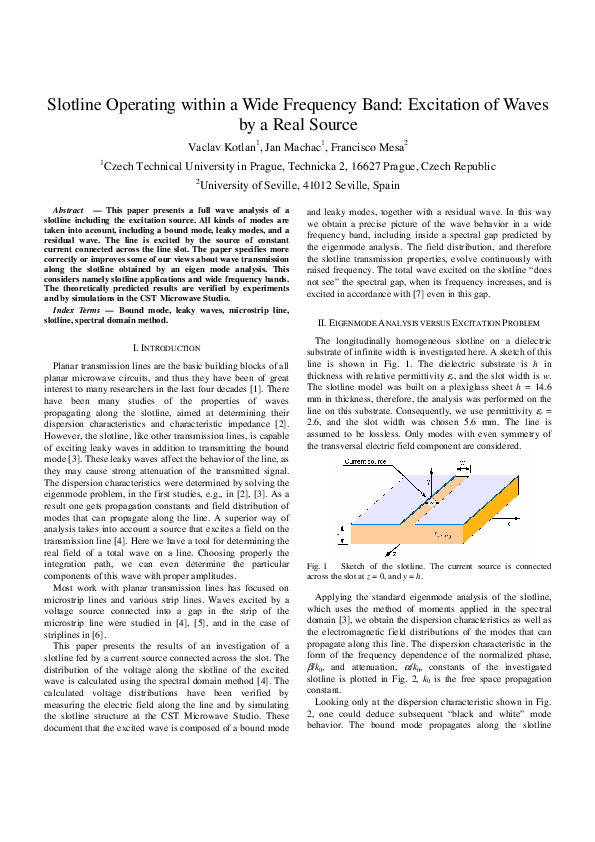
The longitudinally homogeneous slotline on a dielectric
substrate of infinite width is investigated here. A sketch of this
line is shown in Fig. 1. The dielectric substrate is h in
thickness with relative permittivity εr, and the slot width is w.
The slotline model was built on a plexiglass sheet h = 14.6
mm in thickness, therefore, the analysis was performed on the
line on this substrate. Consequently, we use permittivity εr =
2.6, and the slot width was chosen 5.6 mm. The line is
assumed to be lossless. Only modes with even symmetry of
the transversal electric field component are considered.
Fig. 1
Sketch of the slotline. The current source is connected
across the slot at z = 0, and y = h.
Applying the standard eigenmode analysis of the slotline,
which uses the method of moments applied in the spectral
domain [3], we obtain the dispersion characteristics as well as
the electromagnetic field distributions of the modes that can
propagate along this line. The dispersion characteristic in the
form of the frequency dependence of the normalized phase,
β/k0, and attenuation, α/k0, constants of the investigated
slotline is plotted in Fig. 2, k0 is the free space propagation
constant.
Looking only at the dispersion characteristic shown in Fig.
2, one could deduce subsequent “black and white” mode
behavior. The bound mode propagates along the slotline
�β/k0
starting from zero frequency up to its cutoff frequency [3],
read from Fig. 2, at 5.3 GHz. For this line, there is a “spectral
gap” that is rather wide, up to 6.15 GHz. Within this gap, the
dispersion equation complex solution corresponding to the 1st
leaky mode sets in at 5.7 GHz, and this mode starts to be
physical at 6.15 GHz, where its phase constants become lower
than the TM0 surface mode propagation constant kTM0. The
dispersion equation complex solution corresponding to the 2nd
leaky mode sets in at about 4.1 GHz, the cutoff frequency of
the TE1 surface mode. This mode starts to be physical at 4.9
GHz, where its phase constant becomes lower than the TE1
surface mode propagation constant kTE1. The eigenmode
analysis does not, however, tell us if the modes are actually
excited and at which amplitude, i.e., which part of the power
delivered by a real source goes to a particular mode. The
reason is the absence of a source in the analysis.
different frequencies, as shown in Fig. 3. A first conclusion
drawn from this figure is that there are no abrupt onsets of
leakage at the frequencies proposed in the dispersion
characteristic of Fig. 2. Similarly, the presence of the “spectral
gap” does not seem to have any effect on this plot. All curves
show a fast decrease in voltage very close to the source caused
by the field evolution itself on the line and then the
interference of the bound mode with all other possibly excited
waves. Far from the source, the voltage at low frequencies is
nearly constant, as expected in a lossless line when only the
bound mode propagates. The bound-mode field amplitude is
equal to the residue at the corresponding pole. This residue, as
well as the amplitude, decreases as the frequency increases.
Starting from 4.5 GHz, the voltage decays due to the energy
leakage. Finally, at some frequency between 5.5 and 6 GHz, it
can be observed that the bound mode disappears, and, at
higher frequencies, the voltage decreases quickly to zero due
to leakage and radiation effects.
2
nonphysical real
U (V)
1.8
1.6
1.4
1.2
0.8
1 leaky
kte1
kTM0
125
2nd leaky
100
k0
1
75
50
1
2
3
4
5
6
7
8
9
25
α/k0
f (GHz)
0
0.3
2nd leaky
1st leaky
0.1
1
2
3
4
5
6
7
8
0
100
200
300
400
500
600
z (mm)
Fig. 3
Voltage calculated along the slotline defined in the text at
various frequencies.
0.2
0
3 GHz
4 GHz
4.5 GHz
5 GHz
5.5 GHz
6 GHz
7 GHz
8 GHz
175
150
st
bound
200
III. DISCUSSION OF RESULTS AND EXPERIMENT
9
f (GHz)
Fig. 2
The normalized phase and leakage constants for the slotline
defined in the text.
Let us first verify the correctness of our results. Fig.4 shows
the transversal component of the electric field at the slot
center, Ex, calculated by the CST Microwave Studio. This
field is a linear measure of the voltage across the slot. Except
for the absolute values caused by non-calibrated measurement,
the behavior of the field distributions at the corresponding
frequencies is exactly the same as the voltage distributions
plotted in Fig. 3. In CST Microwave Studio, the slotline is
modeled using “open” boundary conditions at the substrate
edges (i.e., as with infinite dimensions) and therefore without
reflections at these edges. The slotline was fed by a “point”
source connected across the slot.
Electric field component Ex was measured along the slot
using a computer-driven system taking 1D field distributions
[10]. The main problem of the experiment performed here is
the excitation of a standing wave caused by reflection of the
bound mode at the line end. This is remarkable in the case of
plots taken for frequencies below 5.5 GHz; it has been
observed that the lower the frequency, the higher the
The real source feeding the slotline can be modeled by a
source of a constant current of finite dimensions connected
across the slot. The current supplied by this source is along the
slot, i.e., in z direction, see Fig. 1, modeled by a Gaussian
function. This analysis results in the electromagnetic field
distribution of the wave excited on the slotline [8], [9]. The
particular mode complex propagation constants are equal to
the positions of the poles in the complex kz propagation
constant plane [4]. To this extent, the propagation constants
determined by the code written in the framework of [8]
correspond to the complex propagation constants plotted in
Fig. 2. The calculated voltage distributions were verified by
experiment together with simulations made by the CST
Microwave Studio.
The voltage distribution of a wave excited by a current
source along the slotline defined above was calculated at
2
�two latter waves decay to zero, so finally the wave amplitude
equals the bound mode amplitude. The measured electric field
and the calculated voltage are again normalized with the aim
of comparing their profiles. The field distributions shown in
Fig. 7 are calculated/measured at 8 GHz, so there is no bound
mode included in the total field, which decreases to zero far
from the source. The wave is composed of the residual, 1st,
and 2nd leaky waves.
0.030
U, Ex (arbitrary units)
Ex (V/m)
amplitude of the standing wave. We attribute this spurious
effect to the non-ideal nature of the line termination provided
by the absorbing material bedded on the line end across the
slot. Other problems come from reflections from the substrate
edges, since the slotline was fabricated on a dielectric sheet
with finite dimensions 500x500 mm. Fig. 5 shows a
comparison of the calculated and measured field distributions
at three different frequencies. As the measuring equipment
was not calibrated, the experimental curves are normalized to
obtain comparable magnitudes of the voltage and the electric
field. There is a good agreement between the measured and
calculated data, except for the standing wave character
measured at 4 and 5.5 GHz.
4 GHz
0.025
calculated
measured
0.020
0.015
200
3 GHz
4 GHz
4.5 GHz
5 GHz
5.5 GHz
6 GHz
7 GHz
8 GHz
175
150
125
100
0.010
0.005
0.000
0
100
200
300
75
(a)
50
U, Ex (arbitrary units)
0.050
25
0
400
z (mm)
0
100
200
300
400
500
5.5 GHz
calculated
measured
0.040
600
z (mm)
Fig. 4
Field distributions calculated by the CST Microwave
Studio at various frequencies.
0.030
0.020
Figs. 6 and 7 show a problem raised when comparing the
voltage of the total wave excited along the slotline with the
distributions of the bound mode and the 1st and 2nd leaky
waves (whose amplitudes are equal to the residues at the poles
and the propagation constants to the pole positions in the kz
complex plane). These normalized propagation constants are:
at 5 GHz, β/k0=1.39388 for the bound mode and β/k0=1.04694
α/k0=0.26825 for the 2nd leaky wave; at 8 GHz, β/k0=1.40471
α/k0=0.06142 for the 1st leaky wave and β/k0=1.10007
α/k0=0.22584 for the 2nd leaky wave. The figures show that
the total wave amplitude decreases more slowly than the field
of the leaky waves. The difference between the field
magnitudes of the total wave and the leaky waves together
with the bound mode has been explained by the existence of
the residual wave [5]. Consequently, this residual wave, which
represents the continuous wave spectrum of the excited field
not related to leaky waves, is responsible for the slower decay
of the field and, far away from the source, it dominates over
the leaky waves (assuming there is no propagating bound
mode). The plots shown in Figs. 6 and 7 verify that the
residual wave does not decrease exponentially like a leaky
wave, but decays algebraically as z-3/2 as described in [6]. For
comparison, a function decreasing as z-3/2 is plotted in Figs. 6
and 7, in Fig. 6 at 5 GHz this function is offset by the bound
mode amplitude.
At 5 GHz in Fig. 6 the excited wave is composed of the
bound mode, the residual wave, and the 2nd leaky wave. The
0.010
0.000
0
100
200
300
400
z (mm)
(b)
U, Ex (arbitrary units)
0.015
7 GHz
calculated
measured
0.010
0.005
0.000
0
100
200
300
400
z (mm)
(c)
Fig. 5
Measured and calculated field distributions along the
slotline at 4 GHz (a), 5.5 GHz (b), and 7 GHz (c).
IV. CONCLUSIONS
This paper studies the important practical issue of the
electromagnetic behavior of the slotline in a wide frequency
band. The waves propagating along the slotline are excited by
3
�The present analysis also shows that there are no sharp
boundaries between the specific frequency ranges of
propagation of particular waves predicted by eigenmode
analysis. The character of the excited wave varies
continuously, and, therefore, the field decay caused by leakage
losses evolves gradually with increasing frequency. In view of
this, it would not be so important to keep strictly the
application of the slotline in microwave circuits according to
the limits determined by the cutoff frequencies resulting from
a pure eigenmode analysis, like that performed in [3]. This is
in full correspondence to the naturally continuous (rather than
steplike) behavior observed for this line.
U, Ex (arbitrary units)
a current source of finite dimensions. The field distributions of
these waves are calculated by the spectral domain method.
Measurements of the field distributions together with the
simulations done by the CST Microwave Studio fully validate
the theoretical results.
The behavior of waves on the slotline is different from that
in the microstrip line. The bound mode propagates along the
microstrip line in a relatively wide frequency band and the
leaky modes are excited simultaneously with it. This means in
practice that the attenuation due to the leaky waves is not so
severe here.
200
5 GHz
175
measured
calculated
bound
nd
2 leaky
-3/2
approximation z
+ bound
150
125
100
75
ACKNOWLEDGEMENT
Experiment in this work has been supported by the Grant
Agency of the Czech Republic under projects 102/09/0314
“Investigation of Metamaterials and Microwave Structures
with the Help of Noise Spectroscopy and Magnetic
Resonance”, participation at IMS and paper presentation by
project 102/08/H018 “Modelling and Simulation of Fields”,
and simulation by the Spanish Ministerio de Educación y
Ciencia and European Union FEDER funds, project
TEC2007-65376.
50
25
0
0
100
200
300
400
U, Ex (arbitrary units)
z (mm)
Fig. 6
Calculated voltage and measured field of the total wave on
the analyzed slotline together with the distributions of the bound
mode, the 2nd leaky wave and function decreasing as z-3/2
superimposed on the bound mode. The frequency is 5 GHz.
REFERENCES
[1] K. C. Gupta, R. Garg, I. J. Bahl, “Microstrip Lines and
Slotlines,” Dedham, Artech House, 1979.
[2] T. Itoh, R. Mitra, “Dispersion Characteristics of Slotline,”'
Electron. Lett., Vol. 7, No 13, 1971, pp. 364-365.
[3] J. Zehentner, J. Machac, M. Migliozzi, “Upper cut-off frequency
of the bound wave and new leaky wave on the slotline,” IEEE
Transactions Microwave Theory and Techniques, Vol. MTT-46,
No. 4, Apr. 1998, pp. 378-386.
[4] F. Mesa, C. Di Nallo, D. R. Jackson, “The theory of surfacewave and space-wave leaky-mode excitation on microstrip
lines,” IEEE Transactions on Microwave Theory and
Techniques, Vol. 47, No. 2, February 1999, pp. 207-215.
[5] F. Mesa, D. R. Jackson, and M. Freire, “High frequency leakymode excitation on microstrip line,” IEEE Transactions on
Microwave Theory and Techniques, Vol. 49, No. 12, Dec. 2001,
pp. 2206-2215.
[6] D. R. Jackson, F. Mesa, M. J. Freire, D. P. Nyquist, C. Di Nallo,
“An excitation theory for bound modes, leaky modes, and
residual-wave currents on stripline structures,” Radio Science,
Vol. 35, No. 2, February 2000, pp. 495–510.
[7] A. A. Oliner, D. R. Jackson, “On spectral gaps at the transition
between bound and leaky modes,” 1995 International
Symposium on Electromagnetic Theory, URSI, St. Petersburg,
Russia, May 1995, Proc. pp. 764-766.
[8] V. Kotlan, “Analysis of the slotline excited by a real source,”
Diploma Thesis, Czech Technical University in Prague, January
2008 (in Czech).
[9] V. Kotlan, F. Mesa, J. Machac, “Voltage excited along a slotline
by a current source,” PIER, submitted for publication.
[10] B. Holubec, L. Jelinek, J. Machac, J. Zehentner, “Computer
Controlled Measurement of Electromagnetic Fields,” 16th
International Conf. Radioelektronika 2006, Bratislava, Slovakia,
April 2006, CD Rom pp. 284-287.
200
8 GHz
175
calculated
st
1 leaky
nd
2 leaky
approximation z-3/2
measured
150
125
100
75
50
25
0
0
100
200
300
400
z (mm)
Fig. 7
Calculated voltage and measured field of the total wave on
the analyzed slotline, together with the distributions of the 1st and 2nd
leaky waves and function decreasing as z-3/2. The frequency is 8 GHz.
The bound mode in the slotline is excited only up to a
certain cutoff frequency determined exactly by the eigenmode
analysis. At higher frequencies, only the leaky and residual
waves are excited and, therefore, the propagating wave is
attenuated to zero far from the source. However, the residual
wave decays more slowly than a leaky wave, which makes the
attenuation less strong than that corresponding to the leakage
itself. In spite of this, the leaky waves radiate energy into the
substrate. Consequently, the effect of parasitic mutual
coupling between different circuit parts, together with signal
dispersion, still affect the wave transmission along the slotline
regardless the residual wave behavior.
4
View publication stats
�
 Francisco Mesa