The Journal of Neuroscience, March 24, 2004 • 24(12):2877–2885 • 2877
Cellular/Molecular
Spatial Distribution of Calcium Entry Evoked by Single
Action Potentials within the Presynaptic Active Zone
Elliot S. Wachman,1* Robert E. Poage,2* Joel R. Stiles,2,3‡ Daniel L. Farkas,1,4 and Stephen D. Meriney2
Center for Light Microscope Imaging and Biotechnology, Carnegie Mellon University, Pittsburgh, Pennsylvania 15213, 2Department of Neuroscience,
University of Pittsburgh, Pittsburgh, Pennsylvania 15260, 3Mellon College of Science and Pittsburgh Supercomputing Center, Carnegie Mellon University,
Pittsburgh, Pennsylvania 15213, and 4Department of Pathology, University of Pittsburgh Medical Center, Pittsburgh, Pennsylvania 15261
1
The nature of presynaptic calcium (Ca 2⫹) signals that initiate neurotransmitter release makes these signals difficult to study, in part
because of the small size of specialized active zones within most nerve terminals. Using the frog motor nerve terminal, which contains
especially large active zones, we show that increases in intracellular Ca 2⫹ concentration within 1 msec of action potential invasion are
attributable to Ca 2⫹ entry through N-type Ca 2⫹ channels and are not uniformly distributed throughout active zone regions. Furthermore, changes in the location and magnitude of Ca 2⫹ signals recorded before and after experimental manipulations (-conotoxin GVIA,
diaminopyridine, and lowered extracellular Ca 2⫹) support the hypothesis that there is a remarkably low probability of a single Ca 2⫹
channel opening within an active zone after an action potential. The trial-to-trial variability observed in the spatial distribution of
presynaptic Ca 2⫹ entry also supports this conclusion, which differs from the conclusions of previous work in other synapses.
Key words: neuromuscular junction; calcium; imaging; active zone; nerve terminal; presynaptic
Introduction
Fast exocytosis of chemical neurotransmitters from small synaptic vesicles is the primary basis for communication between neurons. Action potential depolarization is known to activate
voltage-gated Ca 2⫹ channels (VGCCs) in specialized “active
zone” (AZ) regions of the nerve terminal, with the ensuing influx
of Ca 2⫹ ions providing a local trigger for fusion of synaptic vesicles with the plasma membrane (Llinas et al., 1995). At most
synapses, and at individual active zones within the frog neuromuscular junction, transmitter release is a low-probability stochastic event (Katz, 1969). This characteristic feature of the release process is believed to be essential to normal brain function
(Goda and Sudhof, 1997).
At most nerve terminals, active zones are organized into small
disk-like structures ⬍0.5 m in diameter (Edwards, 1995). This
small size, together with Ca 2⫹ influx occurring within 1 msec
after an action potential invades the nerve terminal, makes it
Received Aug. 22, 2003; revised Dec. 24, 2003; accepted Jan. 26, 2004.
This work was supported by grants from the National Institutes of Health (NS043396), Muscular Dystrophy
Association, National Science Foundation (BESCO 79483), and The University of Pittsburgh Central Research Development Fund. We thank B. V. Kaminsky, E. Lindsley, and J. James for assistance with image analysis and J. M. Pattillo
and A. Hoerder for providing assistance with some of the experiments.
*E.S.W. and R.E.P. contributed equally to this work.
J.R.S. is the principal author of the mathematical model presented in the on-line Appendix.
Correspondence should be addressed to Stephen D. Meriney, Department of Neuroscience, University of Pittsburgh, 446 Crawford Hall, Pittsburgh, PA 15260. E-mail: meriney@bns.pitt.edu.
E. S. Wachman’s present address: Chromodynamics, 1195 Airport Road, Number 1, Lakewood, NJ 08701.
R. E. Poage’s present address: Department of Biology, University of North Carolina at Pembroke, Pembroke, NC
28372.
D. L. Farkas’s present address: Department of Surgery, Cedars-Sinai Medical Center, 8700 Beverly Boulevard, Los
Angeles, CA 90048.
DOI:10.1523/JNEUROSCI.1660-03.2004
Copyright © 2004 Society for Neuroscience 0270-6474/04/242877-09$15.00/0
difficult to study in detail the spatial distribution of Ca 2⫹ entry.
For these reasons, many experiments addressing Ca 2⫹ influx
during single action potentials have measured time- and volumeaveraged elevations in Ca 2⫹ integrated over entire presynaptic
terminals. A relatively constant increase in intracellular Ca 2⫹, in
response to single action potentials, has been reported at synaptic
sites in rat cortical neuron cultures (MacKenzie et al., 1996) and
in presynaptic terminals in rat cerebellar slices (Forti et al., 2000).
In rat superior collicular neurons, transmitter release was found
to fluctuate widely even when trials were matched with regard to
the magnitude of total Ca 2⫹ influx, suggesting that a significant
source of variability in transmitter release exists downstream of
Ca 2⫹ entry (Kirischuk et al., 1999). The spatial extent of single
action potential-evoked Ca 2⫹ transients has been a focus for
study at the squid giant synapse (Llinas et al., 1992; Smith et al.,
1993), lizard motor nerve terminals (David et al., 1997), and
embryonic frog neuromuscular junctions in vitro (DiGregorio
and Vergara, 1997; DiGregorio et al., 1999). These studies identified spatial gradients in Ca 2⫹ influx but did so in preparations
in which it was difficult to detect heterogeneity in Ca 2⫹ influx
with subactive zone resolution. Despite some evidence to the
contrary (Llinas et al., 1994; Freguelli and Malinow, 1996), many
believe that an action potential normally leads to a uniform
flooding of active zones with Ca 2⫹ (Sudhof and Scheller, 2001),
such that release sites are triggered by overlapping domains of
Ca 2⫹ as 70 –90% of available Ca 2⫹ channels open (Borst and
Sakmann, 1998; Bischofberger et al., 2002).
Unlike the synapses used for the studies described above, the
motor nerve terminal of the adult frog features a long series of
large active zones arranged as linear arrays (Heuser et al., 1974;
Pumplin et al., 1981; Pawson et al., 1998). Each active zone is ⬃1
m in length, with the active zones spaced like railroad ties at
�Wachman et al. • Calcium Entry at the Neuromuscular Junction
2878 • J. Neurosci., March 24, 2004 • 24(12):2877–2885
regular 1 m intervals along the length of the nerve terminal.
Within each linear active zone there are ⬃30 synaptic vesicles
associated closely with a double parallel row of intramembraneous particles presumed to include voltage-gated Ca 2⫹ channels
(Pumplin et al., 1981; Robitaille et al., 1993). In this study, we
took advantage of the size and structural order of active zones at
the adult frog neuromuscular junction, in combination with
high-speed fluorescence imaging, to examine the spatial distribution of Ca 2⫹ influx sites within an active zone during single action potentials.
Materials and Methods
Tissue preparation. Adult frogs (Rana pipiens) were decapitated and
pithed after anesthesia in 0.1% tricaine methane sulfonate solution. The
cutaneous pectoris nerve-muscle preparation was removed bilaterally
and bathed in normal frog Ringer’s solution (NFR) (in mM: 116 NaCl, 1
NaHCO3, 2 KCl, 1.8 CaCl2, 1 MgCl2, 5 HEPES, pH 7.3). The Ca 2⫹sensitive dye Calcium Green-1 (3000 MW, dextran conjugate; Molecular
Probes, Eugene, OR) was loaded through the cut end of the cutaneous
pectoris nerve. The muscle nerve was drawn inside a well, made of petroleum jelly that was filled with dye solution (30 mM in dH20), and the
nerve cut (Peng and Zucker, 1993; Wu and Betz, 1996; Narita et al.,
1998). After 7 hr of loading at room temperature, the preparation was
rinsed in NFR and stored at 4°C for 3 hr. After this loading procedure, the
preparation was pinned over an elevated Sylgard (Dow Corning, Midland, MI) platform in a 35 mm dish mounted on a microscope stage. The
cutaneous pectoris nerve was drawn into a suction electrode for stimulation at 5⫻ threshold as determined by observation of muscle twitch
after a single nerve stimulus. This stimulus-evoked muscle twitch was
always present and confirmed functional health of the preparation after
the loading procedure. The preparation was exposed to 2 g/ml tetramethylrhodamine isothiocyanate (TRITC) ␣-bungarotoxin (␣-BTX) for
10 min to label postsynaptic acetylcholine receptors. This labeling was
used to aid in locating and focusing on postsynaptic receptor bands
adjacent to the presynaptic active zones. Nerve terminals were chosen for
study if they were superficially positioned on the muscle and if the majority of the terminal was in a single focal plane as judged by ␣-BTX
staining. All Ca 2⫹ imaging was performed in NFR with 10 M curare
added to prevent nerve-evoked muscle contractions that were not completely blocked by the TRITC ␣-BTX labeling procedure.
Calcium imaging and analysis. We used an acousto-optic tunable filter
(AOTF) approach to control the excitation of the fluorescent dye with
submillisecond time resolution (Wachman et al., 1997). This approach
also allows for rapid switching of excitation and emission wavelengths.
The AOTF filter system (ChromoDynamics, Lakewood, NJ) is based on a
custom TeO2 crystal (NEOS Technologies, Melbourne, FL) and was controlled by an arbitrary waveform generator (LW420; LeCroy, Chesnut
Ridge, NY) that was used to select wavelengths and gate the output of a
krypton-argon laser (Innova 70 spectrum; Coherent, Santa Clara, CA).
This light was fiber-coupled into the epi-illumination port of an upright
fluorescence microscope equipped with appropriate rejection filters and
a 100⫻ water-immersion long-working distance objective with 1.0 numerical aperture (Lumplan–FL-IR; Olympus, Tokyo, Japan). Calcium
Green-1 was excited with the 488 nm line of the laser, and TRITC ␣-BTX
was excited with the 567 nm line. Timing and duration of illumination
were controlled by activation of the arbitrary waveform generator with a
gate pulse obtained from a pulse generator (8013A; Hewlett-Packard,
Palo Alto, CA) triggered simultaneously with nerve stimulation. The
laser delivered ⬃400 J of 488 nm light to the area of interest during our
brief 1 msec illumination pulses. To provide the high-sensitivity, lownoise detection necessary to measure fluorescence changes during single
1 msec exposures, images were recorded on a liquid nitrogen-cooled,
back-thinned CCD camera (LN 1300B; Roper Scientific, Trenton, NJ).
Using this camera, we sampled photons with an estimated spatial resolution of 0.275 m. Using our approach, we did not detect bleaching of
our dye, and raw resting photoelectron counts ranged between 3000 and
9000 per pixel within dye-loaded nerve terminals. Shot noise was the
major contributor to resting fluctuations in fluorescence intensity. Flu-
orescence changes during nerve stimulation were clearly above resting
fluctuations as shown by plots of the distribution of pixel intensities in
the presence and absence of nerve stimulation (see Figs. 1 E, 3B, 4 B, 5B).
The histograms in Figures 1 E, 3B, 4 B, and 5B were taken from well
focused regions of the nerve terminal (white box; as determined by
␣-BTX staining of postsynaptic receptor clusters) and restricted to pixels
that sampled nerve terminal regions of the image (determined by “masking” the image on the basis of the resting fluorescence intensity) (see Fig.
1C).
Images were collected at 0.5 Hz in sets of 20. The first 10 images were
collected with the stimulator off (background), whereas the next 10 images were collected with the stimulator on (nerve-evoked signals). Images were processed using MATLab. Before analysis, images in each set of
20 were coregistered to correct for slight fluctuations in the lateral position of the preparation during the course of acquisition. Differences in
fluorescence above rest were determined for individual images by subtracting mean resting fluorescence (generated by averaging the 10 background images). The resulting “difference images” were displayed using
a pseudocolored representation of difference pixel intensity divided by
resting fluorescence (⌬F/F; expressed as a percentage above rest).
For quantitative analysis of experimental manipulations (see Figs. 3D,
4 D, 5D), we included only intensities that were, with 95% confidence,
brighter than resting fluorescence fluctuations (two SDs above the
mean). The range of resting fluorescence fluctuations within the nerve
terminal was determined empirically from the intensity histograms for
difference images generated by subtracting the average resting signal
from each of the 10 resting images (nerve stimulation off). The range
over which these resting fluctuations extend is critical for quantifying the
effects of the experimental manipulations, because combining data from
nerve-evoked signals with contributions from resting fluctuations will
skew cumulative frequency plots to the left after a fraction of the nerveevoked signal is blocked. For the analysis of total signal intensity changes
after experimental manipulations, we included only pixel intensities that
were brighter than resting fluorescence fluctuations (as defined above).
This technique was applied to each terminal individually. This “signalabove-rest” was also used in analysis and characterization of individual
“Ca 2⫹ entry sites.” In our images of nerve-evoked Ca 2⫹ signals, Ca 2⫹
entry sites were defined as pixels that detected a signal that was greater
than resting fluctuations (as defined above). Because Ca 2⫹ signals within
single active zone regions were detected by more than one pixel, and it
was difficult to distinguish discrete calcium entry sites when there were
several in close proximity to one another, we restricted our analysis of
Ca 2⫹ entry sites to a characterization of single pixels that detected a
signal above rest. To quantify these sites, we counted the number of pixels
that measured a signal above rest and calculated the mean intensity of
these pixels. This method allows us to compare quantitative changes after
pharmacological manipulations and is an analysis approach that is expected to be proportional to true Ca 2⫹ entry sites.
The use of signal-above-rest in our analysis, as described above, is
necessary for plots of the distribution of stimulus-evoked pixel intensities
after experimental manipulation and to characterize the number of Ca 2⫹
entry sites. However, use of these thresholded images to quantify graphically spatial variability in the nerve-evoked Ca 2⫹ signal creates some
potential problems of interpretation. Although a graphic representation
of variability in the spatial location of Ca 2⫹ entry sites with repeated
stimulation is easy to demonstrate after thresholding the images (data
not shown), the exclusion of pixels using a thresholding approach to
create a graphic image may create the appearance of greater variability
than actually exists in the raw signal. Therefore, to avoid the potential of
overestimating variability, we demonstrated variability in the spatial distribution of Ca 2⫹ entry using difference images that include all data,
including pixel intensities that fall within the resting fluctuation range
(see Fig. 6).
Results
Dextran-conjugated Calcium Green-1 was loaded into presynaptic terminals of the adult frog neuromuscular junction through
the cut end of the motor nerve (see Materials and Methods). To
detect action potential-evoked changes in intracellular Ca ⫹2, im-
�Wachman et al. • Calcium Entry at the Neuromuscular Junction
J. Neurosci., March 24, 2004 • 24(12):2877–2885 • 2879
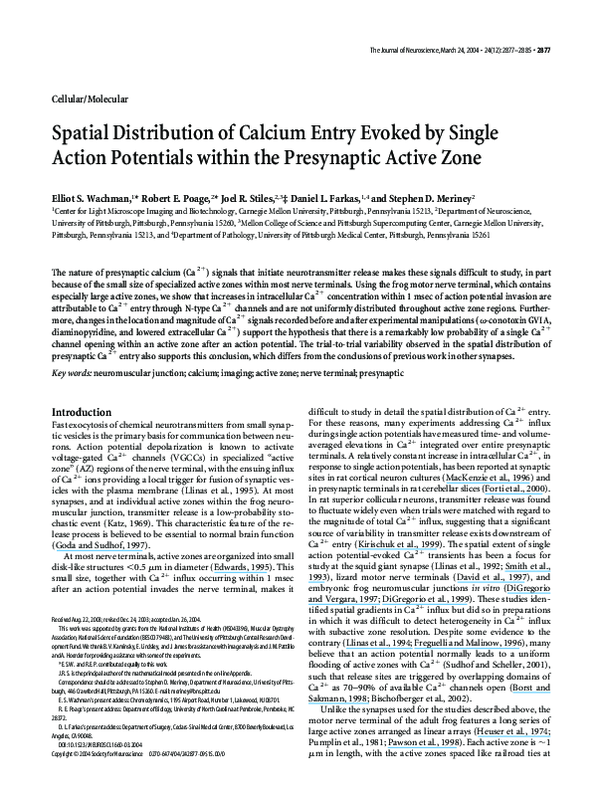
Figure 1. Nerve-evoked Ca 2⫹ entry during a single action potential at the frog neuromuscular junction. A, Gray-scale (top) and pseudocolor representation (bottom) of a difference image
generated by subtraction of the mean resting fluorescence from the fluorescence observed in a single trial in the absence of nerve stimulation. B, Gray-scale (top) and pseudocolor representation
(bottom) of a difference image generated by subtraction of the mean resting fluorescence from the fluorescence observed immediately after nerve stimulation in a single trial. Images in A and B were
collected using 1 msec illumination (in B, this began 1.5 msec after nerve stimulation). The white boxes in the bottom panels of B and C indicate the area of this terminal that is shown in D and used
to generate the histogram shown in E. C, The top panel shows a sample single resting fluorescence image of the nerve terminal (same illumination conditions as in A; gray-scale bar in photoelectron
counts). The bottom panel shows an image mask (red) indicating pixels in the resting fluorescence image that have intensities between 50 and 100% of maximum. This mask identifies those pixels
that sample light from the nerve terminal portion of the image. D, Enlarged region of the stimulus-evoked difference image (from the white box in the bottom panel of B) representing the spatial
distribution of Ca 2⫹ entry (left). The right panel shows the same region of the neuromuscular junction labeled with rhodamine-␣-BTX to show the location of postsynaptic acetylcholine receptors.
E, Histogram showing the distribution of pixel intensities taken from those pixels in the masked nerve terminal portion (red pixels in the bottom panel of C) in the presence and absence of nerve
stimulation. A pseudocolor difference image from this same region is shown in D, but the histogram does not include data from pixels outside the nerve terminal (masked region), because these
off-nerve data would dominate the distribution. The distribution shown in black represents pixel intensities measured in 10 images recorded in the absence of nerve stimulation (defined as “resting
fluctuations”), the distribution shown in red represents pixel intensities measured in 10 images recorded after nerve stimulation, and the dotted blue line represents the limit of two SDs above the
resting fluctuation distribution after fit to a single Gaussian. The pseudocolor scale bar is the same for the bottom panels in A and B and the left panel in D, and is expressed as ⌬F/F (%). Scale bars,
2 m.
ages were collected at low frequency (0.5 Hz) with an illumination window of 1 msec. Ten images were collected at rest, followed by 10 images taken during stimulation of the motor nerve
terminal. The first 10 images of the set were averaged, and the
resulting mean background image was subtracted from each of
the raw images to produce difference images representing
changes above average resting fluorescence in the presence and
absence of a presynaptic action potential. Figure 1 shows difference images generated by subtracting the mean background image from a single resting image (Fig. 1 A) or single nerve-evoked
image (Fig. 1 B). Stimulus-induced Ca 2⫹ signals were detected in
active zone regions of the nerve terminal (as predicted by
␣-bungarotoxin staining of postsynaptic receptor bands) (Fig.
1 D) and exhibited fluorescence intensities well beyond resting
fluctuations in fluorescence intensity (Fig. 1 E). To minimize the
contributions of resting fluctuations in our analyses of the experimental manipulations described below, we defined signalabove-rest as stimulus-evoked pixel intensities greater than two
times the SD of the resting fluctuations in that terminal (i.e.,
those to the right of the dashed blue line in Fig. 1 E) (see Materials
and Methods).
To identify the source of Ca 2⫹ underlying these stimulusdependent signals, we applied 8-(N,N-diethylamino)octyl-3,4,5trimethoxybenzoate hydrochloride (TMB-8), an inhibitor of
Ca 2⫹-induced Ca 2⫹ release (Hunt et al., 1990; Narita et al., 1998)
or -CgTx GVIA, an N-type Ca 2⫹ channel blocker that completely blocks transmitter release from this synapse (Kerr and
Yoshikami, 1984). Action potential-evoked Ca 2⫹ signals were
unaffected by a 30 min treatment with 10 M TMB-8 (data not
shown). In contrast, after 30 min of exposure to 500 nM -CgTx
�2880 • J. Neurosci., March 24, 2004 • 24(12):2877–2885
Figure 2. The observed spatial profile of Ca 2⫹ influx is dependent on the timing of the laser
illumination window. A, Representative difference image of Ca 2⫹entry with an illumination
window of 1 msec duration beginning 1.5 msec after nerve trunk stimulation. B, Representative
difference image of Ca 2⫹ entry with an illumination window of 2 msec duration beginning 1.5
msec after nerve stimulation. The Ca 2⫹ entry signal is more intense (resulting from a doubling
in the dye illumination time) but also more diffusely distributed throughout the nerve terminal.
C, Representative raw difference image of Ca 2⫹ entry with an illumination window of 1 msec
duration beginning 12 msec after nerve stimulation. The Ca 2⫹ entry signal is slightly reduced in
magnitude as compared with A and much more diffusely distributed. The timing of the illumination window is shown schematically in each image. The pseudocolor scale bar is the same for
all panels and is expressed as ⌬F/F (%). Scale bar, 2 m.
GVIA, evoked Ca 2⫹ signals were indistinguishable from unstimulated controls (data not shown). From these results, we
conclude that the observed stimulus-evoked signals arise from
Ca 2⫹ entry through N-type voltage-gated Ca 2⫹ channels, with
little or no contribution of Ca 2⫹-induced Ca 2⫹ release from intracellular stores.
We chose the duration and delay of our illumination window
to reflect the timing of action potential invasion of the nerve
terminal. From our experience with this preparation, we know
that the delay between stimulation of the motor nerve and initial
rise of the postsynaptic response is ⬃1–2 msec (J. Pattillo, R.
Poage, and S. Meriney, unpublished observations). We therefore
used a 1 msec illumination window delayed by 1.5 msec relative
to nerve stimulation. The sites of Ca 2⫹ signals observed under
these conditions were highly localized (Fig. 2 A). As the illumination time was increased (Fig. 2 B) or delayed with respect to a
single nerve stimulus (Fig. 2C), the Ca 2⫹ signals that we detected
were broadened spatially as the stimulus-evoked Ca 2⫹ elevations
diffused through the nerve terminal. We conclude that images of
action potential-induced Ca 2⫹ signals acquired with a 1.5 msec
delay and 1 msec duration represent an accurate depiction of the
spatial distribution of Ca 2⫹ entry in the motor nerve terminal
shortly after action potential invasion.
Experimental manipulation of calcium signals
We evaluated the effects on Ca 2⫹ entry of a partial blockade of
N-type Ca 2⫹ channels. Over the time course of our experiments,
-CgTX GVIA produced an essentially irreversible blockade of
N-type Ca 2⫹ channels (Stocker et al., 1997). We used a short
exposure (5–10 min) to submaximal concentrations of toxin
(200 nM) to evaluate the effects of blocking a fraction of presyn-
Wachman et al. • Calcium Entry at the Neuromuscular Junction
aptic Ca 2⫹ channels on Ca 2⫹ entry. These data address the basic
question: is each discrete Ca 2⫹ entry site that we detect a result of
the Ca 2⫹ flux through very few open Ca 2⫹ channels or the combined flux from clusters of open Ca 2⫹ channels? These two alternatives make clear predictions as to how Ca 2⫹ signals should be
changed as a result of the blockade of a subset of channels after
submaximal exposure to -CgTX GVIA. If each Ca 2⫹ entry site is
generated by a single, or very few Ca 2⫹ channel openings, one
would predict a toxin-induced decrease in the number of Ca 2⫹
entry sites, with no change in the intensity of signal at sites that
remain unblocked. In contrast, if each Ca 2⫹ entry site is generated by Ca 2⫹ flux through a cluster of simultaneously activated
Ca 2⫹ channels, one would predict a decrease in the number of
Ca 2⫹ entry sites, as some drop below detection threshold, and a
decrease in the intensity of signal at those sites that can be
detected.
Figure 3A shows the resting fluorescence signal from a sample
nerve terminal with the selected region of interest, and Figure 3B
shows the distribution of pixel intensities in this region of interest
in the presence and absence of nerve stimulation. Figure 3C
shows representative pseudocolored difference images before
and after partial N-type Ca 2⫹ channel blockade (200 nM -CgTX
GVIA; 7 min). This treatment significantly decreased the total
Ca 2⫹ signal-above-rest by 64.4 ⫾ 8.1% (mean ⫾ SEM; onesample t test; p ⬍ 0.001), but of those Ca 2⫹ entry sites that persisted after blockade, there was no significant change in the average intensity of the fluorescence at each entry site (mean pixel
intensity decreased by 1.6 ⫾ 1.9%; p ⬎ 0.2; n ⫽ 6 nerve terminals). To further quantify these effects, we analyzed the distribution of pixel intensities in the signal-above-rest from these image
sets (see Materials and Methods). Cumulative frequency plots
from the six nerve terminals examined show no significant
change in the distribution of pixel intensities after exposure to
-CgTX GVIA (Fig. 3D) (Kolmogorov–Smirnov test; p ⬎ 0.5).
We observed a significant decrease (by 64.6 ⫾ 8.0%; one-sample
t test; p ⬍ 0.05) in the number of Ca 2⫹ entry sites (see Materials
and Methods), consistent with a decrease in total Ca 2⫹ entry but
with no change in the intensity distribution of the signal. These
data lead us to conclude that the pharmacological elimination of
a fraction of N-type Ca 2⫹ channels reduces the number of Ca 2⫹
entry sites without changing the characteristics of the Ca 2⫹ signal
at sites that are spared. As outlined above, these data favor the
hypothesis that each Ca 2⫹ entry site is generated by the opening
of very few Ca 2⫹ channels.
In control experiments, extracellular Ca 2⫹ was decreased
from 1.8 to 0.5 mM to reduce Ca 2⫹ flux without altering Ca 2⫹
channel gating during the action potential (Fig. 4). A representative resting fluorescence image is shown with the region of interest used for analysis (Fig. 4 A), along with the distribution of
control pixel intensities in the presence and absence of nerve
stimulation (Fig. 4 B). Figure 4C displays representative difference images obtained in both 1.8 and 0.5 mM extracellular Ca 2⫹.
Qualitatively, the effect is very different from that after submaximal -CgTX GVIA exposure; the remaining Ca 2⫹ signals after
low Ca 2⫹ exposure are weaker than the signals that remain after
exposure to -CgTX GVIA (Fig. 3C). Quantitatively, exposure to
low Ca 2⫹ saline resulted in a significant decrease in total Ca 2⫹
signal-above-rest (71.4 ⫾ 11.0% decrease; n ⫽ 3; one-sample t
test; p ⬍ 0.01), coupled with a significant decrease in the average
intensity of pixels that led to that signal (31.8 ⫾ 6.0% decrease;
one-sample t test; p ⬍ 0.05). In this case, there was also a significant decrease in the number of pixels that detected Ca 2⫹ entry
�Wachman et al. • Calcium Entry at the Neuromuscular Junction
J. Neurosci., March 24, 2004 • 24(12):2877–2885 • 2881
Variability in the spatial distribution of
calcium entry
Based on freeze fracture data from the
adult frog neuromuscular junction, it has
been suggested that there are many N-type
Ca 2⫹ channels in each active zone (Heuser
et al., 1974; Pumplin et al., 1981). If only a
small number of those channels are activated during an action potential, we expect
Ca 2⫹ entry during repeated low frequency
stimulation to exhibit prominent spatial
variability. In Figure 6 A, we show a
pseudocolored difference image depicting
the spatial distribution of Ca 2⫹ entry sites
in a single stimulus trial from a representative nerve terminal. In Figure 6 B, we
chose a well focused region of interest to
display variability in the spatial distribuFigure 3. Effects of a 7 min exposure to 200 nM -CgTX GVIA on Ca 2⫹ entry after nerve stimulation. A, Sample resting tion of Ca 2⫹ entry sites over four stimulus
fluorescence image of the nerve terminal (gray-scale bar in photoelectron counts) with the well focused region of interest defined trials. These pseudocolored representaby the white box. B, Histogram showing the distribution of pixel intensities in the presence and absence of nerve stimulation as tions show that the spatial distribution of
described in Figure 1 E. C, Representative difference images before (top panel) and after (bottom panel) partial blockade of N-type Ca 2⫹ entry sites is not consistent from one
Ca 2⫹ channels. Pseudocolor scale bar applies to both images and is expressed as ⌬F/F (%). D, Cumulative frequency distribution stimulus to the next. In fact, there are
of pixel intensity values measured before (solid line) and after (dashed line) partial blockade of N-type Ca 2⫹ channels. In six
many pixels over active zone regions of the
terminals examined in this manner, there were no significant differences in the distribution of pixel intensities. Scale bars, 2 m.
nerve terminal where Ca 2⫹ signals are detected in only a subset of stimulus trials
(Fig. 6 B). Our imaging data show spatial
above rest (78.1 ⫾ 14.0%) as weaker Ca 2⫹ entry sites slipped into
variability during multiple action potential trials that is greater
the noise after exposure to the lowered extracellular Ca 2⫹.
than resting fluctuations, suggesting that Ca 2⫹ entry during an
To demonstrate that we could detect the effects of increasing
action potential does not uniformly “flood” the active zone reCa 2⫹ influx at entry sites, we exposed the preparation to a potasgion of the nerve terminal (Fig. 6 B), at least not until well after
sium channel blocker [3,4-diaminopyridine (DAP)], which intransmitter release occurs (Fig. 2). These data are consistent with
creases Ca 2⫹ influx and transmitter release by broadening the
the hypothesis that Ca 2⫹ entry into the frog motor nerve terminal
presynaptic action potential (Kirsch and Narahashi, 1978; Duduring action potential depolarization is variable, with respect to
rant and Marshall, 1980) (Fig. 5). A broadened presynaptic action
spatial location from one stimulus to the next, primarily because
potential increases Ca 2⫹ entry by providing a longer depolarizing
very few Ca 2⫹ channels open during any given action potential.
2⫹
stimulus that activates a greater proportion of available Ca
channels and allows activated channels the opportunity to move
Discussion
into the open state a greater number of times during each action
Calcium entry sites in nerve terminals of the adult frog
potential. A representative resting fluorescence image is shown
neuromuscular junction
with the region of interest used for analysis (Fig. 5A), along with
We used a fast “snapshot” approach to imaging Ca 2⫹ entry into
the corresponding distribution of control pixel intensities in the
adult frog motor nerve terminals and studied the spatial distribupresence and absence of nerve stimulation (Fig. 5B). Figure 5C
tion of Ca 2⫹ entry during single action potential stimuli at low
displays representative difference images obtained in control and
frequency. Using this approach, we observed spatially isolated
DAP-treated conditions. After a 10 –20 min exposure to 5 M
sites of Ca 2⫹ entry in active zone regions of the nerve terminal
2⫹
DAP, the total Ca entry was increased by 410.4 ⫾ 224.0%, and
that disperse with time after action potential invasion and vary in
the mean intensity of each pixel that detected a signal-above-rest
their location with repeated trials. Furthermore, a partial blockincreased by 170.0 ⫾ 33.2% (n ⫽ 3). The number of pixels that
ade of the N-type Ca 2⫹ channels that mediate this Ca 2⫹ entry
detected a signal above rest also increased (by 225.1 ⫾ 92.0%).
results in a decrease in the number of Ca 2⫹ entry sites with no
Cumulative frequency plots generated from these controls
change in the intensity of signal at remaining sites.
(Figs. 4 D, 5D) were very different from those generated after
In interpreting these data, we considered the probable numexposure to -CgTX GVIA (Fig. 3D). Reduction of extracellular
ber of calcium channels in the active zone that are sampled by
Ca 2⫹ led to a significant shift toward lower intensities (Fig. 4 D)
each pixel and the activation of these channels by action potential
(Kolmogorov–Smirnov test; p ⬍ 0.001), whereas exposure to
stimuli. Each linear active zone in the adult frog neuromuscular
DAP led to a significant shift toward higher intensities (Fig. 5D)
junction is ⬃1 m long and separated from other active zones by
(Kolmogorov–Smirnov test; p ⬍ 0.001). The contrasting effects
⬃1 m. Freeze-fracture data demonstrate that there are ⬃200
of these three manipulations demonstrate our ability to detect
active zone particles distributed in two parallel double rows along
both increases and decreases in Ca 2⫹ influx at these discrete sites
the length of the active zone (Heuser et al., 1974; Pumplin et al.,
and strengthens our interpretation of the effects of partial block1981; Pawson et al., 1998). Based on fluorescent staining of these
ade of N-type Ca 2⫹ channels using -CgTX GVIA. Taken as a
linear zones with labeled toxins selective for both calcium and
whole, these data support the hypothesis that each Ca 2⫹ entry site
calcium-activated potassium channels (Robitaille et al., 1993),
is generated by the opening of very few, perhaps only one Ca 2⫹
and the expectation that other active zone proteins might also be
represented, these active zone particles likely represent several
channel (see Discussion).
�2882 • J. Neurosci., March 24, 2004 • 24(12):2877–2885
Figure 4. Effects of 5 min exposure to low Ca 2⫹ saline on Ca 2⫹ entry after nerve stimulation. A, Sample resting fluorescence image of the nerve terminal (gray-scale bar in photoelectron counts) with the well focused region of interest defined by the white box. B, Histogram
showing the distribution of pixel intensities in the presence and absence of nerve stimulation as
described in Figure 1 E. C, Representative difference images in normal Ca 2⫹ (1.8 mM; top panel)
and after exposure to 0.5 mM Ca 2⫹ (bottom panel). Pseudocolor scale bar applies to both
images and is expressed as ⌬F/F (%). D, Cumulative frequency distribution of pixel intensity
values measured before (solid line) and after (dashed line) exposure to 0.5 mM Ca 2⫹. In three
terminals examined in this manner, there was consistently a significant leftward shift (toward
lower intensities) in the distribution of pixel intensities. Scale bars, 2 m.
Wachman et al. • Calcium Entry at the Neuromuscular Junction
classes of membrane proteins, only some of which may be calcium channels. For the purposes of discussion, we will consider a
range of potential calcium channel numbers in a single active
zone. On one extreme, on the basis of the number of particles
observed in freeze-fracture replicas, 200 calcium channels per
active zone must be considered the top limit. On the other extreme, it is possible that each vesicle-docking site might only be
associated with a single calcium channel. Because there are ⬃30
vesicles associated with the release site membrane along a single
active zone, 30 calcium channels might be considered the bottom
limit. Because the resolution of our imaging system is 0.275 m,
we can detect differences in the spatial distribution of Ca 2⫹ entry
within single active zones. Because, as mentioned, each active
zone is ⬃1 m in length, we sampled each linear active zone with
a linear array of approximately four pixels. Therefore, in estimating how many Ca 2⫹ channels might be sampled by a single pixel
in our experiments, we must divide the range of probable calcium
channels sampled in an active zone by four. As such, somewhere
between 6 and 50 calcium channels might be under each pixel
that samples a portion of a single active zone.
Conceptually, if we consider the range of estimates for the
number of calcium channels that might be sampled by a single
pixel and the range of possibilities for the likelihood that an
N-type calcium channel will open during a single action potential
stimulus, we can determine whether we would expect to observe
a graded calcium signal or one that includes a significant number
of failures during low-frequency action potential stimuli. If there
are many calcium channels (⬃50) sampled by each of our pixels,
and a relatively high probability (greater than ⬃0.2) for calcium
channel opening during an action potential stimulus, our calculations (see Appendix; available at www.jneurosci.org) predict a
calcium signal that is little changed with repeated trials and shows
a graded change in intensity after partial blockade of calcium
channels using -CgTX GVIA. This is clearly not what we observed. In contrast, if there are few calcium channels sampled by
each pixel (approximately six) and a relatively low probability
(less than ⬃0.2) for calcium channel opening during an action
potential stimulus, our calculations predict a calcium signal that
shows large variability with repeated trials (including the failure
to detect signal in some trials), some increase in the number of
trials in which there is a failure to detect calcium signal after
partial blockade by -CgTX GVIA, and no change in the intensity
of signal detected at entry sites that remain unblocked. Our data
are consistent with this prediction.
The mathematical simulation presented in the Appendix
(available at www.jneurosci.org) provides quantitative details of
predicted changes in calcium signals for various numbers of calcium channels per active zone and various probabilities for calcium channel opening. We can draw three conclusions from this
analysis. First, using a range of reasonable estimates for the number of calcium channels that might be sampled by each pixel, it
appears possible that single action potential stimuli could generate a local (subactive zone) calcium signal from a single calcium
channel opening, and that these signals would show considerable
variability with repeated trials. Second, after a blockade of ⬃65%
of available calcium channels (using low doses of -CgTX
GVIA), it is reasonable to expect an increase in the number of
trials in which there is a failure of any available calcium channel
under a single pixel to open, and that this would be coupled with
little or no change in the intensity of signal at sites that remain
unblocked. Finally, on the basis of our imaging data, this analysis
suggests that very few of the Ca 2⫹ channels that populate a frog
motor nerve terminal active zone open with each action potential
�Wachman et al. • Calcium Entry at the Neuromuscular Junction
J. Neurosci., March 24, 2004 • 24(12):2877–2885 • 2883
stimulus, and that this would not occur unless there are relatively
few calcium channels in an active zone (⬃30), each with a low
probability for opening during an action potential (less than
⬃0.2).
Relationship between calcium entry and transmitter release at
active zones
Our work addresses a point of debate regarding the manner in
which Ca 2⫹ triggers neurotransmitter release from the active
zone (Dunlap et al., 1995; Neher, 1998). Is each synaptic vesicle
fusion event triggered by the Ca 2⫹ flux through one Ca 2⫹ channel, or by the Ca 2⫹ that accumulates when many local Ca 2⫹
channels open near a release-ready synaptic vesicle? It seems
likely that either situation can occur, depending mostly on which
synapse is being studied. In particular, the organization of the
active zone, the fraction of Ca 2⫹ channels that open with each
action potential, and the conditions of the experiment may alter
the stoichiometry between Ca 2⫹ entry sites and vesicle fusion
events.
In the calyx of Held synapse from the auditory brainstem of
the rat, a large fraction of the available presynaptic Ca 2⫹ channels
is believed to open after a single action potential and transmitter
release appears to be triggered by the combined action of multiple
Ca 2⫹ channels (Borst and Sakmann, 1996, 1998, 1999). In the
calyx of Held, there may be large clusters of Ca 2⫹ channels
around which synaptic vesicles are arranged at varying distances
from these clusters (Meinrenken et al., 2002). Similarly, at mossy
fiber boutons in the rat hippocampus, ⬃90% of available Ca 2⫹
channels are thought to be activated by a single action potential
(Bischofberger et al., 2002). In contrast, a small percentage of
available Ca 2⫹ channels is thought to be activated by an action
potential at the squid giant synapse (Llinas et al., 1981), and
transmitter release may be triggered by the local flux of Ca 2⫹
through single channel openings (Augustine et al., 1991). At the
adult frog neuromuscular junction, where there is a long linear
arrangement of Ca 2⫹ channels and release-ready synaptic vesicles, our data support the possibility that an exocytotic event
might be triggered by the opening of a single Ca 2⫹ channel (Yoshikami et al., 1989), similar to the stoichiometry proposed for
the chick ciliary ganglion calyx (Stanley, 1993; Bertram et al.,
1996). Therefore, we hypothesize that the low probability of
transmitter release from each active zone at the adult frog neuromuscular junction may be primarily a function of a low probability for Ca 2⫹ channel opening.
Robitaille et al. (1993) showed that EGTA (a relatively slow
calcium buffer) introduction into the adult frog motor nerve
terminal could reduce transmitter release by a small degree.
These results could be interpreted to suggest that transmitter
release may be triggered by the summed Ca 2⫹ influx from clusters of Ca 2⫹ channels distributed over a relatively large distance.
In the interpretation of these data, it is useful to consider the
probability of transmitter release at each active zone. Although
the frog neuromuscular junction on the whole is a strong synapse
containing hundreds of active zones, within each active zone
there are ⬃30 potential vesicle-docking–release sites, each with a
Figure 5. Effects of 15 min exposure to a potassium channel blocker (5 M DAP) on Ca 2⫹
entry after nerve stimulation. A, Sample resting fluorescence image of the nerve terminal (grayscale bar in photoelectron counts) with the well focused region of interest defined by the white
box. B, Histogram showing the distribution of pixel intensities in the presence and absence of
nerve stimulation as described in Figure 1 E. C, Representative difference images before (top
panel) and after (middle panel) partial blockade of potassium channels. Pseudocolor scale bar in
the middle panel applies to both the top and middle panel images and is expressed as ⌬F/F (%).
Bottom panel is the same image as shown in the middle panel, except that the pseudocolor
4
scale has been expanded to avoid saturation of the color scale and demonstrate that after DAP
treatment, there is a more uniform increase in nerve terminal Ca 2⫹ than was observed before
treatment (top panel). D, Cumulative frequency distribution of pixel intensity values measured
before (solid line) and after (dashed line) partial blockade of potassium channels. In three
terminals examined in this manner, there was consistently a significant rightward shift (toward
higher intensities) in the distribution of pixel intensities. Scale bars, 2 m.
�2884 • J. Neurosci., March 24, 2004 • 24(12):2877–2885
Wachman et al. • Calcium Entry at the Neuromuscular Junction
very low probability of release. After a single action potential, the probability of a
single vesicle being released from each of
these active zones is less than one, making
the probability of release at each release
site within an active zone very low. With
such a low probability of release at each
active zone, it may not be surprising that
any Ca 2⫹ buffer will have some effect on
release. The stochastic nature of calcium
influx and vesicle fusion results in a distribution of latencies to fusion (Katz and Figure 6. Trial-to-trial variability in nerve-evoked Ca 2⫹ entry during single action potentials. A, Representative difference
Miledi, 1965), and a slow calcium buffer image showing the spatial distribution of nerve-evoked Ca 2⫹ influx in a single stimulus trial. The box indicates the region of the
could exert a small effect on long-latency nerve terminal that is enlarged in B. Pseudocolor scale is the same for all images and is expressed as ⌬F/F (%). Scale bar, 2 m. B,
fusion events, even if the calcium signal is Images from four stimulus trials of the enlarged region of the nerve terminal shown in A, represented with pixel intensity on the
2⫹
localized in space. The effects of EGTA re- z-axis. The left-most panel is taken from the trial shown in A. The trial-to-trial variability in the spatial location of Ca entry sites
is
illustrated
by
the
changes
in
location
of
the
intensity
peaks.
ported by Robitaille et al. (1993) are relatively small (⬃20%) such that in some
sentially prevents a fraction of the available Ca 2⫹ channels from
limited number of instances, EGTA will have a chance to compete
2⫹
responding to action potential stimuli (an effect similar to partial
with the Ca sensor for release. Therefore, even in light of the
blockade by -CgTX GVIA) (Fig. 3). The specific effects of
results of Robitaille et al. (1993), it remains possible that single
G-protein modulation on transmitter release will vary depending
Ca 2⫹ channel openings provide the Ca 2⫹ trigger for release at
on the stoichiometry between open Ca 2⫹ channels and the sensor
this synapse (Yoshikami et al., 1989).
for transmitter release. If the active zone is flooded with Ca 2⫹
after each action potential stimulus and vesicle fusion is triggered
Pharmacologic modulation of nerve terminal function
by the combined action of Ca 2⫹ ions from many channel openPotassium channel blockers can increase transmitter release from
ings, G-protein modulation, which decreased the number of
nerve terminals. These agents broaden the presynaptic action
Ca 2⫹ channel openings, would decrease the overall magnitude of
potential and increase the number of Ca 2⫹ channels that open, as
2⫹
this active zone flood. Under this scenario, the probability for
well as the time during which individual Ca channels will have
vesicle fusion might decrease in a manner consistent with the
the opportunity to move into the open state. These agents have
known nonlinear relationship between Ca 2⫹ and transmitter rebeen used to treat neuromuscular diseases, because they enhance
lease (Dodge and Rahamimoff, 1967; but see Takahashi et al.,
acetylcholine release from weak synapses. In particular, DAP has
1996, 1998). In contrast, our data lead us to hypothesize that at
been the target of several clinical trials directed at treating
the frog neuromuscular junction, G-protein modulation, which
Lambert-Eaton Myasthenic syndrome (Molgo and Guglielmi,
decreases the number of Ca 2⫹ channel openings, would elimi1996; Sanders et al., 2000). If our results from the frog neuromusnate a corresponding fraction of the Ca 2⫹ entry domains entirely
cular junction can be extrapolated to the mammalian neuromusand lead to a linear reduction in the number of vesicle fusion
cular junction, clinical use of DAP may change the stoichiometry
events as entire release sites drop out. By this mechanism, we
between Ca 2⫹ channel openings and vesicle fusion at the neuropredict that even subtle changes in the number of active zone
muscular synapse. If under normal conditions a small proportion
Ca 2⫹ channels that open during action potential stimulation
of available Ca 2⫹ channels opens and each single Ca 2⫹ channel
would significantly vary the number of active transmitter release
opening controls the secretion of one vesicle, we would then
sites and, thus, the efficacy of synaptic transmission.
predict after DAP treatment that the increased Ca 2⫹ influx
through each channel, together with the recruitment of additional Ca 2⫹ channel openings, would lead to more overlap in
References
Artim DE, Meriney SD (2000) G protein modulated Ca2⫹ current with
Ca 2⫹ entry domains. Therefore, after DAP treatment, the com2⫹
slowed activation does not alter the kinetics of action potential-evoked
bined flux through many local Ca channels would trigger each
Ca2⫹ current. J Neurophysiol 84:2417–2425.
2⫹
vesicle fusion event. Under these conditions, Ca would flood
Augustine GJ, Adler EM, Charlton MP (1991) The calcium signal for transthe presynaptic active zone (Fig. 5) causing multiple transmittermitter secretion from presynaptic nerve terminals. Ann NY Acad Sci
containing vesicles to fuse with the plasma membrane at each
635:365–381.
active zone after each action potential stimulus. In this sense,
Bertram R, Sherman A, Stanley EF (1996) Single-domain/bound calcium
hypothesis of transmitter release and facilitation. J Neurophys
DAP treatment could change the manner in which Ca 2⫹ triggers
75:1919 –1931.
vesicle fusion at the active zone.
2⫹
G-protein modulation of transmitter release
Our interpretations of these data are also relevant to the hypothesized effects of neuromodulatory agents on the regulation of
Ca 2⫹ entry and the triggering of transmitter secretion at individual release sites in an active zone. Calcium channels are known to
be common targets for G-protein-mediated modulation (Hille,
1994). In terms of physiological importance, it appears that negatively modulated Ca 2⫹ channels open so slowly that they do not
contribute to action potential-evoked Ca 2⫹ current (Artim and
Meriney, 2000). Therefore, inhibitory G-protein modulation es-
Bischofberger J, Geiger JR, Jonas P (2002) Timing and efficacy of Ca
channel activation in hippocampal mossy fiber boutons. J Neurosci
22:10593–10602.
Borst JG, Sakmann B (1996) Calcium influx and transmitter release in a fast
CNS synapse. Nature 383:431– 434.
Borst JG, Sakmann B (1998) Calcium current during a single action potential in a large presynaptic terminal of the rat brainstem. J Physiol (Lond.)
506:143–157.
Borst JG, Sakmann B (1999) Effect of changes in action potential shape on
calcium currents and transmitter release in a calyx-type synapse of the rat
auditory brainstem. Philos Trans R Soc Lond B Biol Sci 354:347–355.
David G, Barrett JN, Barrett EF (1997) Stimulation-induced changes in
[Ca 2⫹] in lizard motor nerve terminals. J Physiol (Lond) 504:83–96.
�Wachman et al. • Calcium Entry at the Neuromuscular Junction
DiGregorio DA, Vergara JL (1997) Localized detection of action-potentialinduced presynaptic calcium transients at a Xenopus neuromuscular junction. J Physiol (Lond) 505:585–592.
DiGregorio DA, Peskoff A, Vergara JL (1999) Measurement of action
potential-induced presynaptic calcium domains at a cultured neuromuscular junction. J Neurosci 19:7846 –7859.
Dodge Jr FA, Rahamimoff R (1967) Co-operative action of calcium ions in
transmitter release at the neuromuscular junction. J Physiol (Lond)
193:419 – 432.
Dunlap K, Luebke JI, Turner TJ (1995) Exocytotic Ca2⫹ channels in mammalian central neurons. Trends Neurosci 18:89 –98.
Durant NN, Marshall IG (1980) The effects of 3,4-diaminopyridine on acetylcholine release at the frog neuromuscular junction. Eur J Pharmacol
67:201–208.
Edwards FA (1995) Anatomy and electrophysiology of fast central synapses
lead to a structural model for long-term potentiation. Physiol Rev
75:759 –787.
Forti L, Pouzat C, Llano I (2000) Action potential-evoked Ca 2⫹ signals and
calcium channels in axons of developing rat cerebellar interneurons.
J Physiol (Lond) 527:33– 48.
Freguelli BG, Malinow R (1996) Fluctuations in intracellular calcium responses to action potentials in single en passage presynaptic boutons of
layer V neurons in neocortical slices. Learn Mem 3:150 –159.
Goda Y, Sudhof TC (1997) Calcium regulation of transmitter release: reliability unreliable? Curr Opin Cell Biol 9:513–518.
Heuser JE, Reese TS, Landis DM (1974) Functional changes in frog neuromuscular junctions studied with freeze-fracture. J Neurocytol 3:109 –131.
Hille B (1994) Modulation of ion-channel function by G-protein coupled
receptors. Trends Neurosci 17:531–536.
Hunt JM, Silinsky EM, Hirsh KH, Ahn D, Solsona C (1990) The effect of
TMB-8 on acetylcholine release from frog motor nerve: interactions with
adenosine. Euro J Pharmacol 178:259 –266.
Katz B (1969) The release of neural transmitter substances: the Sherrington
lectures. X. Liverpool, UK: Liverpool UP.
Katz B, Miledi R (1965) The effect of calcium on acetylcholine release from
motor nerve terminals. Proc R Soc Lond B Biol Sci 161:496 –503.
Kerr LM, Yoshikami D (1984) A venom peptide with a novel presynaptic
blocking action. Nature 308:282–284.
Kirischuk S, Veselovsky N, Grantyn R (1999) Relationship between presynaptic calcium transients and postsynaptic currents at single ␥-aminobutyric
acid (GABA)ergic boutons. Proc Natl Acad Sci USA 96:7520–7525.
Kirsch GE, Narahashi T (1978) 3,4-diaminopyridine. A potent new potassium channel blocker. Biophys J 22:507–512.
Llinas R, Steinberg IZ, Walton K (1981) Relationship between presynaptic
calcium current and postsynaptic potential in squid giant synapse. Biophys J 33:323–352.
Llinas R, Sugimori M, Silver RB (1992) Microdomains of high calcium concentration in a presynaptic terminal. Science 256:677– 697.
Llinas RR, Sugimori M, Silver RB (1994) Localization of calcium concentration microdomains at the active zone in the squid giant synapse. Adv
Second Messenger Phosphoprotein Res 29:133–137.
Llinas RR, Sugimori M, Silver RB (1995) The concept of calcium concentration microdomains in synaptic transmission. Neuropharm 34:1443–1451.
J. Neurosci., March 24, 2004 • 24(12):2877–2885 • 2885
MacKenzie PJ, Umemiya M, Murphy TH (1996) Ca 2⫹ imaging of CNS axons in culture indicated reliable coupling between single action potentials
and distal functional release sites. Neuron 16:783–795.
Meinrenken CJ, Borst JG, Sakmann B (2002) Calcium secretion coupling at
calyx of held governed by nonuniform channel-vesicle topography.
J Neurosci 22:1648 –1667.
Molgo J, Guglielmi JM (1996) 3,4-Diaminopyridine, an orphan drug, in
the symptomatic treatment of Lambert-Eaton myasthenic syndrome.
Pflügers Arch 431:R295–R296.
Narita K, Akita T, Osanai M, Shirasaki T, Kijima H, Kuba K (1998) Ca 2⫹induced Ca 2⫹ release mechanism involved in asynchronous exocytosis at
frog motor nerve terminals. J Gen Physiol 112:593– 609.
Neher E (1998) Vesicle pools and Ca 2⫹ microdomains: new tools for understanding their roles in neurotransmitter release. Neuron 20:389 –399.
Pawson PA, Grinnell AD, Wolowske B (1998) Quantitative freeze-fracture
analysis of the frog neuromuscular junction synapse. I. Naturally occurring variability in active zone structure. J Neurocytol 27:361–377.
Peng Y-Y, Zucker RS (1993) Release of LHRH is linearly related to the time
integral of presynaptic Ca 2⫹ elevation above a threshold level in bullfrog
sympathetic ganglia. Neuron 10:465– 473.
Pumplin DW, Reese TS, Llinas R (1981) Are the presynaptic membrane
particles the Ca 2⫹ channels? Proc Natl Acad Sci USA 78:7210 –7213.
Robitaille R, Garcia ML, Kaczorowski GJ, Charlton MP (1993) Functional
colocalization of calcium and calcium-gated potassium channels in control of transmitter release. Neuron 11:645– 655.
Sanders DB, Massey JM, Sanders LL, Edwards LJ (2000) A randomized trial
of 3,4-diaminopyridine in Lambert-Eaton myasthenic syndrome. Neurology 54:603– 607.
Smith SJ, Buchanan J, Osses LR, Charlton MP, Augustine GJ (1993) The
spatial distribution of calcium signals in squid presynaptic terminals.
J Physiol (Lond) 472:573–593.
Stanley EF (1993) Single calcium channels and acetylcholine release at a
presynaptic nerve terminal. Neuron 11:1007–1011.
Stocker JW, Nadasdi L, Aldrich RW, Tsien RW (1997) Preferential interaction of omega-conotoxins with inactivated N-type Ca 2⫹ channels. J Neurosci 17:3002–3013.
Sudhof TC, Scheller RH (2001) Mechanisms and regulation of neurotransmitter release. In: Synapses (Cowan MW, Sudhof TC, Stevens CF, eds), pp
177–215. Baltimore, MD: Johns Hopkins UP.
Takahashi T, Forsythe ID, Tsujimoto T, Barnes-Davies M, Onodera K (1996)
Presynaptic calcium current modulation by a metabotropic glutamate
receptor. Science 274:594 –597.
Takahashi T, Kajikawa Y, Tsujimoto T (1998) G-protein-coupled modulation of presynaptic calcium currents and transmitter release by a GABAB
receptor. J Neurosci 18:3138 –3146.
Wachman ES, Niu W, Farkas DL (1997) AOTF microscope for imaging with
increased speed and spectral versatility. Biophys J 73:1215–1222.
Wu LG, Betz WJ (1996) Nerve activity but not intracellular calcium determines the time course of endocytosis at the frog neuromuscular junction.
Neuron 17:769 –779.
Yoshikami D, Bagabaldo Z, Olivera BM (1989) The inhibitory effects of
omega-conotoxins on Ca channels and synapses. Ann NY Acad Sci 560:
230 –248.
�
 Robert Poage