Synthesis and characterisation of superconducting RuSr2GdCu2O8
 R. Masini
2002, Physica C: Superconductivity
visibility
…
description
17 pages
link
1 file
Sign up for access to the world's latest research
checkGet notified about relevant papers
checkSave papers to use in your research
checkJoin the discussion with peers
checkTrack your impact
Abstract
We report on the structural, electrical and magnetic properties of RuSr 2 GdCu 2 O 8 samples made by systematic synthesis work so that they differ from one another in number of annealings and sintering temperature. Our aim is to highlight the different behaviours as a consequence of the thermal treatments. In particular, we deal with the onset of superconductivity in relation to the homogenisation process, and its influence on resistivity, structural and magnetic ordering.
Figures (7)


Related papers
Synthesis and characterization of superconducting RuSr2GdCu2O8
2001
We report on structural, electrical and magnetic properties of RuSr2GdCu2O8 samples made by systematic synthesis work so that they differ from one onether in number of annealings and sintering temperature. Our aim is to highlight the different behaviours as a consequence of the thermal treatments. In particular, we deal with the onset of superconductivity in relation to the homogenisation process,
Synthesis Effects on the Magnetic and Superconducting Properties of RuSr2GdCu2O8
Lecture Notes in Physics, 2002
A systematic study on the synthesis of the Ru-1212 compound by preparing a series of samples that were annealed at increasing temperatures and then quenched has been performed. It results that the optimal temperature for the annealing lies around 1060-1065˚C; a further temperature increase worsens the phase formation. Structural order is very important and the subsequent grinding and annealing improves it. Even if from the structural point of view the samples appear substantially similar, the physical characterizations highlight great differences both in electrical and magnetic properties related to intrinsic properties of the phase as well as to the connection between the grains as inferred from the resistive and the Curie Weiss behaviour at high temperature as well as in the visibility of ZFC and FC magnetic signals.
Superconductivity and Magnetism in Pure and Substituted RuSr 2 GdCu 2 O 8
2002
We describe results of several macroscopic and local measurements of magnetic and superconducting properties for pure and Ce and Cu substituted RuSr2GdCu2O8. From various experiments the physical properties phase diagram is derived as a function of the hole doping. We show that the large contribution of polarized Gd3+ magnetic moments to magnetization causes apparent absence of the Meissner state and
Synthesis and properties of superconductor RuSr2GdCu2O8
Physica C: Superconductivity, 2003
A simple procedure has been successfully developed to synthesize the hybrid rutheno-cuprate superconductor RuSr 2 GdCu 2 O 8 (Ru-1212). A mixture of RuO 2 þ 2SrCO 3 þ GdO 1=2 þ 2CuO was calcined at 960°C in air for 40 h with one intermediate grinding, then pelletized and annealed directly at temperatures ranging from 1035 to 1090°C in flowing oxygen for 15-200 h to achieve superconductivity as high as 35 K. The superconductivity was measured by both AC-susceptibility and four-probe transport methods. The dependence of the zero-resistance T c on annealing temperature and annealing time was thoroughly investigated. X-ray diffraction and transmission electron microscopic studies showed that the samples were almost pure Ru-1212 phase.
Ferromagnetism and superconductivity in pure and doped RuSr2GdCu2O8
Physica B: Condensed …, 2002
We report on systematical investigations of the electrical resistivity and the magnetic properties of the ferromagnetic superconductors Ru (Sr1− xLax) 2GdCu2O8 as a function of La doping. Pure Ru-1212 is characterized by superconductivity (TC≈ 40 K) carried by ...
Synthesis and characterisation of superconducting RuSr2GdCu2O8
C.Artini1, M.M.Carnasciali1, G.A.Costa1, M.Ferretti1, M.R.Cimberle2, M.Putti3, R.Masini4,*
1 INFM and DCCI, Università di Genova, Via Dodecaneso 31 – 16146 Genova (Italy)
2 CNR CFSBT, Via Dodecaneso 33 – 16146 Genova (Italy)
3 INFM and DIFI, Università di Genova, Via Dodecaneso 33 – 16146 Genova (Italy)
4 CNR TeMPE, Via Cozzi 53 – 20125 Milano (Italy)
* corresponding author. Tel.: +39 02 66173 337; Fax +39 02 66173 321. E-mail address: masini@tempe.mi.cnr.it
Abstract:
We report on the structural, electrical and magnetic properties of RuSr2GdCu2O8 samples made by
systematic synthesis work so that they differ from one another in number of annealings and
sintering temperature. Our aim is to highlight the different behaviours as a consequence of the
thermal treatments. In particular, we deal with the onset of superconductivity in relation to the
homogenisation process, and its influence on resistivity, structural and magnetic ordering.
Finally, the problems related to the magnetic measurements due to the superimposition of different
magnetic states are examined.
Keywords: Ru1212, synthesis, superconductivity, electrical and magnetic properties.
1. Introduction
RuSr2GdCu2O8 ruthenocuprate (Ru-1212) belongs to a class of compounds that were synthesized
for the first time in 1995 [1]. It is characterised by a triple perovskitic cell similar to that of
YBa2Cu3Ox, where Y and Ba are substituted by Gd and Sr, respectively, and the CuO2 planes are
separated from one another not by the Cu chains, but by RuO6 octahedra.
This first synthesis work yielded a material whose superconductivity, verified only through
electrical measurements, could not be undoubtedly attributed to the 1212 phase. Since the discovery
of the coexistence of ferromagnetism and superconductivity in this class of materials, the efforts of
1
many researchers have been focused on this phase. Nevertheless Chu et al. [2] still question about
the actual existence of bulk superconductivity.
Since it is well known that physical properties are strongly dependent on sample preparation
conditions, the critical point of all investigations on these materials is the preparation method. The
need to avoid the formation of impurities, such as the ferromagnetic SrRuO3 for example, and to
obtain a phase as ordered as possible, led to the optimisation of a synthesis process that includes a
first calcination, a thermal treatment in N2 [3,4] and several annealings in flowing O2 [4,5,6].
Reports of both superconducting [4,6] and non superconducting samples [7,8] of Ru-1212 have
spurred a detailed experimental approach aimed to determine the factors that influence
superconductivity of this material. Tackling the question of how the superconducting and magnetic
properties are affected by subtle details of the preparation process, which in turn affect the
microscopic structure, we present the results of a systematic work on the synthesis of Ru-1212
which allows superconductivity to be induced in a controlled manner.
2. Experimental details
Polycrystalline samples of composition RuSr2GdCu2O8 have been synthesized by solid state
reaction of high purity stoichiometric powders of RuO2, Gd2O3, CuO and SrCO3. The mixture was
first calcined in air at 950°C; then, after grinding and die-pressing into pellets, it was treated in
flowing N2 atmosphere at 1010°C. This step resulted in the formation of a mixture of the precursor
materials Sr2GdRuO6 and Cu2O without formation of the impurity phase SrRuO3, very stable in
oxidising environment [3]. The mixture was then subjected to eight successive sintering steps in
flowing O2, each one lasting 15 hours, at temperatures starting from 1030°C up to 1085°C. Each
successive thermal treatment was performed at a temperature 7°C higher than the previous one. At
the end of every step the product was quenched to room temperature, fully characterized, reground,
pressed into pellets and subjected to the successive treatment at higher temperature, so that the
2
effects of the thermal treatments during synthesis process could be investigated. Each reaction step
was carried out on a MgO single crystal substrate to prevent reaction with the alumina crucible.
This procedure allowed us to highlight the passage from a non superconducting to a
superconducting status in the material.
In this work, we report on the structural, electrical and magnetic properties of three samples
considered indicative of the overall process of synthesis and formation of the Ru-1212 phase.
Particularly those which were subjected to:
(i)
three sintering steps up to 1045°C as follows: 1030°C x 15h + 1037°C x 15h + 1045°C x
15h, for a total time t= (15 x 3) = 45h,
(ii)
five sintering steps up to 1060°C for a total t = (15 x 5) = 75 h,
(iii)
eight sintering steps up to 1085°C for a total t = (15 x 8) = 120 h;
hereafter referred to as samples A, B and C, respectively.
The crystal structure of the samples was examined by X-ray powder diffraction using CuKα
radiation. Micro-Raman analysis was carried out by a Renishaw System 2000 instrument (He-Ne
laser, 633 nm, 15mW, 50x, 4 accumulations). The resistivity of sintered polycrystalline bars was
measured by the standard four-probe technique with a 1mA current in the 15 – 300 K temperature
range. Magnetic susceptibility was measured in a Quantum Design SQUID magnetometer.
3. Results and discussion
3.1. Structure and microstructure
XRD patterns showed single phase 1212-type materials with no traces of impurities within the
resolution of the technique. All diffraction peaks could be indexed on the basis of a tetragonal
lattice (Table 1) in agreement with the literature data [3]. In order to test the phase homogeneity
furtherly and due to its greater sensitivity with respect to XRD technique, micro-Raman analysis
3
has been performed. The typical spectra obtained in three different points of sample B are reported
in Fig. 1, where modest but detectable differences can be observed. The overall behaviour is in
agreement with the literature data [9] showing the same structures of the peaks: the slight change of
the barycentre and band amplitude are presumably due to the different crystallinity between the
centre and the border of the sample. A broadening and a small shift toward lower frequency of the
peak at 640 cm-1 (apical O(Sr) A1g mode) have been detected in A and C sample spectra which can
be related to a softening of the Sr-O bond. A comprehensive discussion and analysis of microRaman spectra in these compounds will be the subject of a future work.
SEM analyses show high grain homogeneity with clean grain boundaries. Moreover, we have
detected a progressive grain growth with a corresponding increase in grain connectivity due to the
different thermal treatments. Complete sintering was never reached. This fact can be explained
considering the difference between the decomposition temperature of the 1212 phase ( around
1130°C, as estimated through thermal analysis) and the temperature of the thermal process (Tmax =
1085°C in this work). The geometric density varies by about 5% between the first and the final bulk
3
sample C, which has a density of 4.2 g/cm (about 63% of the theoretical crystallographic density).
In order to investigate whether the observed behaviours were caused by the annealing time or
temperature, tests have been performed by comparing the properties of the samples obtained
through the successive sintering steps mentioned above with other samples, of the same
composition and batch, subjected to a single thermal treatment at the final temperature of each
single step for a time which is the sum of the corresponding partial times of the serie considered in
this work. This allowed us to conclude that reaching the “optimal” temperature directly does not
produce the same results of the longer procedure: repeated homogenisations, related to the sequence
of grinding and annealing, controls the superconducting behaviour.
3.2. Electrical properties
4
The behaviour of the room temperature resistivity as a function of the number of sintering steps n is
reported in Fig. 2. It can be clearly seen that ρ300 has an almost constant value at the beginning of
the series, then it suddenly drops, reaching another constant value that is about six times smaller
than the starting one. Such different values are not related to the sample density, which does not
present strong variations. In the samples with n ≤ 4, a semiconductor-type behaviour (with a local
minimum at 130K) is observed in the 50-300K temperature range. At higher n, a metallic type
behaviour is detected, with a well defined minimum at 130K followed by a semiconducting upturn.
The minimum at T=130 K is related to the onset of the magnetic ordering of Ru lattice. Moreover,
for n<4 a maximum in resistivity is observed at 35K, which is progressively depressed in magnitude
and shifted up to 45K at higher n. At lower temperatures a large resistivity drop (down to values
100 times smaller than ρ300) is measured for all samples with n<4. At higher n superconductivity
sets in and zero resistivity is detected. In view of this trend in resistivity we limit our treatment to
sample A (n=3), whose behaviour lies in the non superconducting and semiconductive region, to
sample B (n=5), for which superconductivity and metallic character in resistivity have just set in,
and to sample C (n=8), for which superconductivity has been depressed. Resistivity measurements
performed on these three samples are reported in Fig. 3. The temperature derivative of the
resistivity for sample B is shown in the inset of Fig.3. A two-step behaviour is observed: a high
temperature peak at about 45K, corresponding to the superconducting thermodynamic critical
temperature, and another one at lower temperature (here at about 30K). This behaviour is
commonly observed in the literature: different explanations have been proposed [10,11].
3.3. Magnetic properties
An experimental problem encountered in the magnetic measurements of Ru-1212 materials is
strictly related to the complexity of the magnetic signal. As noted in [12], the magnetization in Ru-
5
1212 contains magnetic moments arising from different contributions: the Gd paramagnetic spin
lattice, the Ru spin lattice and, finally, the diamagnetic signal related to the superconducting
behaviour. For both the Gd and Ru spin lattice the antiferromagnetic ordering is coupled with a
ferromagnetic component that is attributed to a canting of the lattice, in the case of Ru, whereas, in
the case of Gd, is simply related to the presence of the net ferromagnetic moment of the Ru lattice
[13]. Therefore, the basic condition of a homogeneous magnetic moment requested by the SQUID
magnetometer is not fulfilled, in particular at low temperatures where magnetic moments of
opposite polarity will be present in the sample as a consequence of the applied field. In addition, in
the superconducting coil of the magnetometer a small remanent field may be present. This last can
be zeroed with a proper procedure which results in a residual field of the order of fraction of Gauss
(estimated by measuring the susceptibility of a paramagnetic salt) in the central part of the magnet,
and greater far from it. Therefore, a “real” ZFC measurement cannot be made and, since the FC
magnetic moment is about one order of magnitude greater than the ZFC one, even a residual field of
a fraction of Gauss may give rise to a considerable magnetic signal whose polarity depends on the
field polarity. Finally, we point out that, when the sample is moved for a length that is usually of
few centimetres during the measurement, it moves in a non uniform magnetic field that makes it
follow a minor hysteresis loop. If the value of the moment is not constant during the scan, an
asymmetric scan wave form will be detected, and the quality of the measurement will drastically
degrade [14].
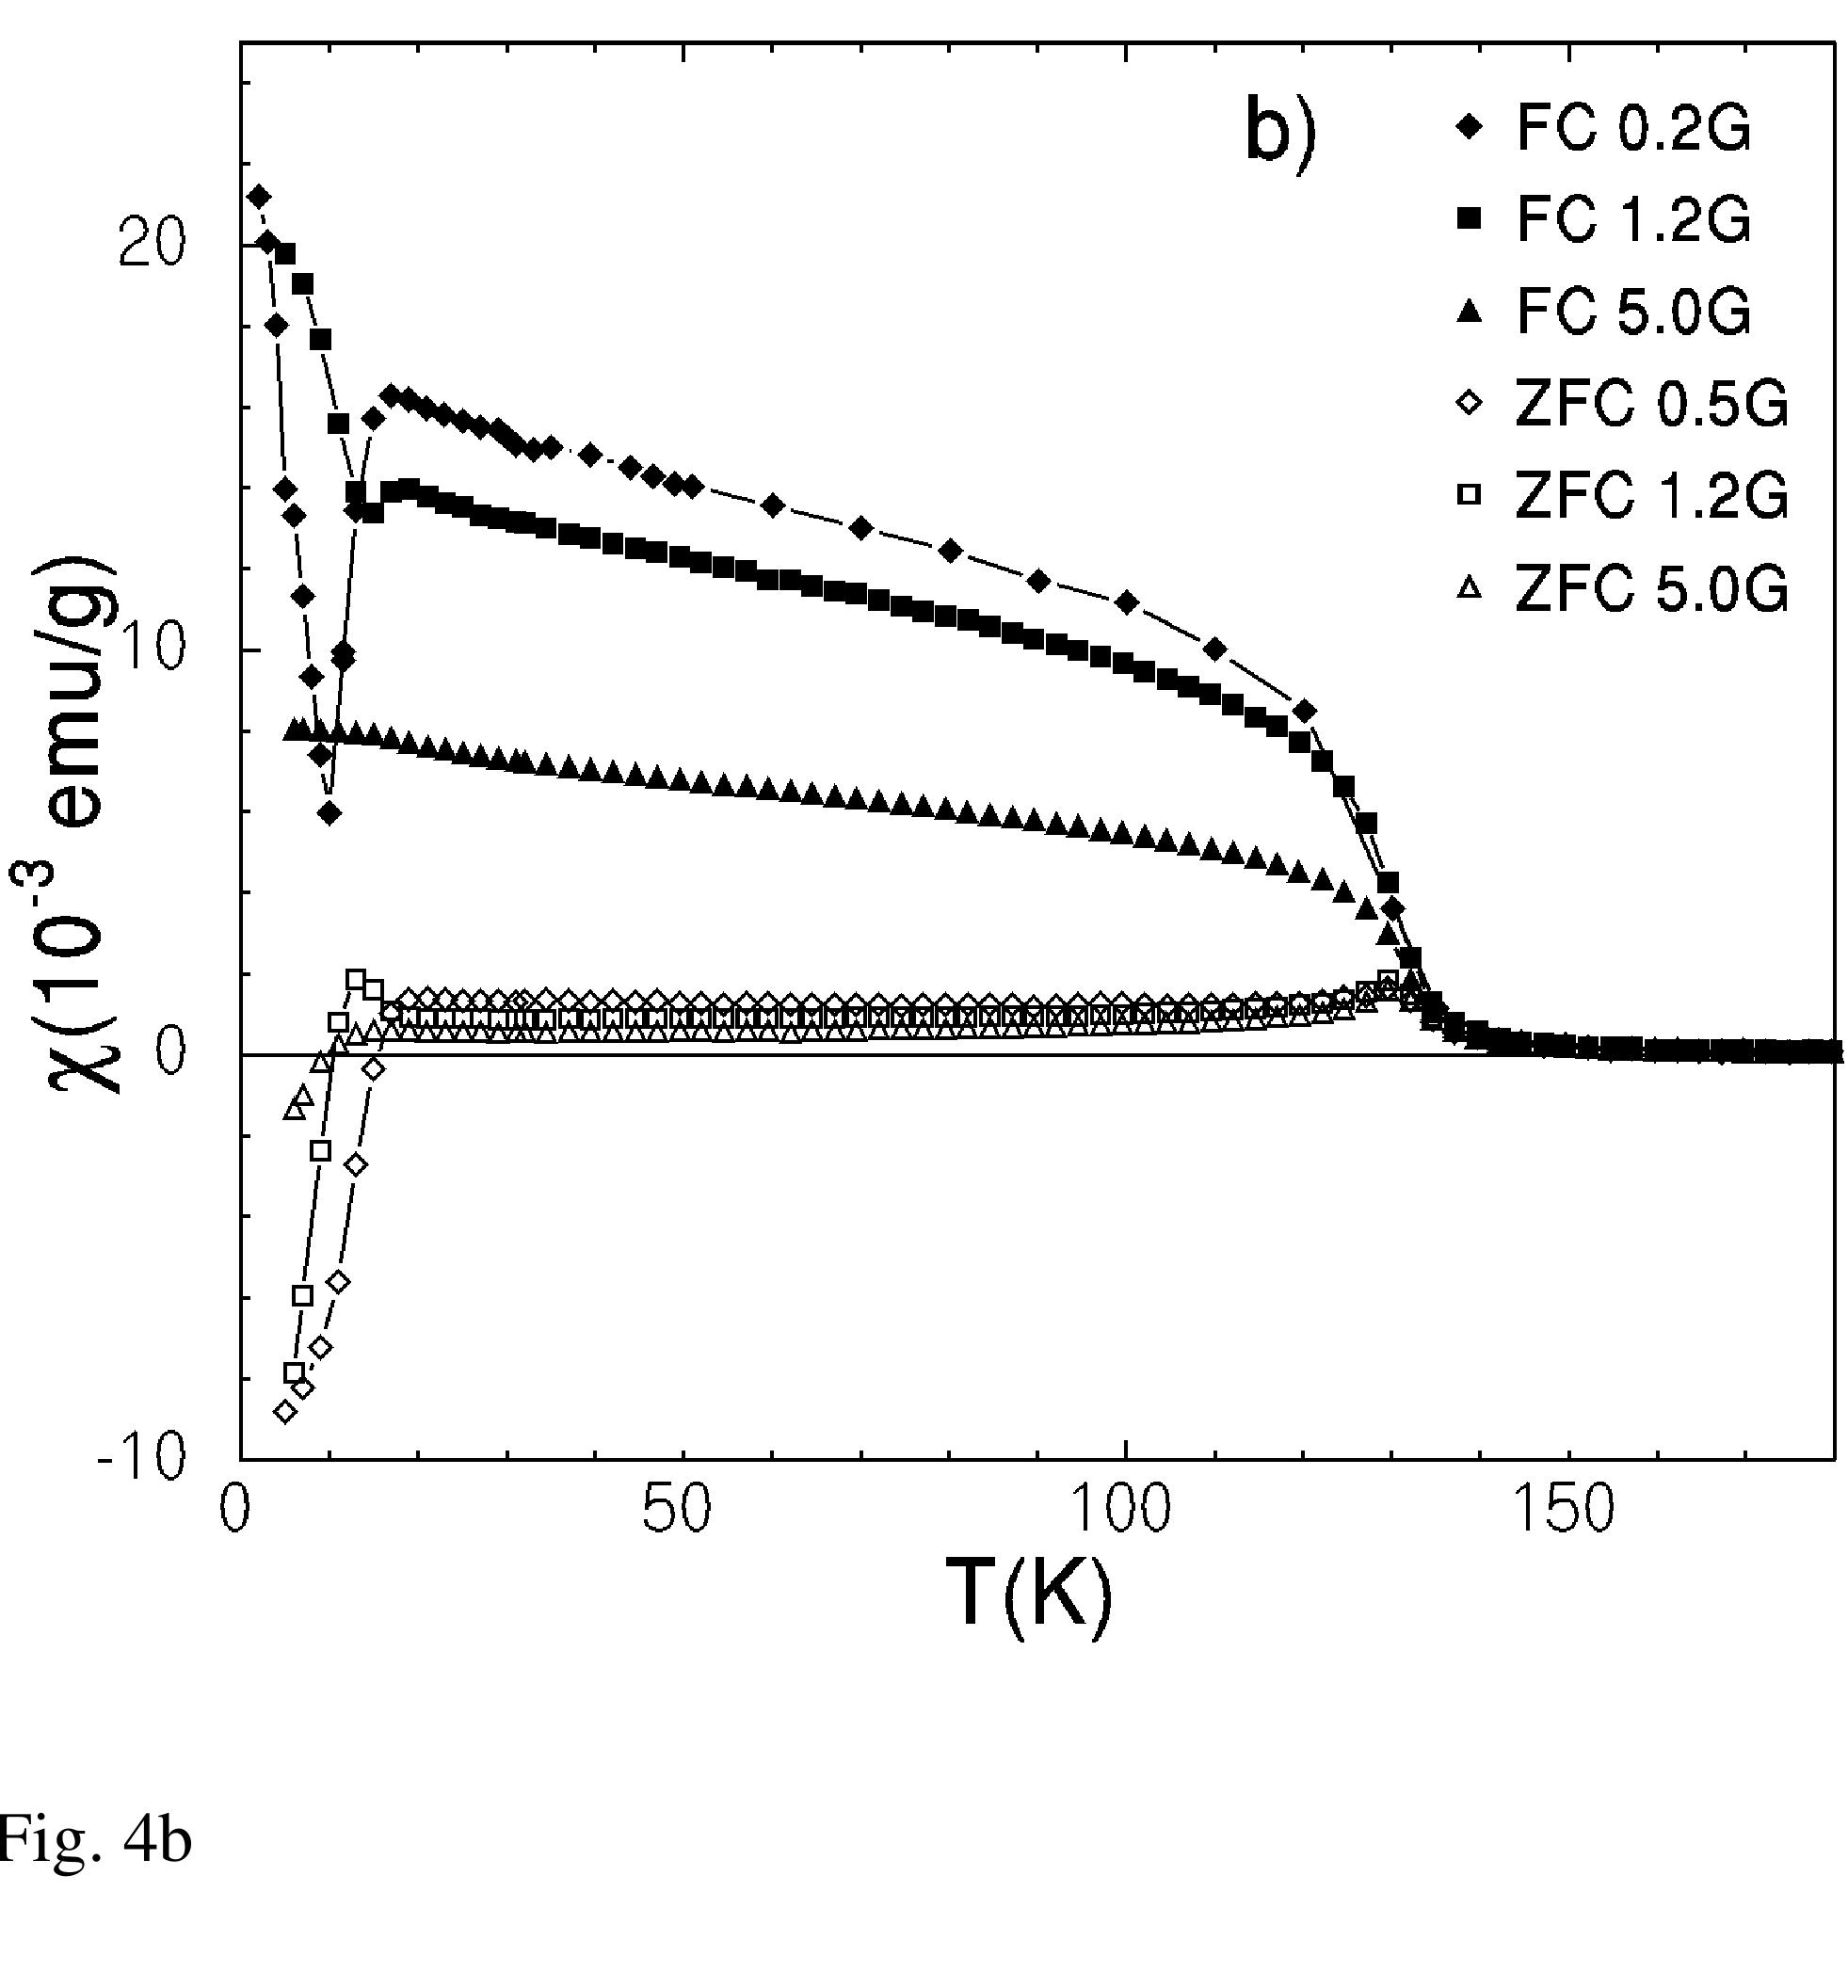
The ZFC and FC measurements are reported in Fig. 4 a) and b). The magnetic ordering manifests
itself as a cusp related to an antiferromagnetic ordering in the ZFC measurement, whereas, in the
FC curve, as a sudden onset of a spontaneous magnetic moment related to a ferromagnetic
component. For all three samples the spontaneous magnetization occurs in the 130-135K
temperature range. At the lowest temperatures a contribution from Gd sublattice, which orders
antiferromagnetically at 2.5K, is clearly visible. The superconducting behaviour of sample B is
detected by the diamagnetic shift corresponding to the shielding of about 50% of sample volume at
6
the lowest temperatures and fields. Measurements performed on sample B at different applied fields
are shown in Fig. 4b). The FC susceptibility as well as the amplitude of the irreversibility between
FC and ZFC measurements decreases as the field increases. At the minimum applied field of 0.2 G,
and to a minor extent even at 1.2 G, a Meissner behaviour is seen in the FC curve that quickly reenters. At 5.5 G the Meissner effect is only seen as a constant value hindering the Gd magnetic
ordering. The poor visibility of the Meissner effect has been observed by several authors [10,15]
and explained in different ways: Bernhard et al. [10] have proposed that a spontaneous
magnetisation from RuO2 layers results in a local magnetic field that may be greater than the lower
critical field Hc1 giving rise to a spontaneous vortex phase (SVP). The effect of a SVP is to suppress
the Meissner phase. Chu et al [15] have associated this behaviour to a phase-lock of an aggregation
of small Josephson-coupled superconducting grains or domains.
In Fig. 5 the high temperature susceptibility data at 1000 G are reported. The best fit to the
experimental data with a two components curve χ=CGd/T +CRu/(T-θ) is shown and the fitting
results are reported in Table 1. Shown in the inset is the M(H) curve measured at 5K. With our
maximum available field, saturation of the magnetisation is not achieved.
Conclusions
It has been demonstrated that bulk superconductivity can also be obtained in quenched
RuSr2GdCu2O8 samples. Superconductivity, as probed by magnetic susceptibility, is observed after
proper homogenisation. At the higher temperatures (T>1070°C) the annealing tends to introduce
disorder in the system, worsening the superconducting properties.
In properly homogenised samples we have been able to observe a 50% sample volume shielding
and a magnetic signal related to a Meissner effect.
7
Acknowledgements
This work was partially supported by INFM and CNR.
8
References
[1] L. Bauernfeind, W. Widder, H.F. Braun, Physica C 254 (1995) 151
[2] C.W. Chu, Y.Y. Xue, R.L. Meng, J. Cmaidalka, L.M. Dezaneti, Y.S. Wang, B. Lorenz, A.K.
Heilman, cond-mat 9910056
[3] L. Bauernfeind, W. Widder and H.F. Braun, J. Low Temp. Phys. 105 (1996) 1605
[4] C. Bernhard, J.L. Tallon, Ch. Niedermayer, Th. Blasius, A. Golnik, E. Brücher, R.K. Kremer,
D.R. Noakes, C.E. Stronach and E.J. Ansaldo, Phys. Rev. B 59 (1999) 14099
[5] J. Tallon, C. Bernhard, M. Bowden, P. Gilberd, T. Stoto and D. Pringle, IEEE Transactions on
Applied Superconductivity, 9 (1999) 1696
[6] O. Chmaissem, J. D. Jorgensen, H. Shaked, P. Dollar and J. L. Tallon, Phys. Rev. B 61 (2000)
6401
[7] I. Felner, U. Asaf, S. Reich and Y. Tsabba, Physica C 311 (1999) 163
[8] R.W. Henn, H. Friedrich, V.P.S. Awana, E. Gmelin, Physica C 341-348 (2000) 457
[9] A.Fainstein, A.E.Pantoja, H.J. Trodahl, J.E. McCrone, J.R. Cooper, G. Gibson, Z. Barber,
J.L. Tallon, Phys. Rev. B 63 (2001) 144505
[10] C. Bernhard, J.L Tallon, E. Brücher and R.K Kremer, Phys. Rev. B 61 (2000) 14960
[11] B. Lorenz, R.L. Meng, J. Cmaidalka, Y.S. Wang, J. Lenzi, Y.Y. Xue, C.W. Chu, Physica C in
press
[12] I. Felner, U. Asaf, Y. Levi, O. Millo, Phys. Rev. B 55 (1997) R3374
[13] J.D. Jorgensen, O. Chmaissem, H. Shaked, S. Short, P.W. Klamut, B. Dabrowski, J.L. Tallon,
Phys. Rev. B 63 (2001) 54440
[14] M. Suenaga, D.O. Welch, R. Budhani, Supercond. Sci. Technol. 5 (1992) S1-8
[15] S.Y. Chen, J. Shulman, Y.S. Wang, D.H. Cao, C. Wang, Q.Y. Chen, T.H. Johansen, W.K.
Chu, C.W. Chu, cond-mat 0105510
9
Figure captions
Fig. 1 Micro Raman spectra obtained in three different points of sample B.
Fig. 2 Resistivity at 300 K as a function of the number of sintering steps. Hatched region separates
zones which show progressively different electrical behaviours.
Fig. 3 Resistivity of samples A (
), B ( ∆ ) and C ( Ο ) as a function of the temperature. Inset:
temperature derivative of resistivity vs. T for sample B in the transition region.
Fig. 4 ZFC (hollow symbols) and FC (filled symbols) magnetic susceptibility as a function of
temperature (a) for samples A ( ◊ ) at H = 3.5G and C ( ∆ ) at H = 1.5G; (b) for sample B.
Fig. 5 Magnetic susceptibility vs. temperature for samples A (
), B ( ∆ ) and C ( Ο ) in the
paramagnetic region. Fitting results are also shown as solid lines. Inset: M(H) curve at 5K for
sample B.
Table 1 Synthesis, structural, electrical and magnetic data of our RuSr2GdCu2O8 samples.
CGd , CRu and θ come out from a best fit of the susceptibility experimental data in the 200-300K
temperature range with a two component function.
.
10
Table 1
Sample T sintering
a (Å)
c (Å)
(°C)
ρ300
ZFC
T max
(mΩ cm)
(K)
CGd
θ
CRu
(emu K/mole) (emu K/mole)
(K)
A
1045
3.831(1)
11.545(7)
137.4
130
7.38
1.70
108.6
B
1060
3.828(1)
11.552(6)
30.7
130
7.60
0.79
144.9
C
1085
3.835(1)
11.580(5)
22.0
135
8.26
0.81
139.6
11
Fig. 1
12
Fig. 2
13
Fig. 3
14
Fig. 4a
15
Fig. 4b
16
Fig. 5
17