Market Lett (2008) 19:125–139
DOI 10.1007/s11002-007-9030-1
Framing effects in mixed price bundling
Timothy J. Gilbride & Joseph P. Guiltinan &
Joel E. Urbany
Published online: 18 January 2008
# Springer Science + Business Media, LLC 2007
Abstract In mixed price bundling, the consumer has the choice of buying the
individual products separately, as part of a bundle with a discounted price, or not
purchasing them at all. Framing effects refer to how the price of the bundle is
presented to the consumer. Past studies have focused on perceptual measures and
aggregate level results, and have only looked at a subset of different types of price
framing in any one study. In this paper we use discrete choice data to investigate
whether price framing affects choice in mixed price bundles. We find that the joint,
integrated frame results in the highest proportion of respondents choosing the bundle
and the fewest choosing “none.” When the prices of items in a bundle are itemized,
some consumers are more likely to compare prices separately to their reference
prices to evaluate the attractiveness of the deal, but this actually reduces the
probability of purchasing the bundle. However, the majority of consumers do not use
reference prices and instead follow a simple economic choice model.
Keywords Bundling . Pricing . Framing effects . Hierarchical Bayes
1 Introduction
Bundling is the business practice of offering two or more products for sale as
package. In pure bundling the component products are only sold as a package. In
mixed bundling the consumer has the choice of buying two or more products
separately, or together in a bundle. When a price discount is part of the bundle offer,
T. J. Gilbride (*) : J. P. Guiltinan : J. E. Urbany
Mendoza College of Business, University of Notre Dame, Notre Dame, IN 46556, USA
e-mail: tgilbrid@nd.edu
J. P. Guiltinan
e-mail: Joseph.P.Guiltinan.1@nd.edu
J. E. Urbany
e-mail: urbany@nd.edu
�126
Market Lett (2008) 19:125–139
the practice is characterized as “price bundling” (cf. Stremersch and Tellis 2002).
Discounted prices are typically framed in one of three ways.
–
–
–
Joint, integrated: “Pay $X when you buy both product A and product B”
Joint, segregated: “Pay $Y for A and $Z for B when you buy both”
Leader, segregated: “Pay $W for B when you buy A at the regular price”
In the last example, product B is referred to as the “price leader”, and managers must
choose which product should be the “leader” if leader pricing is selected.
Past academic research on framing price bundles has measured perceptions of
different bundles (as opposed to choice), has not compared joint vs. leader framing
effects, and has focused on aggregate level effects (cf. Harlem et al. 1995; Kaicker et al.
1995; Yadav 1994, 1995). In contrast, this study investigates choice behavior, assesses
the impact of all types of mixed bundling strategies, and tests different information
processing models at the individual level. These goals are accomplished by using a
discrete choice experimental design and hierarchical Bayes statistical techniques to
measure the effect of reference prices or “transaction utility” on choices.
We find that the “integrated” frame results in the greatest proportion of consumers
that choose the bundle and the smallest proportion choosing “none” in our discrete
choice experiment. The statistical model suggests that when prices are integrated,
consumers are less likely to rely on individual reference prices and calculations of
“transaction utility.” In fact, we find that across experimental conditions, only a
minority of respondents use reference prices when evaluating bundled offerings.
2 Economic and behavioral theory
As initially spelled out by Stigler (1968) and Adams and Yellen (1976), bundling is a
device for capturing more consumer surplus by facilitating price discrimination across
consumers who differ in their relative preference between two (or more) products. In
mixed bundling, consumers face PA, PB, and the bundle price PA,B. If reservation
prices (RPA and RPB) are additive 1, then the bundle is purchased if RPA +RPB ≥PA,B.
The goal in mixed bundling is to choose PA,B such that total sales and profit are
increased.
Behavioral research into price framing has been guided by Kahneman and
Tversky’s (1979) prospect theory and Thaler’s (1985) model of mental accounting.
These theories may help explain price framing effects by augmenting the economic
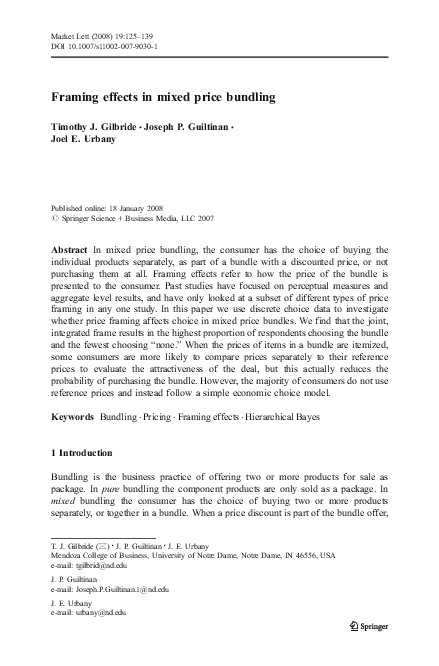
model with a measure of “how good a deal” the consumer is getting. Figure 1
presents a stylized version of how these theories may apply under different pricing
frames. Central to the behavioral approach is the calculation of “gains and losses”
relative to a set of reference prices (not reservation prices as in the economic model)
and the fact that “losses” are more detrimental than corresponding “gains.” When a
single price for the bundle is presented, consumers must add together their reference
1
Additivity of reservation prices is a frequent assumption in economic analyses of price bundling. See
Jedidi et al. (2003) for a discussion and empirical test of this assumption. Our empirical model follows the
findings of Jedidi et al. and we do not assume additivity of reservation prices in our analysis.
�Market Lett (2008) 19:125–139
Panel a.
127
Integrated Pricing – Combining Reference Prices
Integrated
Bundle
Price
[PA,B]
Reference Reference
Price of = Price of +
A
Bundle
Gain
Or
Loss
Single price for
bundle PA,B
presented to
consumer.
Reference
Price of
B
Consumer adds together his/her
reference prices to compare to
price of bundle.
Segregated Pricing – Combining Prices and Combining Reference Prices
Panel b.
Segregated
Bundle
Price
[PA + PB]
Gain
Or
Loss
Bundle price presented as two
components, consumer adds
two prices together PA + PB.
Reference Reference
Price of = Price of +
A
Bundle
Reference
Price of
B
Consumer adds together his/her
reference prices to compare to
price of bundle.
Segregated Pricing – 2 Comparisons
Panel c.
Price
of A in
Bundle
[PA]
Price
of B in
Bundle
[PB]
Bundle price presented
as two components.
Fig. 1 Evaluating bundled prices in different frames
Gain
or
Loss
Gain
or
Loss
Reference
Price of
A
Reference
Price of
B
Consumer compares each price to
each reference price.
�128
Market Lett (2008) 19:125–139
prices for the two goods in order to compare their reference prices to the price of the
bundle (Fig. 1a). In the case of segregated prices, it is not clear exactly how
consumers process the prices of the products in the bundle or make comparisons to
reference prices. Consumers may add together the prices of the products in the
bundle, add together their reference prices, and make one comparison to calculate
the “gain or loss” (Fig. 1b). Or, they may make two separate comparisons (Fig. 1c).
A hierarchical statistical model is introduced to examine which of these theories best
explain subjects’ choices.
Although the weight of past experimental studies does appear to favor integrated
bundle pricing, the evidence is best described as mixed. Yadav and Monroe (1993)
find that the additional savings represented in an integrated bundle price—after
savings were presented separately for individual item sale prices—explained more
variance in overall perceived transaction value than did the initial savings on the two
items separately. Other research, however, suggests that the superiority of integrated
bundle pricing is dependent upon the certainty and level of consumers’ starting price
expectations. Unfortunately, though, there is no consensus on whether integrated
pricing is better when bundle prices are below expectations (Mazumdar and Jun
1993), above expectations (Harlam et al. 1995), or only with certain mixtures of
gains and losses (Kaicker et al. 1995). While these studies differed significantly in
method, they have in common the use of consumer perception as the dependent
variable and efforts to provide explicit attention to gains and losses in the pricing of
both individual products, presenting reference prices and sometimes calculating
gains and losses for subjects’ consideration.2 Further, the studies are generally
organized around the question of which frame consumers “prefer” (e.g., which
makes them happier; Mazumdar and Jun 1993), some presenting different frames to
the consumer simultaneously for comparison.
Leader pricing Other studies have provided additional insight into the question of
which product of the pair should receive the discount when the leader form of
segregated framing is used. This work varies on whether the best option is to give
the discount to the component that is most preferred (Yadav 1995), or to the item in
the pair that will be most likely to reduce the consumer’s sense of loss (Janiszewski
and Cunha 2004). As with other prior research on framing effects, these studies both
used dependent measures of customers_ perception of the comparative value reflected
in the different bundle frames, presenting different frames simultaneously.
2.1 Introducing a choice context
This study investigates price framing effects in choice situations where there is an
option of choosing either one of the items, choosing the bundle, or not choosing at
all. In many (if not most) real choice contexts, consumers select not only among
different brand options, but may also decide to defer choice (Dhar and Simonson
2003; Dhar 1997). Consumers might opt for “no choice” because of difficulty in
making trade-offs among options (cf. Tversky and Shafir 1992) or calculating the
2
The exception is Harlam et al. (1995), who use self-explicated reservation prices as a proxy for reference
prices and measure purchase intentions.
�Market Lett (2008) 19:125–139
129
“gain or loss,” or because of preference or choice uncertainty (Lanzetta 1963;
Urbany et al. 1989). A third explanation—emanating from the theory of rational
search (Stigler 1961; Karni and Schwarz 1977; Rothschild 1974)—is that the
evaluation of options is driven by both their assessments of the promoted goods, and
outside considerations: A willingness to forego additional search or known outside
goods is fundamental to the notion of a reservation price, or “willingness to pay.”
Although still an experimental setting, discrete choice offers an important
extension to research on framing effects. Past perceptual research shows that price
framing influences attitudes and implicates reference prices as the underlying
mechanism. However, the effects observed there may be due partly to the fairly
extensive information that was provided in those studies to allow subjects to estimate
gains and losses. In contrast, when choice is the focus, the consumer may attend less
to detailed gains and losses and more to judging the products against other options.
A framework is offered here that provides a focus on choice, yet also provides
insight into how consumers utilize reference prices.
2.2 Proposed framework
The first objective of this research is to determine if price framing effects can be
measured in a discrete choice task, and if so, which price frame is superior. The
second objective is to use the “gains and loss” framework illustrated in Fig. 1 to
explain why choices may differ. Next, we formalize this framework.
Thaler (1985) proposes that consumers get two types of utility from a purchase:
acquisition utility and transaction utility. Acquisition utility is similar to the
economic notion of consumer surplus, the value of a good relative to its price.
Transaction utility is the perceived value of the deal and is measured relative to some
reference price. Let PA� be a consumer's reference price for good A and PA be the
“value equivalent of” A, “the amount of money that would leave the individual
indifferent between receiving” PA or A as a gift (Thaler 1985, p. 205). In standard
economic theory, PA would be equal to the reservation price or RPA using our
notation from earlier. Thaler’s now familiar representation goes as follows:
�
�
�
�
�
�
w A; PA ; PA� ¼ υ PA ; PA þ β gain υ PA� ; PA I PA� > PA þ β loss υ PA� ; PA I PA > PA�
ð1Þ
�
�
where w A; PA ; PA is the value of buying good A, for price PA, with reference price
PA� . The first term on the right, uðPA ; PA Þ represents the acquisition utility as a
function of the price and the “value equivalent of” A. The remaining terms represent
�
the transaction utility as a function of the price and the reference price, u PA� ; PA .
I(*) is the indicator function equaling 1 if the argument is satisfied, and 0 otherwise.
(1) says that when the actual price is greater than the reference price, it is encoded as
a loss, which has a different impact on transaction utility (βloss) than if the price is
less than the reference price (βgain), which is encoded as a gain.
Our model seeks to explain choice behavior in a bundling context as a function of
both price and framing effects. We assume that our subjects choose the option
(product 1, product 2, both products together, or no choice) that produces the
�130
Market Lett (2008) 19:125–139
greatest value, i.e. Eq. 1. We allow for different parameter values for individuals in
Eq. 1 by using the subscript “h”. The model is represented as:
zh1t ¼ αh1
zh2t ¼ αh2
zh3t ¼ αh3
�
Ph1t þ βh;gain Ph1
�
Ph2t þ βh;gain Ph2
�
Ph3t þ βh;gain Ph3
� �
�
Ph1t �I Ph1
> Ph1t � þ β h;loss Ph1t
�
Ph2t �I Ph2
> Ph2t � þ β h;loss Ph2t
�
Ph3t I Ph3
> Ph3t þ β h;loss Ph3t
�
�
�
�
I Ph1t > Ph1
Ph1
�
� þ "h1t
�
�
Ph2
I
P
h2t > Ph2 þ "h2t
�
�
�
�
I Ph3t > Ph3
þ "h3t
Ph3
ð2Þ
where the index {1, 2, 3} represents the option of choosing product A individually,
product B individually, or products A and B together as a bundle in a choice set. “t”
reflects the number in a series of choice sets. We normalize the value function by setting
znone =0. The respondent then chooses the alternative with max{zh1t, zh2t, zh3t,0}. We
note that while our simple model allows for asymmetric treatment of gains and losses,
we assume all effects are linear. This simple set-up provides a basis for comparing three
models which each represent unique ways that consumers may evaluate the bundled offer:
Model 1. Simple reservation price model The value function represented by Eq. 1
contains the economic choice model of Jedidi et al. (2003) as a special case. If we set
βh,gain =βh,loss =0 then we obtain their model where αh’s represent the reservation
prices and the consumer chooses the option with the greatest consumer surplus.
Following the theoretical model of Jedidi et al., we restrict the coefficient on price to
equal −1. Consistent with their empirical results, we allow for a separate intercept
term for the bundle as opposed to restricting it to equal the sum of the intercepts for
the individual products. We note that in the full model, the αh’s can no longer be
interpreted as reservation prices.
Model 2. Combining reference prices When a mixed bundle is presented in a “joint,
integrated” frame (Fig. 1a), the consumer must combine or add together the individual
reference prices in order to determine the transaction utility, i.e. the gain or loss. Panel
A suggests that the consumer compares the bundle price to a reference price which is
the sum of the reference prices of the bundled goods A and B. However, panel B in
Fig. 1 illustrates that combining reference prices can also occur when the sale prices for
goods A and B have been presented separately. The consumer may add together the
prices of each item in the bundle, compare that to the sum of the reference prices, and
arrive at a gain/loss for the bundle. If this was the process most consumers followed, we
would not see a difference in choices between integrated and segregated price frames.
Model 3. Two comparisons However, when prices in the bundle are segregated, the
consumer may perform two separate price comparisons (panel C, two comparisons),
and arrive at a gain/loss calculation for each item in the bundle. Although effortful,
this matters because the value function in prospect theory treats gains and losses
asymmetrically, and is the implicit model underlying many studies of consumer
perception of bundling (Mazumdar and Jun 1993; Kaicker et al. 1995; Yadav and
Monroe 1993). Table 1 provides numeric examples illustrating panels B and C in
Fig. 1 in the context of the luggage products used in our empirical experiment.
In sum, our paper differs from others in the bundle framing literature in that (1)
we use a discrete choice experiment; (2) subjects can purchase the bundle, either of
the components alone, or neither of the components; (3) we contrast all the types of
�Market Lett (2008) 19:125–139
131
Table 1 Example of calculating gain/loss in the value function when bundle prices are segregated
Price
Amount
Tote reference price
Garment bag reference price
$70
$80
Presentation of prices in the bundle
Tote
Garment bag
$72
$73
Combining
Reference price ($70 + $80)
Price bundle ($72+$73)
Gain and loss ($150–$145)
$150
$145
Two comparisons
Reference price of tote
Price of tote in bundle
Gain or Loss ($70–$72)
$70
$72
Reference price of garment bag
Price of garment bag in bundle
Gain or loss ($80–$73)
Gain
$5
Loss
$0
Gain
$0
Loss
$2
$7
$0
$7
$2
$80
$73
Total
mixed price bundling strategies; (4) the proposed framework together with
hierarchical Bayesian modeling provides a means for determining how many
individual consumers use reference prices in their decision-making.
3 Method
3.1 Participants
A commercial market research company identified a nationally representative sample of
consumers and administered an on-line survey on luggage choices. Only respondents
who had purchased luggage in the past 10 years were permitted to complete the survey.
3.2 Procedure
A mixed bundling strategy requires that the products be separable in terms of use such
that both products could be purchased and used independently of whether the other
product was purchased or used. The items we selected were a tote bag and garment
bag. The items had the same brand name (to control for inferences about quality).
A short questionnaire was developed and pre-tested with MBA and Executive
MBA students (n=80).
3.3 Stimuli
Respondents were asked to imagine that they needed new luggage and had been
actively looking for tote bags and garment bags. They were told that prices for
�132
Market Lett (2008) 19:125–139
garment bags and tote bags ranged from $59.99 to $95.99, and were then shown an
on-screen print advertisement for the TravelPro Crew 5 Garment Bag and the
TravelPro Crew 5 Deluxe Tote that described the various features and benefits of the
products. Respondents were asked to enter the lowest, average, and highest price
they would expect to see for the garment bag, and then separately, for the tote.
Respondents then saw a series of 6 choice sets where they could choose the garment
bag, the tote bag, the bundle consisting of both the garment bag or the tote, or a final
option labeled as “Neither: I would not purchase either one.” The survey closed with
standard demographic questions.
Each respondent saw different randomly generated prices in each of his/her six
choice tasks. A base price of $79 was used for both the tote bag and the garment bag
and prices of the individual items in each choice task were generated randomly as
±20% of the base price. Thus, the actual range of prices matched the price range
given to respondents earlier in the survey. The total price of the bundle was
randomly generated as 5–20% off the sum of the base prices. The price of the bundle
was checked to make sure that it was at least 5% less than the sum of the listed price
of each item. All prices were forced to end in $XX.99.
3.4 Design
Respondents were randomly assigned to one of four price framing conditions: joint,
integrated; joint, segregated; tote as price leader; or, garment bag as price leader. The
presentation format for items in the bundle choice option varied according to the
experimental condition. For the “joint, integrated” condition, only a single price was
displayed, the randomly generated bundle price from above. In the “joint, segregated”
condition, separate prices were listed for the tote and garment bag in the bundle, both
of which were less than the list price of the individual items. The randomly generated
price of the bundle was partitioned to each item such that the implied percentage
discount from the individual list prices was the same for the tote and garment bag. For
the price leader condition, the “non-leader” item in the bundle had a price equal to its
individual list price in that choice set. The price for the “leader” was then the difference
between the randomly generated bundle price, and the price for the non-leader item.
Each subject saw the same bundling frame for each of their six choice sets.
4 Data and analysis
In this section we provide relevant summary data, test the hypothesis that framing
matters, and estimate a simple statistical model that permits testing of alternative
information processing models. A total of 336 respondents completed the on-line
survey. Of those, 118 respondents selected “none” in each of the six choice tasks;
these respondents were removed from the analysis as they were deemed to not “be in
the market” for the listed products and/or the price range was not relevant for them.
Table 2 displays the initial and final sample size in each of the experimental
conditions.
�Market Lett (2008) 19:125–139
133
Table 2 Initial and final sample sizes
Initial
Final
Joint, integrated
pricing
Joint, segregated
pricing
Tote as price
leader
Garment bag as price
leader
90
61
73
47
86
51
87
59
Since the prices presented to respondents were randomly determined for each of the
six choice sets, a one-way analysis of variance was conducted to test for systematic
differences in prices across the four versions of the survey. The null hypothesis of no
difference between the groups could not be rejected for the listed price of the garment bag
(p=0.221), the tote (p=0.304), or the price of the bundle (p=0.137). Since there is no
systematic difference in prices, an analysis of choice outcomes by framing condition
was conducted. As is typical in discrete choice analysis, both choices and individuals
are assumed to be independent. Table 3 presents a simple cross-tab of the results.
The “joint, integrated” price frame resulted in the highest percentage of choices for the
bundle. A �2 test of independence between the framing effect and the choices is rejected
(p=0.011) as is an asymptotic z test of the null hypothesis that the percent choosing the
bundle in the “joint, integrated” condition is equal to that in the “joint, segregated”
condition (p=0.027), “tote as price leader” (p=0.003), or “garment bag as price leader”
(p<0.001). There is also evidence that the “joint, integrated” condition results in a
smaller proportion of “none” choices than the “joint, segregated” condition (p=0.078),
“tote as price leader” (p=0.043), or “garment bag as price leader” (p=0.004). We
conclude that framing does matter, even in choice sets where respondents can choose
the component products, the bundle, or none.
Table 3 Choice outcome by framing effect aggregated over individuals and choices
Joint,
integrated
pricing
Joint, segregated
pricing
Tote as price leader
Garment bag as price
leader
Choice options
presented
Garment bag $XX Garment bag $XX
Tote $YY
Tote $YY
Garment bag and Garment bag
tote $ZZZ
$XX-x and tote
$YY-y
Neither
Neither
Garment bag $XX
Tote $YY
Buy Garment bag for
$XX and get Tote for
$YY-y
Neither
Garment bag $XX
Tote $YY
Buy Tote for $YY and
get Garment bag for
$XX-x
Neither
Garment bag
Tote
Bundle
None
7.7%
15.3%
48.1%
29.0%
100%
n=366
7.4%
17.7%
39.4%
35.5%
100%
n=282
10.8%
16.3%
36.6%
36.3%
100%
n=306
6.2%
19.5%
35.0%
39.9%
100%
n=354
47
51
59
No. of respondents 61
�134
Market Lett (2008) 19:125–139
We observe no significant difference in the percentage choosing the bundle between
the “tote as price leader” and the “garment bag as leader” conditions (asymptotic z test,
p=0.674). After the fact, there are two bases in the literature on which we might have
expected differences between these two conditions. Janiszewski and Cunha (2004)
conclude that the discount should be assigned to the product for which the difference
between the reference price and the offer price is on the steeper portion of the value
function. Using the expected average market price as each respondent's reference
price, we find a significant difference between the reference price for the garment bag
(mean=$80.54) and the tote (mean=$70.05), (asymptotic z test, p=0.002). Despite the
difference in reference prices and the equivalence in offer prices, we see no difference
in the attractiveness of the bundle between the two price leader conditions.
In contrast, Yadav (1995) suggests that the most preferred item should be the lead
product as consumers will put more “weight” on the preferred item when evaluating
the bundle. We do not have an a priori measure of relative preference. However,
Table 4 shows the proportion of respondents who chose each item (including the
bundle) at least once across his/her six choice sets. Across the four experimental
conditions, the tote was selected on its own more frequently than the garment bag
(asymptotic z test, p<0.001). This suggests that the tote was the preferred item and
we would have expected to see the “tote as price leader” generate more choices for
the bundle than the “garment bag as price leader” condition.
4.1 Model results
Why did the integrated price frame result in the greatest proportion of respondents
choosing the bundle and the smallest proportion choosing the “none” option? We
can examine the roles played by reference prices and transaction utility in these
choices by modeling the value of each choice alternative to be a function of
reference and actual prices (as per Eq. 2). The aggregate model fit statistics tell us
which of the three theoretical explanations best fit the data overall. The individual
level parameters indicate how many subjects are using reference prices.
Each respondent's self-reported average expected market
� �price� for the garment
bag and tote are used as proxies for
the
reference
prices
Ph1 ; Ph2 in Eq. 2. The
� �
reference price for the bundles Ph3
were calculated according to either the
“combining prices” or “two comparison” information processing assumptions
illustrated in Fig. 1 and Table 1. Separate models were estimated for each
assumption. The price for the bundle Ph3t in the “joint, segregated” and price leader
conditions was entered as the sum of the listed price of each item in the bundle.
Markov chain Monte Carlo (MCMC) methods were used to estimate the model in
Eq. 2. We assume that the error terms ɛ are independently and identically distributed
according to a standard normal distribution, ɛ~N(0, 1) leading to a probit model3.
(See Rossi et al. (2005) and references therein for more information on estimating
3
The model of Jedidi et al. (2003) allows for correlated error terms, e.g. ε~N(0, Λ) while ours restricts the
covariance matrix to equal the identity matrix. With the price coefficient restricted to equal −1, this should
allow estimation of a full covariance matrix. However, using standard prior distributions, we were unable
to obtain stable posterior distributions across all data sets and models with an unconstrained error
covariance matrix. In order to facilitate comparisons, we adopted the more restrictive assumption.
�Market Lett (2008) 19:125–139
135
Table 4 Percentage of respondents choosing item at least once across six choice sets
Garment bag
Tote
Bundle
Joint, integrated
pricing (%)
Joint, segregated
pricing (%)
Tote as price
leader (%)
Garment bag as
price leader (%)
26
39
80
23
40
72
33
37
73
17
46
68
heterogeneous probit models via Bayesian methods.) We specify a hierarchical
model with the distribution of heterogeneity as {αh, βh}~N(θ, Σ) where θ is of
dimension 5 for the full model and Σ is 5�5. This model hierarchy allows estimation
of all individual level parameters.4
4.1.1 Aggregate model fit
The posterior mean of the “hit probability” and the means square error (MSE) are
provided in Table 5 together with the log marginal density (LMD). The “hit
probability” is the predicted choice probability for the chosen alternative averaged
across choice sets and individuals. The MSE is equal to (1−hit prob)2 averaged
across choice sets and individuals. A larger “hit probability” indicates a better fitting
model; i.e., a superior ability to explain subjects’ choices. A smaller MSE indicates a
better fitting model. The log marginal density (LMD) is a Bayesian measure of
model adequacy proposed by Newton and Raftery (1994). The LMD contains an
implicit penalty for the number of parameters in the model and favors the model
with the highest value. Note however, that the LMD cannot be compared across
different framing conditions because they contain different numbers of observations.
In Table 5, model 1, the reservation price model assumes that consumers do not
use reference prices in evaluating individual products or the bundle. Formally, the
gain and loss coefficients in Eq. 2 are held constant at zero, e.g. βh,gain =βh,loss =0.
Comparison of model 1 with the others isolates the effect of reference prices. Model
2 estimates the full Eq. 2 and assumes that subjects make comparisons of the total
bundle price (whether it is given as integrated or they do the math when it is
segregated; see panels A and B of Fig. 1) to the sum of individual item reference
prices. The third set of columns in Table 5 capture model 3, which allows that
subjects are utilizing the full reference price information as Thaler’s model suggests,
evaluating gains and losses on each item by comparing sale prices to reference prices
(Fig. 1c). Note that model 3 cannot be estimated for the joint, integrated bundle
condition because respondents see only one price for the bundle and can't compare
individual reference prices.
4
Prior distributions on θ and Σ were chosen to be proper, but as uninformative as possible while still
resulting in stable posterior distributions for θ and Σ. The chains appeared to converge quickly but were
allowed to run for 50,000 iterations to ensure that the initial conditions were dissipated. A sample of every
10th from the next 250,000 iterations was used to calculate posterior means and standard deviations for
elements of the hyper-parameters θ and Σ. Model fit statistics were calculated using a sample of every
180th observation from the last 180,000 iterations. Full model results are available from the authors.
�136
Market Lett (2008) 19:125–139
Table 5 Model fit statistics
Framing effect
Joint, integrated
Joint, segregated
Tote leader
Garment bag leader
Model 1 reservation price Model 2 (Fig. 1a and b)
Model 3 (Fig. 1c) 2
model
combining reference prices comparisons of reference
prices
LMD
Hit prob MSE
LMD
Hit prob MSE
−304.3
−386.6
−388.7
−491.4
0.8193
0.7596
0.7540
0.7522
−164.8
−166.3
−186.4
−230.8
0.8138
0.7754
0.7972
0.7637
0.1420
0.2001
0.2023
0.2083
LMD
Hit prob MSE
0.1208
0.1491 −152.3 0.8037
0.1403 −177.8 0.8247
0.1610 −207.8 0.7910
0.1308
0.1245
0.1433
LMD Log marginal density, Newton and Raftery (1994); Hit prob posterior average choice probability of
the chosen alternative; MSE posterior average of (1−hit prob)2
LMD cannot be compared across versions due to different sample sizes. LMD and Hit prob favor the
highest number. MSE favors the lowest number. Sample size of 1,000 used for all calculations. Every
180th from the last 180,00 iterations used.
We find that models 2 and 3—which incorporate reference prices and transaction
utility—fit the data substantially better than the simple reservation price model,
model 1. For the “joint, integrated” frame, the LMD and MSE fit statistics both
strongly favor the “combining” reference price model. Since the “hit probability” is
essentially the same, we conclude that the “combining” reference price model fits
better than the reservation price model by more accurately predicting “low
probability” choices5. For the remaining price frames, all fit measures uniformly
favor the “two comparison” reference price model. This is strong evidence that when
prices of items in a bundle are itemized or segregated, some consumers compare
reference prices to prices separately, as opposed to combining them. When gains and
losses are treated asymmetrically, this can alter choice outcomes.
4.1.2 Individual level parameters
An examination of the individual level parameters however, suggests that not all
respondents use reference prices in making choices. A strength of the hierarchical
Bayesian model employed here is that we can look at the posterior distribution of
individual level parameters. This reveals an interesting paradox. There are enough
subjects attending to individual reference prices to produce a superior aggregate fit
for model 3, the “two comparison” model, as reflected in Table 5, yet, the majority
of respondents do not use reference prices. Recall that the simple reservation price
model is nested in the other models when βh,gain =βh,loss =0; based on the individual
level parameters, we find that this model describes 53% of respondents.
Nonetheless, two items are worth noting. First, the “joint, integrated” frame has
the highest percent of respondents with βh,gain =βh,loss =0 (64%) suggesting that
when prices are integrated, consumers are less likely to use reference prices and
5
The LMD represents a logarithmic penalty function for being “wrong” and the MSE is a quadratic
penalty function. These two measures tend to penalize “low probability predictions” more than the “hit
probability,” which is a linear penalty function.
�Market Lett (2008) 19:125–139
137
calculate transaction value. Second, since the “joint, integrated” frame has the
highest proportion choosing the “bundle” in the choice experiment, framings that
lead to using reference prices and calculating the transaction value apparently result
in fewer choices for the bundled offering.
5 Conclusions
Our data suggest that, in a mixed price bundling context, a “joint, integrated”
framing results in a significant increase in the probability that consumers choose the
bundle. This increase in bundle choice probability comes from fewer consumers
choosing the “none” option and thus represents a net expansion in the number of
individual customers. The superiority of the “joint, integrated” frame extends
previous findings because we document it in a discrete choice environment and use
the same stimuli and population to test all the competing price frames: integrated,
segregated, and leader price frames.
The individual level parameter estimates indicate that only a minority of
respondents appear to be comparing reference prices as implied by prospect theory
and mental accounting. This raises several questions. First, past research relied on
aggregate level analysis when using “gains and losses” to explain different consumer
evaluations of bundling. Could these past findings also have been driven by only a
portion of respondents? Second, given that less than half of respondents apparently
use reference prices, is this the true mechanism to explain differences in choice
outcomes across framing effects? Or, is some other individual level construct
necessary to understand the differences in observed bundle evaluations.6
There are several challenges to using discrete choice experiments to investigate
price framing effects. First, participants may not be “fully engaged” in a repeated
choice experiment when only the price varies from choice set to choice set. This
would result in poor fitting models and an inability to discriminate between different
behavioral theories. Second, the “reference price” may evolve over time as a
respondent is exposed to different prices. To test this we fit a “dynamic reference”
price model in which the reference price in each choice set was equal to the lowest
price seen so far by the respondent; however, we were unable to measure an
improvement in model fit. Third, there may be correlation between respondent's
choices or between alternatives that is not fully captured by our heterogeneous probit
model. These challenges may be addressed with richer data collection environments
and/or statistical models.
Additional research using discrete choice experiments is warranted in our view
because it more directly reflects the actual choice context confronting consumers in
mixed bundling. In fact it can be argued that the primary goal of most mixed
bundling offers is to cross-sell those consumers who already do or are likely to buy
one component (cf. Guiltinan 1987). Thus, consumers who have a strong affinity for
6
In addition, see the study by Grewal et al. (1998) that calls into question the independence of “acquisition
value” and “transaction value.”
�138
Market Lett (2008) 19:125–139
one component of a bundle may provide positive evaluations of the overall bundle
(cf. Simonin and Ruth 1995; Gaeth et al. 1990; Yadav 1994) but this may not always
translate into purchase of the bundle—especially when one option is to purchase
only the strongly desired item.
References
Adams, W., & Yellen, J. (1976). Commodity bundling and the burden of monopoly. Quarterly Journal of
Economics, 90, 475–498.
Dhar, R. (1997). Consumer preference for a no-choice option. Journal of Consumer Research, 24, 215–231.
Dhar, R., & Simonson, I. (2003). The effect of forced choice on choice. Journal of Marketing Research,
40, 146–160.
Gaeth, G., Levin, I., Chakrabothy, G., & Levin, A. (1990). Consumer evaluation of multi-product bundles:
An information integration approach. Marketing Letters, 2, 47–57.
Grewal, D., Monroe, K. B., & Krishnan, R. (1998). The effects of price-comparison advertising on buyers
perceptions of acquisition value, transaction value, and behavioral intentions. Journal of Marketing,
62, 46–59.
Guiltinan, J. (1987). The price bundling of services: A normative framework. Journal of Marketing, 51,
74–85.
Harlam, B., Krishna, A., Lehmann, D., & Mela, C. (1995). Impact of bundle type, price framing, and
familiarity on purchase intention for the bundle. Journal of Business Research, 33, 57–66.
Herrmann, A., Huber, F., & Coulter, R. H. (1997). Product and service bundling decisions and their effect
on purchase intention. Pricing Strategy & Practice, 5, 99–107.
Janiszewski, C., & Cunha, M. (2004). The influence of price discount framing on the evaluation of a
product bundle. Journal of Consumer Research, 30(4), 534–546.
Jedidi, K., Jagpal, S., & Manchanda, P. (2003). Measuring heterogeneous reservation prices for product
bundling. Marketing Science, 22, 107–130.
Kahneman, D., & Tversky, A. (1979). Prospect theory: An analysis of decision under risk. Econometrica,
47, 263–265.
Kaicker, A., Bearden, W., & Manning, K. (1995). Component versus bundle pricing: The role of selling
price deviations from price expectations. Journal of Business Research, 33, 231–239.
Karni, E., & Schwarz, A. (1977). Search theory: The case of search with uncertain recall. Journal of
Economic Theory, 16, 38–52.
Lanzetta, J. T. (1963). Information acquisition in decision-making. In O. J. Harvey (Ed.) Motivation and
social interaction-cognitive determinants (pp. 239–265). New York: Ronald.
Mazumdar, T., & Jun, S. Y. (1993). Consumer evaluations of multiple versus single price change. Journal
of Consumer Research, 20, 441–450 (December).
Newton, M. A., & Raftery, A. E. (1994). Approximating Bayesian inference with the weighted likelihood
bootstrap. Journal of the Royal Statistical Society (B), 56, 3–48.
Rossi, P. E., Allenby, G. M., & McCulloch, R. (2005). Bayesian statistics and marketing. West Sussex,
England: Wiley.
Rothschild, M. (1974). Searching for the lowest price when the distribution of prices is unknown. Journal
of Political Economy, 82, 689–711.
Simonin, B., & Ruth, J. (1995). Bundling as a strategy for new product introduction: Effects on
consumers’ tie-in. Journal of Business Research, 33, 219–230.
Stremersch, S., & Tellis, G. (2002). Strategic bundling of products and prices: A new synthesis for
marketing. Journal of Marketing, 66, 55–72.
Stigler, G. J. (1961). The economics of information. Journal of Political Economy, 69(3), 213–225.
Stigler, G. (1968). A note on block booking. The organization of industry. Homewood, IL: R.D. Irwin.
Thaler, R. (1985). Mental accounting and consumer choice. Marketing Science, 4, 199–214.
Tversky, A., & Shafir, E. (1992). Choice under conflict: The dynamics of deferred decision. Psychological
Science, 3, 358–361 (November).
Urbany, J. E., Dickson, P. R., & Wilkie, W. L. (1989). Buyer uncertainty and information search. Journal
of Consumer Research, 16, 208–215.
�Market Lett (2008) 19:125–139
139
Venkatesh, R., & Kamakura, W. (2003). Optimal bundling and pricing under a monopoly: Contrasting
complements and substitutes from independently valued products. The Journal of Business, 76(2),
211–231.
Yadav, M. (1994). How buyers evaluate product bundles: A model of anchoring and adjustment. Journal
of Consumer Research, 21, 342–353.
Yadav, M. (1995). Bundle evaluation in different market segments: The effects of discount framing and
buyers’ preference heterogeneity. Journal of the Academy of Marketing Science, 23, 206–215.
Yadav, M., & Monroe, K. (1993). How buyers perceive savings in a bundle price: An examination of a
bundle’s transaction value. Journal of Marketing Research, 30, 350–358.
�
 Joseph Guiltinan