The geographic distribution of radionuclide deposition across the continental US from atmospheric nuclear testing
 Andre Bouville
2004, Journal of Environmental Radioactivity
Free related PDFsRelated papers
Free PDF

A Method for Estimating the Deposition Density of Fallout on the Ground and on Vegetation from a Low-yield, Low-altitude Nuclear Detonation
Health Physics, 2022
This paper describes a relatively simple model developed from observations of local fallout from US and USSR nuclear tests that allows reasonable estimates to be made of the deposition density (activity per unit area) on both the ground and on vegetation for each radionuclide of interest produced in a nuclear fission detonation as a function of location and time after the explosion. In addition to accounting for decay rate and in-growth of radionuclides, the model accounts for the fractionation (modification of the relative activity of various fission and activation products in fallout relative to that produced in the explosion) that results from differences in the condensation temperatures of the various fission and activation products produced in the explosion. The proposed methodology can be used to estimate the deposition density of all fallout radionuclides produced in a low yield, low altitude fission detonation that contribute significantly to dose. The method requires only data from post-detonation measurements of exposure rate (or beta or a specific nuclide activity) and fallout time-of-arrival. These deposition-density estimates allow retrospective as well as rapid prospective estimates to be made of both external and internal radiation exposure to downwind populations living within a few hundred kilometers of ground zero, as described in the companion papers in this volume.
Free PDF


New simple deposition model based on reassessment of global fallout data 1954 – 1976: Final report from the NKS-B activity DepEstimates
2012
Atmospheric testing of nuclear weapons began in 1945 and largely ceased in 1963. This testing is the major cause of distribution of man-made radionuclides over the globe and constitutes a background that needs to be considered when effects of other sources are estimated. The main radionuclides of long term (after the first months) concern are generally assumed to be 137Cs and 90Sr. It has been known for a long time that the deposition density of 137Cs and 90Sr is approximately proportional to the amount of precipitation. But the use of this proportional relationship raised some questions such as (a) over how large area can it be assumed that the concentration in precipitation is the same at any given time; (b) how does this agree with the observed latitude dependency of deposition density and (c) are the any other parameters that could be of use in a simple model describing global fallout? These issues were amongst those taken up in the NKS-B EcoDoses activity. The preliminary resul...
Free PDF


Artificial intelligence development races in heterogeneous settings
Scientific Reports, 2022
Regulation of advanced technologies such as Artificial Intelligence (AI) has become increasingly important, given the associated risks and apparent ethical issues. With the great benefits promised from being able to first supply such technologies, safety precautions and societal consequences might be ignored or shortchanged in exchange for speeding up the development, therefore engendering a racing narrative among the developers. Starting from a game-theoretical model describing an idealised technology race in a fully connected world of players, here we investigate how different interaction structures among race participants can alter collective choices and requirements for regulatory actions. Our findings indicate that, when participants portray a strong diversity in terms of connections and peer-influence (e.g., when scale-free networks shape interactions among parties), the conflicts that exist in homogeneous settings are significantly reduced, thereby lessening the need for regu...
Free PDF

Journal of Environmental Radioactivity 74 (2004) 91–105
www.elsevier.com/locate/jenvrad
The geographic distribution of radionuclide
deposition across the continental US from
atmospheric nuclear testing
Steven L. Simon a,, André Bouville a, Harold L. Beck b,1
a
Division of Cancer Epidemiology and Genetics, Radiation Epidemiology Branch, National Cancer
Institute, National Institutes of Health, Executive Plaza South, 6120 Executive Boulevard,
Bethesda, MD 20892-7238, USA
b
US Department of Energy Environmental Measurements Laboratory, New York, NY, USA
Abstract
For the first time, calculations for the more than 3000 counties of the US have been completed that estimate the average deposition density (Bq m2) of more than 40 radionuclides
in fallout from atmospheric nuclear weapons tests conducted in the US (1951–1962) and 19
radionuclides from tests conducted elsewhere in the world (1952–1963). The geographic pattern of deposition across the US, as well as the amount of fallout deposited, varied significantly depending on whether the tests were conducted within or outside of the US. Fallout
deposited from the Nevada Test Site (NTS) varied geographically as a result of dispersion
and dilution in the atmosphere, the wind patterns following each test, and the occurrence of
localized rainfall events. In general, states immediately east of the NTS received the highest
deposition from tests conducted there. In contrast, the variation in deposition across the
country from global fallout was less than for NTS fallout primarily reflecting variations in
annual precipitation across larger regions. Hence, in the eastern and mid-western US, where
rainfall is above the national average, higher levels of global fallout were deposited than in
the more arid southwestern states. This paper presents a summary of the methods used and
findings of our studies on fallout from NTS and global fallout, with emphasis on two of the
most important radionuclides, 131I and 137Cs.
Published by Elsevier Ltd.
Keywords: Fallout; Nuclear testing; Deposition;
131
I; 137Cs
Corresponding author. Tel.: +1-301-594-1390; fax: +1-301-402-0207.
E-mail address: ssimon@mail.nih.gov (S.L. Simon).
1
Retired.
0265-931X/$ - see front matter Published by Elsevier Ltd.
doi:10.1016/j.jenvrad.2004.01.023
92
S.L. Simon et al. / J. Environ. Radioactivity 74 (2004) 91–105
1. Introduction and background
Interest among the US public and the scientific community in environmental
contamination and the possible health effects resulting from nuclear testing has
continued since the 1950s when atmospheric nuclear testing was frequent. In the
US, years of litigation by citizens alleging detrimental health effects led to a US
Congressional mandate in 1983 through US Public Law 97-414. This law directed
the Department of Health and Human Services (DHHS) to conduct scientific
research to develop credible methods to estimate the thyroid doses from 131I that
were received by individuals from radioactive fallout from nuclear testing, and to
assess exposure of the American people to 131I from the Nevada Test Site (NTS)
atmospheric nuclear weapons tests. The US National Cancer Institute responded
to this mandate and, after more than a decade of research, published a comprehensive report on the dispersion of radioiodine in fallout from the NTS, the contamination of milk across the country, and average thyroid organ doses received by the
public from 131I in all of the more than 3000 counties in the contiguous US (NCI,
1997). This voluminous work was followed by further public interest that led, in
1998, to another Congressional request for the DHHS to conduct an initial assessment on radiation dose, as well as to report on the public health implications associated with radioactive fallout from the testing of nuclear weapons worldwide. In
response to this request, the DHHS made preliminary estimates of the deposition
of the most important radionuclides in fallout, average doses received, and the
health risks associated with exposure to fallout from atmospheric nuclear weapons
tests conducted between 1951 and 1963 at the NTS and at other sites throughout
the world (DHHS, 2001). This paper summarizes findings on deposition of 11
important radionuclides investigated in those studies, with emphasis on the spatial
distributions of 131I and 137Cs fallout across the US. Doses received by Americans
are not discussed here due to space limitations. Such information can be found in
NCI (1997) (see http://i131.nci.nih.gov/) and DHHS (2001), see http://
www.cdc.gov/nceh/radiation/fallout/default.htm).
The testing of nuclear weapons in the atmosphere by the US at the NTS and in
the Pacific, and by other countries at various locations worldwide, took place from
1945 to 1980. Over 500 nuclear tests were carried out, having total explosive and
fission yields of 440 and 190 Mt, respectively (Beck and Bennett, 2002). Estimations of the local as well as nationwide inventories and spatial patterns of the
deposition of fallout radionuclides across the US from these tests should ideally be
based on direct measurement data but, because the number of monitoring stations
was generally not sufficient to provide a completely detailed description of contamination everywhere, estimates were made using indirect measurements (e.g.
exposure rate) having somewhat greater uncertainty. For areas for which there
were no measurement data, the deposition of fallout radionuclides was estimated
via interpolation of relevant data at nearby, or even moderately distant, locations,
although this gave rise to substantially greater uncertainty.
In this context, ‘‘fallout’’ refers to the radioactive debris dispersed through the
atmosphere from nuclear tests. The fallout can be of ‘‘local’’ origin, i.e., occur
S.L. Simon et al. / J. Environ. Radioactivity 74 (2004) 91–105
93
within a few hundred kilometers of the detonation site, or of ‘‘regional’’ origin,
referring to fallout anywhere in the US from the NTS. Fallout could also be ‘‘global’’ if the debris was dispersed via tropospheric or stratospheric circulation from
nuclear test sites throughout the world. These global sites that accounted for most
of the deposition in the US were those in the northern hemisphere, in particular, in
the Pacific and the former Soviet Union. Numerous reviews detail the whereabouts
of the various nuclear testing sites, the number of explosions and yields (Carter
and Moghissi, 1977; UNSCEAR, 2000; Beck and Bennett, 2002), and in some
cases, a summary of exposures received locally and regionally (Simon and Bouville,
2002), or globally (Bouville et al., 2002).
2. Methods
Various environmental monitoring programs were conducted in the US during
the years of atmospheric nuclear testing (see Beck and Bennett, 2002, Table 6),
though no single program was comprehensive in terms of the types of measurements made, temporal or geographic coverage. The various monitoring data, while
seemingly limited for an area as large as the U.S, have proven to be a useful
resource for making quantitative estimates of local deposition densities (Bq m2).
The interpretation of the measurement data into nationwide geographic patterns of
deposition densities of specific radionuclides is a more recent undertaking (NCI,
1997; DHHS, 2001).
The amount of nuclear debris generated and the geographic distribution of the
deposited fallout depend on a large number of variables including the location of
test(s), the explosive yield(s), height(s) of the burst(s), the type(s) of placement
structure(s) (tower, balloon, etc.), meteorological factors such as the directions and
speeds of the winds that can vary at different altitudes both on a local and regional
scale, and the presence or absence of precipitation at locations along the trajectories. Because of the complex nature of these mechanisms and phenomena, the
geographic distribution of fallout deposition across the US has not been reconstructed through dispersion modeling, but has been assessed primarily on the basis
of measurement data augmented with meteorological prediction models only when
necessary.
The tests conducted at the NTS had low yields, so that the radioactive clouds
originating from the atmospheric explosions remained in the lower layers of the
atmosphere and fallout deposition occurred within a few days time. The degree of
fallout generally decreased with distance from the NTS, and consisted predominantly of short-lived radionuclides, like 131I. The environmental measurements made after each test usually made it possible to relate the radioactive
contamination to specific tests and, thus, to estimate average radiation doses resulting from each of these tests.
In contrast, the radioactive fallout due to tests conducted far away from the US
(called ‘‘global fallout’’) was due primarily to high-yield tests, which resulted in
radioactive clouds that reached high layers of the atmosphere. It took months to
years for radionuclides to deposit on the ground from these altitudes. Within that
94
S.L. Simon et al. / J. Environ. Radioactivity 74 (2004) 91–105
time, relatively homogeneous mixing of the activity occurred in the high layers of
the atmosphere within latitudinal bands all around the world, while the activity
that gradually descended to lower atmospheric layers was preferentially removed
from the atmosphere via precipitation. Consequently, variations of the deposition
of global fallout in the US with longitude and latitude were relatively small, the
main differences due to local and regional differences in precipitation. Fallout from
these tests consisted predominantly of long-lived radionuclides, like 90Sr and 137Cs,
as most of the short-lived radionuclides decayed before they were deposited on the
ground. Environmental measurements made at this time did not make it possible
to relate the contamination to a specific test.
Because of those differences, fallout from tests conducted at the NTS and from
tests carried out far away from the US are considered separately.
2.1. Deposition of
131
I from the NTS
Iodine-131, now recognized as one of the most important radionuclides in terms
of public exposures, was not measured directly in the 1950s because most measurements of environmental radioactivity at that time were limited to gross beta (b)
activity, or to radiochemical measurements of 90Sr, the radionuclide of most concern at the time. Measurements of 131I in the environment were not performed to
any significant extent before 1960.
The data on which we relied for estimating the amounts of 131I deposited on
the ground were: (1) ground-level exposure rates (Beck and Anspaugh, 1991;
Thompson et al., 1994); and (2) measurements of total b-activity deposited on
sticky paper (more commonly called gummed film) as part of a systematic monitoring program by the US Health and Safety Laboratory (Harley et al., 1960; Bouville
and Beck, 2000).
For counties nearest the NTS, the primary data used for estimation were
exposure-rate measurements made for several days following each test with portable survey instruments. These exposure-rate measurements, together with other,
less extensive, monitoring data, were evaluated and archived by the Offsite Radiation Exposure Review Project (ORERP) of the Department of Energy (Church
et al., 1990). From these data, two databases were developed: the Town Data Base
(Thompson et al., 1994) and the County Data Base (Beck and Anspaugh, 1991).
Both databases provided exposure rates normalized to 12 h post-detonation
(H þ 12) and estimated times of transit (measured in hours) for the fallout to arrive
at the measurement location (typically called the time of arrival). The areas
included in the two databases were parts or the entirety of the states of Arizona,
California, Colorado, Idaho, New Mexico, Nevada, Oregon, Utah, and Wyoming.
Monitoring of fallout deposition at greater distances was carried out primarily
by the Health and Safety Laboratory (HASL) of the Atomic Energy Commission
(AEC) in cooperation with the US Weather Bureau (Harley et al., 1960; Beck,
1984; Bouville and Beck, 2000). Beginning in the fall of 1951, the monitoring technique employed consisted of collectors in the form of trays of water, though these
devices were replaced by gummed paper for the 1952 test series. The gummed
S.L. Simon et al. / J. Environ. Radioactivity 74 (2004) 91–105
95
paper was replaced by an acetate-backed rubber-base cement gummed film in 1953,
and this medium was used until the program ended in 1960. A 0:3 m 0:3 m
(1 ft2) area of gummed film was positioned horizontally on a stand about 0.9 m
above the ground. Usually two replicate films were exposed simultaneously during
a 24-h period. The collected samples were ashed and counted for total b-activity.
The number and types of monitoring sites in operation in the US varied from one
year to another; the maximum number of sites was 95 in 1953.
In this research, measurement data of either exposure rate or b-activity per unit
area were converted to deposition density (Bq m2) of 131I via relationships and
factors developed by Hicks (1981, 1982, 1984). Factors specific to each test at the
NTS were developed to take account of differences in bomb composition and
design, though some of these data remain classified. One critical element in converting either type of measurement to a specific radionuclide activity is the time of
the measurement relative to the time of the detonation. It is also known that factors such as distance and whether wet or dry deposition is involved affects the composition of the radionuclide mixture deposited on the ground, though the Hicks
methodology, as used here, does not make adjustments for these factors.
The quantitative estimation of the deposition densities of 131I (Bq m2) from the
gross b-activity measurements was a use not foreseen in the original design of the
gummed-film monitoring program (Beck et al., 1990). However, the value of these
data for that purpose has been proven in several dose reconstruction studies (Beck
and Bennett, 2002). When there were sufficient numbers of 131I deposition estimates across the US, they were used, together with precipitation data, to interpolate values of deposition in counties in which there were no b-activity
measurements. The interpolation procedure used kriging, a statistical technique
that minimizes estimation variance from a predefined covariance model (see, for
example, Clark, 1979; Isaaks and Srivastava, 1989; Cressie, 1993). Where kriging
was unlikely to be satisfactory because of limitations in the availability of deposition estimates, a simpler method was employed using the deposition estimate
from the nearest county having monitoring data and the precipitation data for
both counties (NCI, 1997).
The daily deposition densities in each county following individual NTS tests
were summed to obtain totals for each test. It should be understood that the total
deposition densities reported by NCI (1997) and DHHS (2001), and in Figs. 1–3,
are time-integrated values, i.e. they represent a summation of the activity deposited
at the times of deposition, without taking radioactive decay into account.
2.2. Deposition of radionuclides other than
131
I from the NTS
The estimation of radionuclides other than 131I from the NTS relied on previously published methods, e.g. Hicks (1982, 1990); Beck et al. (1990); Church et al.
(1990); Beck (1996), and NCI (1997) estimates of 131I (see Fig. 1). In this research,
we estimated deposition densities for 42 additional radionuclides generated from
about 60 of the approximately 100 atmospheric tests conducted at the NTS. These
96
S.L. Simon et al. / J. Environ. Radioactivity 74 (2004) 91–105
Fig. 1. Estimated 131I deposition density (Bq m2) from NTS fallout across the continental US.
60 tests account for over 95% of the total 131I produced there. The radionuclides
considered included all those that contributed significantly to either external
exposure or to internal exposure via ingestion. They included isotopes of the
elements strontium, yttrium, zirconium, niobium, molybdenum, technetium,
ruthenium, rhodium, iodine, tellurium, cesium, barium, lanthanum, cerium, praseodymium, neodymium, promethium, neptunium, plutonium, and americium.
The starting point for the estimation of the deposition of these various radionuclides was the daily 131I deposition density estimates (the sum of which is shown
in Fig. 1) from NCI (1997). Calculations were carried out separately for each
county of the US and, in some cases, for areas smaller than counties when the
deposition varied greatly within the county. The daily estimates were summed to
provide totals for each test, each year, and for the entire NTS testing program. The
county-specific deposition densities of each nuclide were calculated using the following three steps:
1. The daily 131I deposition density estimates were decay corrected back to 12 h
post-detonation (H þ 12).
2. Using the relationships developed by Hicks (1981), the calculated ratio of each
radionuclide being estimated to the corresponding 131I value at H þ 12 (including the 131I that will subsequently grow in from precursors) was calculated as a
function of fallout arrival time.
S.L. Simon et al. / J. Environ. Radioactivity 74 (2004) 91–105
97
Fig. 2. Estimated 137Cs deposition density (Bq m2) from NTS fallout across the continental US.
3. The 131I deposition density estimate for each day of fallout (corrected back to
H þ 12), obtained in step 1, was multiplied by the nuclide-specific ratio calculated for each day’s arrival (obtained in step 2) to estimate the deposition density on each day for the particular nuclide.
Generally, about 10 days of measurements had to be considered for each nuclear
test, although a few tests produced significant fallout for periods of up to 2 weeks.
Daily deposition densities were calculated only for short-lived nuclides (those with
half-lives less than 30 days). For longer-lived nuclides, their ratios to 131I at H þ 12
did not vary significantly over the first several weeks of fallout and, thus, the
total test deposition could be calculated directly from the sum of the daily 131I
depositions.
Plutonium isotopes were also present in the fallout from Nevada weapons tests.
Plutonium isotopes do not contribute significantly to external exposure, contribute
in only a minor way to ingestion dose and, normally, contribute only a small fraction of the fallout-related inhalation dose (Church et al., 1990). Nevertheless, there
remains public interest in the isotopes of plutonium and for this reason, deposition
estimates for such nuclides were made. These latter estimates were necessarily
crude, however, because the ratios of Pu to 137Cs, 90Sr, etc. are still classified.
Average deposition of 239þ240 Pu in counties of the US was estimated to vary from
98
S.L. Simon et al. / J. Environ. Radioactivity 74 (2004) 91–105
Fig. 3. Estimated 137Cs deposition density (Bq m2) from global fallout across the continental US.
0 to 150 Bq m2 (see Beck and Bennett, 2002, Fig. 18). No further discussion of
plutonium deposition is presented here. Interested readers are referred to Appendix
D of DHHS (2001), (see http://www.cdc.gov/nceh/radiation/fallout/default.htm).
2.3. Deposition of radionuclides from global fallout
Global fallout occurred mainly in the early 1960s and was primarily composed
of long-lived radionuclides (e.g. 90Sr and 137Cs). Relatively abundant measurements
of 90Sr, which was at that time considered to be more hazardous than 137Cs, were
made throughout the US.
The estimation of the geographic distribution of global fallout depends heavily
on data on rainfall patterns across the US. Previous US studies have demonstrated
that the deposition of 90Sr and 137Cs in global fallout was generally proportional
to the amount of precipitation over localized areas (Collins and Hallden, 1958;
Martell, 1959; Alexander et al., 1961; Hardy and Alexander, 1962; Hardy et al.,
1968; Krey and Beck, 1981; Beck and Krey, 1983). However, the relationship
between deposition density and rainfall (Bq m2 per cm of rain) was known to
vary significantly with both latitude and longitude across the continental U.S.
v
Historical data show that there was a maximum in the 35–40 latitude band.
S.L. Simon et al. / J. Environ. Radioactivity 74 (2004) 91–105
99
The deposition at low latitudes was observed to be less than at the latitude of peak
deposition by about a factor of two (Alexander et al., 1964). Similarly, a variation
in the deposition density of 90Sr per unit rainfall with longitude was observed from
1958–1965 at HASL monitoring sites. These data indicate a clear trend of a relatively constant deposition density per unit rainfall in the eastern US and a steep
increase towards the mountainous area of western Colorado, Utah, and Wyoming
(Beck and Bennett, 2002). The deposition density per unit rainfall reached a peak
at approximately the longitude of Salt Lake City and dropped steeply towards the
West Coast to levels lower than in the northeastern US. The observed dependencies with latitude and longitude were used to create a simple time-independent
model of the variation of 90Sr deposition over the country in order to estimate 90Sr
deposition densities for each county of the continental US (DHHS, 2001).
Data on daily precipitation amounts were obtained from records of over 8000
US Weather Service cooperative monitoring sites, some of which have operated
since about 1900. For this work, daily rainfall amounts at each measurement station were summed to produce a single estimate of monthly precipitation. A representative value for the rainfall within each county for each month during the
years 1953–1972 was obtained by averaging the data for each site in operation in
the county during that month. If no data were available for a county in a particular month, the value for the nearest county, as defined by the shortest distance
between county centroids, was used.
Prior to 1954, there were no reported measurements of 90Sr from which to make
a direct determination of the deposition density per unit rainfall. However, soil
sample data were available for a few sites in the eastern US. These provided a
crude estimate of the total deposition of 90Sr from global fallout up to 1954.
Almost all of that deposition was assumed to have occurred in 1953, primarily as a
result of the high yield US tests carried out in the Pacific in late 1952. Because
monitoring of fallout deposition was carried out at only a limited number of sites
in the US, a simple model of deposition density of 90Sr per centimeter of precipitation was constructed for estimation purposes by assuming a constant value
within 25 areas defined by latitude and longitude covering the US (see DHHS,
2001, Appendix F).
The method used to estimate the deposition of radionuclides from global fallout
comprises five steps:
1. The average precipitation for each month for each county of the continental US
was estimated from US Weather Service records;
2. The deposition density of 90Sr per unit precipitation in the northeast US for
each month from 1952 through 1971 was estimated from monitoring data where
available. The deposition for other areas of the US was estimated from measured monthly precipitation and a simple model describing the variation of 90Sr
deposition density per unit precipitation as a function of latitude and longitude;
3. The ratio of the deposition of each nuclide of interest to the deposition of 90Sr
for each month during the period 1953–1972 was estimated using actual data if
data were available, or, if no data were available for a particular period, a
100
S.L. Simon et al. / J. Environ. Radioactivity 74 (2004) 91–105
model was used to estimate the ratio of the deposition density of that nuclide to
that of a nuclide of similar half-life for which data were available;
4. The monthly deposition density of each radionuclide was then calculated by
multiplying its estimated ratio to 90Sr for that month by the estimated 90Sr
deposition density for that month; and
5. The total amount of each radionuclide deposited on the ground in each county
was calculated as the summation of the estimated monthly depositions.
It should be noted that the method described here does not account for dry
deposition. For most areas of the US, dry deposition was probably less than 10%
of the total deposition. Nevertheless, for any month in which the precipitation was
very low, dry deposition may have been more significant than estimated. The estimates for fallout in the arid west are likely to be under-estimated, though the total
fallout in these counties would still have been relatively small compared to counties
with annual precipitation rates equal to, or greater than, the national average.
3. Findings and discussion
The findings from these investigations are discussed at length in NCI (1997),
DHHS (2001), and Beck and Bennett (2002). This discussion is limited to a summary of the geographic pattern of deposition of 131I and 137Cs and to the total
nationwide deposition of nine other radionuclides.
The time-integrated deposition density of 131I (Bq m2) from all NTS tests, calculated as the geometric mean value for each county and interpolated (smoothed)
via commercially available mapping software, is shown in Fig. 1. The estimated
time-integrated deposition densities for all counties ranged from less than
50 kBq m2 to about 1400 kBq m2. The pattern of deposition shows the highest
values in an oval shaped area that extends from the NTS in a southeast direction
over the corner of the state of Utah (Washington County, Utah). The average
deposition density in these counties was 1000 kBq m2 or larger. A considerably
larger area with lower deposition values (600 kBq m2 or less) extended north,
northeast, and southeast in an irregularly shaped pattern with the NTS as the focal
point. Most of the rest of the US, in particular the coasts and the distant eastern
states, had very low levels of deposition of 131I from the NTS except for isolated
locations where rainout events occurred. The well-documented elevated deposition
in northern New York State was due to heavy thunderstorm activity during passage of the cloud from shot SIMON in April, 1953 (Hoecker and Machta, 1990;
Beck et al., 1990).
The geographic pattern of deposited 131I from global fallout is still under investigation. Uncertainties in individual county deposition estimates are presently too
great to produce a reliable map or geographic pattern. However, in our research
we estimated a total deposition of 131I of about 1:1 107 Bq over the US from global fallout (Table 1). Calculations indicated that fallout from the NTS deposited
about 13 times more 131I within the US than did global fallout (DHHS, 2001) even
S.L. Simon et al. / J. Environ. Radioactivity 74 (2004) 91–105
101
Table 1
Total deposition (Bq) and population-weighted deposition density (kBq m2) of selected radionuclides in
the US from NTS and global fallout (DHHS, 2001)
Nuclide
131
I
Ba
141
Ce
103
Ru
89
Sr
95
Zr
144
Ce
106
Ru
90
Sr
137
Cs
140
239þ240
Pu
Half-life
8.02 d
12.8 d
32.5 d
39.3 d
50.5 d
64.0 d
285 d
374 d
28.8 y
30.1 y
24,100 y/6560 y
Total deposition
( 1015 Bq)
Population-weighted deposition
density (kBq m2)
NTS
Global
NTS
Global
1480
1400
500
430
330
220
40
24
1.8
2.3
0.13
110
290
210
210
210
310
300
150
19
29
~0.4
190
140
54
46
36
25
4.6
2.6
0.11
0.26
~0.015
18
46
34
35
35
50
46
24
2.9
4.4
~0.06
though the fission yield of NTS tests was only about 0.5% of the total fission yield
worldwide (Beck and Bennett, 2002).
The time-integrated deposition density of 137Cs from all NTS tests examined
through 1962 is shown in Fig. 2. The pattern of deposition is similar to that for
131
I (Fig. 1), although, due to its long half-life, the decrease in 137Cs activity in the
eastern US with increasing distance from the NTS is less than that for 131I. Timeintegrated deposition densities ranged from more than 1 kBq m2 near to the NTS
and along a high-rainfall corridor of the Rocky Mountains in Colorado to about
0.7 kBq m2 on the Central Plains, and to less than 0.1 kBq m2 for the coastal
areas of the US. Similar to the case for 131I, the regional and local variations are
due primarily to variations in precipitation.
The fraction of the total 137Cs deposited in the continental US from NTS fallout
varied by year. For example, the Plumbbob series in 1957 deposited 35% of the
total NTS-related 137Cs, followed by the Upshot Knothole series in 1953 that
deposited 23%. In each county, the fraction of the total activity deposited in each
year differed due to variations in directions and altitudes of fallout trajectories.
Two tests (SIMON and HARRY) from the 1953 Upshot-Knothole series deposited
the most 137Cs of any NTS test. Test HARRY deposited the most 131I (NCI,
1997). The total amount of 137Cs deposited in the continental US from all NTS
tests was about 2:3 1015 Bq.
The time-integrated deposition density of 137Cs from global fallout is shown in
Fig. 3 and has a clearly different geographic pattern from that of NTS fallout,
primarily reflecting the greater long-term average precipitation rates in the eastern
US compared to the western states. Deposition of 137Cs in global fallout over the
eastern US varied between about 2.5 and 8 kBq m2 with large areas receiving 5–6
kBq m2. Most of the western US received relatively uniform but considerably
lower deposition of about 2.5 kBq m2 or less. Some exceptions were small regions
102
S.L. Simon et al. / J. Environ. Radioactivity 74 (2004) 91–105
in California, Idaho, and South Dakota, where high rainfall resulted in small areas
of deposition equal to the highest areas in the eastern US.
The total deposition (Bq) for 10 other selected radionuclides from both NTS and
global sources is shown in Table 1. The quantities of radionuclides that were
deposited primarily reflect their fission yields and half-lives. In general, the deposition patterns for nuclides originating either in NTS fallout or in global fallout
would be similar to their respective patterns of deposition of NTS and global
137
Cs. Table 1 also includes the time-integrated deposition density in each county
weighted by its population and then summed. The population-weighted total is an
appropriate indicator of the deposition that resulted in collective exposures to the
US population.
As noted, precipitation was the main mechanism for the deposition of fallout
from the high yield tests that injected their debris into the stratosphere. The three
maps graphically indicate that counties in the eastern and mid-western US that
received rainfall above the national average received more total deposition than
counties in the more arid southwestern states. Since the states downwind of the
NTS affected most by NTS fallout are, in general, more arid than the eastern US,
the areas most affected by NTS fallout were generally the least affected by global
fallout.
Other generalizations can be drawn from the figures and table provided. For
example, fallout in the US from the NTS contributed only about 5% of the total
deposition of the long-lived radionuclides, e.g. 90Sr and 137Cs. Most of the deposition of these radionuclides originated from high yield weapons tests carried out in
the Pacific and in the former Soviet Union. Conversely, the deposition of shortlived radionuclides from the NTS, such as 89Sr, 140Ba and 131I, was several times
that deposited by global fallout. For example, the total deposition of 131I in the US
from NTS fallout was about 1:5 1018 Bq, compared to 1:1 1017 Bq from global
fallout (Table 1).These results are consistent with the fact that although the total
fission yield of NTS tests was about 1 Mt, compared to about 150 Mt for tests outside the US, most of the debris from the large thermonuclear tests outside the US
was injected into the stratosphere. According to UNSCEAR (1993), the average
residence time for this stratospheric debris before re-entering the troposphere and
depositing is about 1 y. This delay in fallout deposition accounts for the reduced
deposition of the short-lived activity relative to the amounts produced.
Not obvious from the maps is that tests conducted at the NTS deposited only
about one-third of the 137Cs they produced within the continental US. The proportion of the radioactivity produced by different tests that was deposited within a
few hundred kilometers, as opposed to more distant locations, varied according to
the method of device placement. For example, nuclear devices exploded on metal
towers generated a larger proportion of heavy metallic particles that were
deposited very close to the NTS, while air bursts that generated few such particles
appeared to deposit greater fractions at distances of 1500–2500 km.
It is clear from the investigations we conducted that our calculations have
numerous uncertainties, possibly the most significant source being the limited
measurement data on which county deposition density estimates were based. Gum-
S.L. Simon et al. / J. Environ. Radioactivity 74 (2004) 91–105
103
med-film measurements made at up to only about 100 locations after NTS tests
required extensive interpolation to estimate deposition over large distance scales.
Moreover, county estimates can only represent, at best, an average over the
county, but cannot accurately or completely characterize local areas where
meteorological or geographic characteristics resulted in higher or lower than
average deposition.
In the area near to the NTS, estimating deposition from the large set of exposure
rate measurements processed by the ORERP constitutes the preferred estimation
method because these measurements were specific to a location and time and the
response of the instruments is well understood and less variable than the gummedfilm measurements.
4. Concluding remarks
The geographic pattern of deposition of 137Cs from NTS and global fallout has
been evaluated as well as the geographic pattern of 131I deposition from NTS fallout. In addition, the deposition patterns and total nationwide inventories of
numerous other fallout-related radionuclides have been evaluated for the first time.
The geographic distribution of 131I from global fallout is still highly uncertain,
although the total nationwide deposition has been estimated.
Many of the calculations can be improved through further identification of historical data, more detailed analysis of data sets and, possibly, through the development of more sophisticated models of wet and dry deposition as well as latitude
and longitude variations. Some limitations will remain, however, in that the
amount of useful historical data will always be limited with respect to the size and
geographic variability of the continental US. Nevertheless, these unique estimates
of radionuclide deposition have been part of an effective response to public inquiries about the consequences of atmospheric nuclear testing in the US. Average doses
and consequential health risks to the American population have also been assessed
but are not discussed here. Interested readers are referred to the cited references.
Acknowledgements
The authors are grateful to Mark Buckley who provided graphics support.
References
Alexander, L.T., Jordan, R.N., Dever, R.F., Hardy, E.P., Hamada, G.H., Machta, L., List, R.J., 1961.
Sr-90 on the Earth’s surface, U.S. Atomic Energy Commission Report TID-6567, New York, NY.
Alexander, L., Meyer, M., Allen, J.S., Hardy, E.P., 1964. Cumulative deposition of strontium-90 along a
mid-United States constant precipitation transect. U.S. Atomic Energy Commission Report
HASL-149. New York, NY.
Beck, H.L., 1984. Estimates of fallout from Nevada weapons testing in the western United States based
on gummed-film monitoring data. U.S. Department of Energy Report EML-433. Environmental
Measurements Laboratory, New York, NY.
104
S.L. Simon et al. / J. Environ. Radioactivity 74 (2004) 91–105
Beck, H.L., 1996. Reconstructing source terms from environmental data. In: Proceedings of the ThirtyFirst Annual Meeting of the National Council on Radiation Protection and Measurements. Proceedings No. 17. NCRP, Bethesda, MD, pp. 79–91.
Beck, H.L., Anspaugh, L.R., 1991. Development of the County Data Base: Estimates of exposure rates
and times of arrival of fallout in the ORERP Phase-II area. Comparison with cumulative depositiondensity estimates based on analyses of retrospective and historical soil samples. US Department of
Energy Report DOE/NV-320.
Beck, H.L., Bennett, B.G., 2002. Historical overview of atmospheric nuclear weapons testing and estimates of fallout in the continental United States. Health Physics 82 (5), 591–608.
Beck, H.L., Krey, P.W., 1983. Radiation exposure in Utah from Nevada nuclear tests. Science 220,
18–24.
Beck, H.L., Helfer, I.K., Bouville, A., Dreicer, M., 1990. Estimates of fallout in the western U.S. from
Nevada weapons testing based on gummed-film monitoring data. Health Physics 59 (5), 565–570.
Bouville, A., Beck, H., 2000. The HASL gummed-film network and its use in the reconstruction of doses
resulting from nuclear weapons tests. Technology 7 (2–4), 255–362.
Bouville, A., Simon, S.L., Miller, C.L., Beck, H.L., Anspaugh, L.R., 2002. Estimates of doses from global fallout. Health Physics 82 (5), 690–705.
Carter, M.W., Moghissi, A.A., 1977. Three decades of nuclear testing. Health Physics 33, 55–71.
Church, B.W., Wheeler, D.L., Campbell, C.M., Nutley, R.V., Anspaugh, L.R., 1990. Overview of the
Department of Energy’s Off-Site Radiation Exposure Review Project (ORERP). Health Physics 59,
503–510.
Clark, I., 1979. Practical Geostatistics. Applied Science Publishers Ltd, London.
Collins, W.R., Hallden, N.A., 1958. A study of fallout in rainfall collectors from March through July
1956. US Atomic Energy Commission (USAEC) Report NYO-4889 in USAEC Report HASL-42.
New York, NY.
Cressie, N.A.C., 1993. Statistics for Spatial Data. John Wiley & Sons, New York.
DHHS, 2001. Draft report: a feasibility study of the health consequences to the American population
from nuclear weapons tests conducted by the United States and other nations. Volumes I and II.
Department of Health and Human Services, Centers for Disease Control and Prevention and the
National Cancer Institute. Washington, DC. Accessible at http://www.cdc.gov/nceh/radiation/
fallout/default.htm.
Hardy, E.P., Alexander, L.T., 1962. Rainfall and deposition of Sr-90 in Clallam County, WA. Science
136, 3519.
Hardy, E., Mayer, M.W., Allen, J.S., Alexander, L.T., 1968. Sr-90 on the Earth’s surface. Nature 219
(514), 584–587.
Harley, J.H., Hallden, N.A., Ong, L.D.Y., 1960. Summary of gummed film results through December,
1959. Health and Safety Laboratory Report, HASL-93. New York, NY.
Hicks, H.G., 1981. Results of calculations of external radiation exposure rates from fallout and the
related radionuclide composition. Lawrence Livermore National Laboratory, Livermore, CA,
(UCRL-53152, parts 1–8).
Hicks, H.G., 1982. Calculation of the concentration of any radionuclide deposited on the ground by offsite fallout from a nuclear detonation. Health Physics 42, 585–600.
Hicks, H.G., 1984. Results of calculations of external radiation exposure rates from fallout and the
related radionuclide composition of selected US Pacific events. Lawrence Livermore National Laboratory, Livermore, CA, (UCRL–53505).
Hicks, H.G., 1990. Additional calculations of radionuclide production following nuclear explosions and
Pu isotopic ratios for Nevada Test Site events. Health Physics 59 (5), 515–523.
Hoecker, W.H., Machta, L., 1990. Meteorological modeling of radioiodine transport and deposition
within the continental United States. Health Physics 59 (5), 603–617.
Isaaks, E.H., Srivastava, R.M., 1989. Applied Geostatistics. Oxford University Press, New York.
Krey, P.W., Beck, H.L., 1981. The distribution throughout Utah of 137Cs and 239þ240 Pu from Nevada
Test Site detonations. US Department of Energy Report EML-400.
Martell, E., 1959. Atmospheric aspects of Strontium-90 Fallout. Science 129, 1197–1206.
S.L. Simon et al. / J. Environ. Radioactivity 74 (2004) 91–105
105
NCI National Cancer Institute, 1997. Estimated exposures and thyroid doses received by the American
people from iodine-131 in fallout following Nevada atmospheric nuclear bomb tests. Department of
Health and Human Services, Washington, DC.
Simon, S.L., Bouville, A., 2002. Radiation doses to local populations near nuclear weapons test sites
worldwide. Health Physics 82 (5), 706–725.
Thompson, C.B., McArthur, R.D., Hutchinson, S.W., 1994. Development of the town data base: estimates of exposure rates and times of fallout arrival near the Nevada Test Site. National Technical
Information Service, Springfield, VA, (DOE/NVO-374).
UNSCEAR, 1993. United Nations Scientific Committee on the Effects of Atomic Radiation. 1993
Report to the General Assembly, with scientific annexes. UN publication E.94.IX.2. United Nations,
New York.
UNSCEAR, 2000. United Nations Scientific Committee on the Effects of Atomic Radiation. Sources
and Effects of Ionizing Radiation, Volume I: Sources. Report to the General Assembly with Scientific Annexes. United Nations, New York.
Free related PDFsRelated papers
Free PDF
Clinical guidelines -Diagnosis and treatment manual For curative programmes in hospitals and dispensaries Guidance for prescribing
Clinical guidelines - Diagnosis and treatment manual, 2022
Free PDF

Entre la tradición y el cambio: Nuevos roles, funciones e intereses de Académicos y Profesionales en la Gestión Universitaria de las universidades nacionales en Argentina
XI Jornadas de Sociología. Facultad de Ciencias Sociales, Universidad de Buenos Aires, Buenos Aires, 2015. , 2015
Free PDF


“You only have one mother!”: institutional violence in experiences of double motherhood in healthcare
Ciência & Saúde Coletiva, 2024
Free PDF
Physical Education Teacher in Middle Schools: Requirements and Academic Profile
International Journal of Instruction, 2024
Free PDF
A Countrywide Traffic Accident Dataset
arXiv (Cornell University), 2019
Free PDF

"Early Modern Money Shots." The Kinky Renaissance, ed. Gillian Knoll and Joseph Gamble (ACMRS Press, 2024). 189 - 212.
The Kinky Renaissance (ACMRS Press), 2024
Free PDF

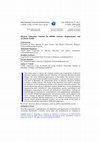
Engineering the Assembly of Gold Nanorods in Polymer Matrices
Macromolecules, 2016
Free PDF


現地調査と室内実験によるビーチロック形成メカニズムの検討
Journal of Japan Society of Civil Engineers, Ser. B3 (Ocean Engineering), 2016
Free PDF
- Find new research papers in:
- Physics
- Chemistry
- Biology
- Health Sciences
- Ecology
- Earth Sciences
- Cognitive Science
- Mathematics
- Computer Science