Atten Percept Psychophys
DOI 10.3758/s13414-014-0650-2
Contrasting accounts of direction and shape perception
in short-range motion: Counterchange compared with motion
energy detection
Joseph Norman & Howard Hock & Gregor Schöner
# Psychonomic Society, Inc. 2014
Abstract It has long been thought (e.g., Cavanagh & Mather,
1989) that first-order motion-energy extraction via space-time
comparator-type models (e.g., the elaborated Reichardt detector) is sufficient to account for human performance in the
short-range motion paradigm (Braddick, 1974), including
the perception of reverse-phi motion when the luminance
polarity of the visual elements is inverted during successive
frames. Human observers’ ability to discriminate motion direction and use coherent motion information to segregate a
region of a random cinematogram and determine its shape was
tested; they performed better in the same-, as compared with
the inverted-, polarity condition. Computational analyses of
short-range motion perception based on the elaborated
Reichardt motion energy detector (van Santen & Sperling,
1985) predict, incorrectly, that symmetrical results will be
obtained for the same- and inverted-polarity conditions. In
contrast, the counterchange detector (Hock, Schöner, &
Gilroy, 2009) predicts an asymmetry quite similar to that of
human observers in both motion direction and shape discrimination. The further advantage of counterchange, as compared
with motion energy, detection for the perception of spatial
shape- and depth-from-motion is discussed.
Keywords Short-range motion . Motion energy detection .
Counterchange . Reverse-phi
J. Norman (*) : H. Hock
Center for Complex Systems and Brain Sciences, Florida Atlantic
University, Boca Raton, FL, USA
e-mail: joe.w.norman@gmail.com
H. Hock
Department of Psychology, Florida Atlantic University, Boca Raton,
FL, USA
G. Schöner
Institut für Neuroinformatik, Ruhr-Universität Bochum, Bochum,
Germany
Introduction
In an ecological context, many organisms benefit from minimizing their visual profile via camouflage in order to remain
undetected (Stevens & Merilaita, 2009). As a coevolutionary
complement, organisms have been selected with visual systems that are, at least in some cases, able to overcome the
challenges in detecting and segregating entities whose static
visual cues are obscured by camouflage. One basis for the
perceptual “breaking” of camouflage entails the detection of
coherent motion, which provides the opportunity to group
portions of the visual field into connected wholes (as in the
Gestalt principle of common fate) and to thereby segregate a
moving entity from its background in order to determine its
shape1 from its motion. The short-range motion paradigm
(Braddick, 1974), in which portions of a random field of
elements are coherently displaced, provides a means for
studying this ability to detect and segregate entities from their
surrounding environment by virtue of their motion alone.
In the original two-frame short-range motion paradigm
(Fig. 1), each square element of a random checkerboard has
a .5 chance of being white (or black). A segment of the
random checkerboard that is presented during the first frame
is rigidly displaced and re-presented during the second frame
(the coherent figure), while the surrounding elements are
independently regenerated (the incoherent ground). Because
the figure and background portions are generated in the same
manner, the displaced figure is not detectable within individual frames on the basis of static cues; the perception of
coherent motion is necessary in order to segregate the figure
from the random, incoherently moving background elements and, thereby, determine its shape. As the size of
1
By shape, we mean the ability to discriminate the orientation of the
displaced figure. Although this does not put an explicit emphasis on the
boundaries of the figure, they can be perceived at small displacements.
�Atten Percept Psychophys
(a)
Frame 1
Background (incoherent)
Figure
(coherent)
Frame 2
displacement
Figure
(coherent)
Background (incoherent)
(b)
Frame 1
Background
Figure
Background
Frame 2
Fig. 1 Sketch of the two-frame short-range motion stimulus. The figure
region is coherently displaced (either left or right) from frame 1 to frame
2, while the incoherent dynamic background is updated randomly. a
Layout of the two-dimensional experimental stimulus. b A one-dimensional slice of the random dot cinematogram (with fewer dots than in the
experiment). The stimulus used for the simulations below is also of the
one-dimensional form depicted in panel b
the frame-to-frame displacement of the figure is increased,
perceptual judgments become less consistent, with participants reporting a loss in coherence of the moving figure
(Braddick, 1974; Sato 1989).2 In this article, psychophysical
experiments and computational simulations investigate the
motion mechanisms that are the basis, in the two-frame
short-range motion paradigm, for the perception of motion,
the conditions under which it is coherent enough to segregate
a moving figure from its background, and the perception of
the figure’s shape from the coherent motion.
Short-range motion perception has been considered a paradigmatic case for motion energy detection3 (Adelson &
Bergen, 1985; Cavanagh & Mather, 1989; Marr & Ullman,
2
The focus of this article is on the differential effects of figure displacement for same- versus inverted-polarity conditions. Dmax, a measure of
the maximum displacement for which motion is perceived, is not
determined.
3
Rather than focusing on the features of the space-time Fourier transform
of the stimulus per se, our emphasis is on mechanisms proposed to detect
Fourier-based motion energy—specifically, the elaborated Reichardt
detector.
1981; van Santen & Sperling, 1985). A major feature of
models of Fourier-based motion energy detection (Adelson
& Bergen, 1985; van Santen & Sperling, 1985) is that they
predict reverse-phi motion (Anstis, 1970). As is shown in
Appendix 2, motion is predicted in the direction opposite
to that of the displacement when the luminance polarity
of the visual elements composing a stimulus is inverted
between successive frames (i.e., white elements become
black and black elements become white). The strength
of this reverse-phi motion is identical to the strength of
motion in the direction of displacement when luminance
polarity remains the same. Consequently, empirical evidence for asymmetry in motion and shape perception
between the same- and inverted-polarity stimuli would
indicate that motion perception was not determined
solely by motion energy detection.
Experimental results relevant to this determination have
been reported by Sato (1989), who tested both direction of
motion and shape discrimination with both same- and
inverted-polarity versions of the short-range motion stimulus.
Although he reported that direction discrimination was similar
for the same- and inverted polarity stimuli, this symmetry was
not consistently obtained in all his experiments. Whenever
performance was below ceiling, direction discrimination was
poorer for inverted-polarity stimuli. Moreover, shape discrimination was severely deteriorated for the inverted-polarity
stimuli, regardless of the size of the displacement. If these
asymmetries were empirically confirmed, it would provide
evidence that motion perception and the perception of shape
from motion in the short-range paradigm are not primarily
determined by first-order motion energy detectors. Instead, or
in addition, an alternative motion detection mechanism that is
sensitive to the difference between same- and invertedpolarity stimuli would be implicated. The alternative mechanism that is evaluated here entails the detection of counterchange—that is, oppositely signed changes in activation for
pairs of spatial filters at different spatial locations (Hock,
Gilroy, & Harnett, 2002; Hock, Schöner, & Gilroy, 2009).
Because the symmetry, or lack thereof, of motion and
shape perception in same- and inverted-polarity conditions is
theoretically critical, the present study begins with a psychophysical experiment that reevaluates and extends Sato’s
(1989) results. Computational simulations then determine
how well the results obtained in the experiment are accounted
for by Fourier-based first-order motion energy detection (van
Santen & Sperling’s [1985] elaborated Reichardt detector,
which is based on Reichardt’s [1961] motion detection
model), as compared with the non-Fourier detection of
counterchange (Hock et al., 2009). For both models,
investigating shape judgments in addition to motion
direction judgments requires addressing the spatial arrangement of motion detectors, in addition to their internal structure.
�Atten Percept Psychophys
Experiment
The results of Sato’s (1989) third experiment came closest to
providing evidence for symmetry in direction discrimination
for standard (same-polarity) and reverse-phi (invertedpolarity) motion. The possibility that this was due to ceiling
effects for highly practiced observers was suggested by the
lack of symmetry in his first two experiments, which used the
same, although presumably less practiced, observers. In addition, in Sato’s second experiment, the advantage in direction
discrimination for standard motion, as compared with reversephi motion, became more pronounced when reducing the size
of the elements lowered discrimination performance from
ceiling.
The experiment closely resembles Sato’s (1989) third experiment, in which participants indicated both the direction of
motion and the shape of the displaced figure. In order to
reduce the possibility of ceiling effects, testing was done
primarily with naive participants who received minimal practice at the task and no feedback regarding the accuracy of their
discriminations.
Method
Stimuli
The dynamic random checkerboard stimuli, which were generated with a Mac Mini computer, were centered in a
Mitsubishi Diamond Pro 930SG monitor and viewed in a
dimly lit room from a distance of 58 cm (maintained by a
chinrest). As in Sato (1989), the stimuli were composed of two
frames, each with a random checkerboard composed of 120 ×
120 square elements that was presented against a black background. Each square element composing the checkerboards
subtended a visual angle of 2 × 2 min (one pixel per check),
and the entire checkerboard subtended a visual angle of 4° ×
4°. The luminance of the white elements was 76.6 cd/m2, and
that of the black elements was 0.0 cd/m2.
The first frame of each two-frame trial was generated by
independently assigning each square element of the checkerboard to be either white or black, with a .5 chance of each.
During the second frame, a region (the figure) was selected
from the center of the first frame and displaced by 2, 4, 6, 8,
10, 12, 14, or 16 element-units (4–32 min) to the right or left.
The rest of the checkerboard (the background) was randomly
regenerated, again with a .5 probability of each element being
white or black. The figure was either a vertically oriented
rectangle (60 × 30 element-units; 120 × 60 min) or a horizontally oriented rectangle (30 × 60 element-units; 60 × 120 min).
In the same-polarity condition, the luminance of the square
elements composing the displaced figure was the same during
both frames. In the inverted-polarity condition, the luminance
of the square elements composing the displaced figure was
inverted during the second frame; white elements became
black and vice versa.
Procedure
To familiarize participants with the task, a version of the
random checkerboard stimulus was shown in which all but
the leftmost and rightmost two columns of elements from the
entire 120 × 120 field of elements constituted the figure,
which was displaced rightward or leftward by two elementwidths (i.e., there was not an incoherent background from
which coherent motion had to be segregated). In order to
maintain the size of the field for the second frame, the two
columns at the leading edge of the figure were removed rather
than displaced, and the trailing two columns were randomly
regenerated. This was done for both same- and invertedpolarity versions. Participants viewed these demos without
feedback for approximately 5 min, until they indicated that
they were able to perceive both leftward and rightward motions. Shape discrimination was then explained by means of
drawings of the tall-thin and short-wide rectangles, and a
demo stimulus composed of ten 138-ms frames, with twoelement displacements during each frame (without polarity
change). The figure shapes were easily discernible for this
demo. A similar shape demo was not provided for the
inverted-polarity condition, since it did not make the shapes
discriminable and so did not aid in describing the task.
Participants other than the first author received no practice
with what would become the test stimuli.
As in Sato (1989), each test trial began with the participant
fixating in the center of a 8 × 8 min square arrangement of four
2 × 2 min white dots, which was presented for 0.5 s against a
black background. This was followed by a blank black screen
for 0.5 s; then the two stimulus frames were presented for
138 ms each, and finally, another blank black screen was
presented. After each trial, the participant made 2 twoalternative forced choice responses by pressing keys on the
computer keyboard to indicate (1) the direction in which the
figure was displaced (either right or left) and (2) the shape of
the displaced figure (either a vertically or a horizontally oriented rectangle). There was no feedback.
Design
Blocks of 128 test trials were generated by the orthogonal
combination of two displacement directions, eight displacement distances, two figure orientations, and four repetitions.
Order was randomized within subblocks of 32 trials. The
same- and inverted-polarity stimuli were tested in alternating
blocks of trials. Each participant was tested for 7 blocks of
trials for each polarity condition for a total of 14 blocks of
trials.
�Atten Percept Psychophys
Results
The results for each of the 4 participants are presented in
Fig. 2. Direction discrimination is graphed with respect to
the actual figure displacement, regardless of the polarity condition. Thus, reverse-phi perception is indicated by responses
that are systematically in the opposite direction of the displacement and, therefore, below chance level (i.e., below .5).
As in Sato (1989), both direction and shape discrimination
decreased with increasing displacement of the rectangular
figure, with shape discrimination falling to chance at smaller
displacements, as compared with direction discrimination.
Most important, the results for each of the 4 participants
indicated a clear asymmetry in both direction and shape
discrimination between the same- and inverted-polarity conditions; both were superior in the same-polarity condition.
A two-way repeated measures ANOVA performed on the
arcsine transformed proportion data indicated that the
effects on direction discrimination of displacement size,
F(7, 21) = 55.74, p < .001, luminance polarity (same or
inverted), F(1, 3) = 29.25, p < .05, and the interaction between
polarity and displacement size, F(7, 21) = 14.37, p < .01; all
were statistically significant. (In the inverted-polarity condition,
responses in the reverse-phi direction were treated as correct, so
the complements of the proportion of correct responses were
used in the ANOVA.) For shape discrimination, the effect of
displacement size, F(7, 21) = 11.93, p < .001, and the interaction of polarity with displacement size, F(7, 21) = 5.85, p < .01,
were statistically significant. For each participant, shape
discrimination was better in the same- than in the
inverted-polarity condition for the small displacements,
but because of floor effects and the small sample size,
the effect of polarity fell short of statistical significance,
F(1, 3) = 7.77, p = .069.
Because there was a consistent trend of shape discrimination being better in the same-polarity condition
for all participants, especially evident at the smallest
displacement of two elements, a log-likelihood ratio test
was performed for each participant, as well as their
pooled scores, to evaluate the null hypothesis that the
probability correct was identical in the two contrast
conditions. That is, let pS (pD) be the proportion correct
in the same-polarity (inverted-polarity) condition and p
be the pooled proportion correct across both conditions;
then the null hypothesis is pS = pD = p. If kS (kD) is the
number of correct responses in the same- (inverted-)
vs
Same-polarity
Inverted-polarity
0.9
Proportion Correct Direction Judgments
In addition to the first author, 3 students from Florida Atlantic
University voluntarily participated in this experiment. They
were naive with respect to its purpose. All participants had
normal or corrected-to-normal vision.
Individual Means for Motion Direction Discrimination
(a)
0.7
0.5
0.3
0.1
AD
NM
0.9
0.7
0.5
0.3
0.1
(mins) 4
JN
IM
8 12 16 20 24 28 32
4
8 12 16 20 24 28 32
Size of Displacement
(b)
Individual Means for Figure Shape Discrimination
vs
0.9
Proportion Correct Shape Judgments
Participants
Same-polarity
Inverted-polarity
0.7
0.5
0.3
0.1
IM
NM
JN
AD
0.9
0.7
0.5
0.3
0.1
(mins) 4 8 12 16 20 24 28 32
4 8 12 16 20 24 28 32
Size of Displacement
Fig. 2 Mean experimental results for individuals for a direction judgments (left or right) and b shape judgments (wide or tall rectangle).
Proportion of correct responses are plotted as a function of figure displacement in dot-units. Solid lines indicate the same-polarity condition,
and dashed lines indicate the inverted-polarity condition. Data points in
panel a that are below chance (.5) indicate a systematic bias to see motion
in the direction opposite to displacement (reverse-phi)
contrast condition and nS (nD) is the number of incorrect responses in the same- (inverted-) polarity condition, then the likelihood for the unconstrained model
can be expressed as
LogLU ¼ k S logðpS Þ þ nS logð1−pS Þ þ k D logðpD Þ þ nD logð1−pD Þ;
and the constrained model as
LogLC ¼ ðk S þ k D ÞlogðpÞ þ ðnS þ nD Þlogð1−pÞ:
�Atten Percept Psychophys
Then, under the null hypothesis pS = pD = p, the test
statistic
X ¼ 2ðLogLU −LogLC Þ
is asymptotically distributed as chi-square with df = 1 (degrees
of freedom determined by the number of free parameters in the
constrained models subtracted from the number of free parameters in the unconstrained model). For each individual and
for the pooled scores, the constrained (null) model was
rejected in favor of the unconstrained model with p < .001
(with the greatest individual p-value = 4.4728 × 10⁻⁶; individual chi-square values = 56.69, 57.28, 71.86, 21.05; pooled
chi-square value = 123.39). These results suggest that the
probability of a correct response in the same-polarity condition was significantly different from the probability of a correct response in the inverted-polarity condition at the displacement of two elements, for each participant individually and for
their pooled responses.
If the effects on direction and shape discrimination were
symmetrical, there would have been neither differences between the same- and inverted-polarity conditions nor significant interactions with the size of the figure displacement.
Furthermore, the likelihood ratio test would have indicated
no difference between the probability of a correct shape response in the same- and inverted-polarity conditions. The
results indicate that this was not the case.
Computational simulations
Computational implementations of van Santen and Sperling’s
(1985) elaborated Reichardt detector (ERD) and Hock et al.’s
(2009) counterchange detector, which are detailed in
Appendix 1, were compared with respect to their ability to
simulate the results of the experiment described above. For the
purpose of these simulations, the two-dimensional random
checkerboard stimuli were reduced to one-dimensional vertical bars whose luminance, white or black, was randomly
determined, as was done by van Santen and Sperling (1985),
Adelson and Bergen (1985), and Sato (1989). Consistent with
the stimuli in the experiment described above, a portion of the
random-bar stimulus was rigidly translated from the first
frame to the second (the figure), while the rest of the stimulus
(the background) was randomly generated in both the first and
second frames. The stimulus was 240 bars long in the simulations. There were two figure lengths, analogous to the two
figure shapes in Experiment 1: A figure that was 60 bars long
represented the thin-tall rectangle, and a figure that was 120
bars long represented the wide-short rectangle. In the invertedpolarity condition, bars within the figure that were white
during the first frame were black during the second frame,
and vice versa. The figure was displaced by 2, 4, 6, 8, 10, 12,
14, or 16 bar-widths, the same displacements that were probed
in the experiment. The random bars provided the input stimulus to the motion detector ensembles.
Coincidence detection and directional selectivity
Both models use the multiplication of activity patterns in pairs
of spatially separated, one-dimensionalized edge filters (an
excitatory zone and an adjacent inhibitory zone) to establish
a correspondence between them.4 However, the nature of the
patterns whose coincidence is detected is different in the two
models.
The ERD is sensitive to sequential changes in edge
filter activation; that is, instantaneous edge filter outputs
are compared at different points in time. This is
achieved by delaying the output of one edge filter in
order to temporally align activation that occurs at its
location at one moment in time with the pattern of
activation at a paired location at a later moment in time
so that the patterns can be compared. At the level of the
subunits where multiplication occurs (before the difference between the two subunits is taken), positive products signal motion from the location of the edge filter
whose activity has been delayed to the location of the
edge filter whose activation has not been delayed, while
negative products signal motion in the direction from
the location of the nondelayed edge filter to the delayed
one.5
Although temporal coincidence is also central to the counterchange motion detector, a temporal delay is not required in
order for it to be directionally selective. This is because the
counterchange detector is sensitive to a particular pattern of
simultaneous changes in edge filter activation: a decrease in
the activation of one edge filter and a simultaneous increase in
the activation of a paired edge filter. Rather than deriving a
directional asymmetry from sequentiality, as in the ERD, an
asymmetry in the direction of activational change in local
spatial filters is established, with motion beginning from a
location of a decrease in spatial filter activation and ending at a
location of an increase in spatial filter activation. This is
irrespective of the sequential order of the stimulus events
producing the decreases and increases in activation (Gilroy
& Hock, 2009; Hock et al., 2009).
4
The scale of the edge filters for the ERD was determined by the
quadrature constraint of the model. The edge filters for the counterchange
model were selected to be most responsive to the size of the checks in the
checkerboard stimulus.
5
Typically, Reichardt-type detectors are described as detecting motion in
the direction from the delayed input toward the nondelayed input. This,
however, is not strictly true in the ERD formulation, since each subunit
may carry information about two (opposite) motion directions (Adelson
& Bergen, 1985; Lu & Sperling, 2001).
�Atten Percept Psychophys
Edge filter polarity
In the ERD model, the multiplication of instantaneous outputs
of the paired edge filters occurs irrespective of whether they
are positive (excited) or negative (inhibited). On this basis, it is
sufficient to have only one edge filter polarity for the ERD
model (e.g., excitatory zone on the left, inhibitory zone to its
right), since the entire range of positive and negative edge
filter outputs take part in motion computation. In other words,
both edge types are represented, one by positive values and
the other by negative values. For example, if more white
elements fall in the positive lobe than in the negative lobe of
an edge filter during frame 1 (positive response) and more
white elements also fall in the positive lobe of a paired edge
filter during frame 2 (another positive response), the product
of the two positive responses is positive. Furthermore, if more
white elements fall in the negative lobe than in the positive
lobe of the same edge detector during frame 1 (negative
response) and more white elements fall in the negative lobe
of the edge filter with which it is paired during frame 2
(another negative response), the product of the negative responses is also positive for the ERD. Thus, nothing would be
added to the computations by including edge filters with reversed positive/negative polarity. It also is noteworthy that if a
negative edge filter response in frame 1 is multiplied with a
positive response in frame 2 (or vice versa), a negative response
is elicited, indicating motion in the opposite direction than that
of a positive response. Importantly, this is the basis for the ERD
model signifying motion in the reverse-phi direction (although
negative-valued products are also produced with non-invertedpolarity stimuli). These edge filter products occur at the level of
the ERD subunits, from which the difference is taken to determine the final motion detector output.
In contrast, in the counterchange model, the activation
values of edge filters are half-wave rectified, so only positive
outputs are subject to the subsequent change detection that
leads to motion detection. This is in line with the principle of
counterchange motion pairing “like” edges, detecting their
disappearance at one location and appearance at another location (this is discussed in more detail in the General Discussion
section). For this reason, the model includes two edge filter
polarities. The filter with its excitatory zone on its left side
captures inputs in which there are more white elements falling
on the filter’s left side, whereas the filter with the excitatory
zone on the right captures inputs in which there are more white
elements falling on the filter’s right side. The two edge filter
polarities compute motion in parallel.
Opponency
The ERD is an opponent system; it takes a difference between
its two component subunits for its final output. Each subunit
can carry information about both leftward and rightward
motion, because they each can have negative or positive
values. Taking the difference between the subunits gives the
final motion output. Net positive outputs signal motion in one
direction (i.e., rightward) and net negative outputs in the
opposite direction (i.e., leftward). Furthermore, opponency is
necessary to prevent the ERD from signaling motion in response to stationary patterns. For purposes of comparing the
two models, the counterchange model was arranged in a
similar opponent fashion, with leftward motion signals being
subtracted from rightward signals. This is not a necessity for
the counterchange model because, unlike the ERD, leftward
and rightward motion signals are separable and motion cannot
be signaled for stationary stimuli. Therefore, by convention,
rightward motion is represented in both models by positive
values and leftward motion by negative values at each location
along the detector arrays.
Spatial arrangement of motion detector arrays
For both ERD and counterchange motion detectors, the distance between the centers of the pair of edge filters that
provide input to each motion detector is referred to as that
detector’s span. (This is illustrated in Fig. 3, which shows the
general layout of both the ERD and counterchange detectors.)
Both models included arrays of detectors with spans of two,
four, six, and eight bar-widths. Within each array, the detectors
densely covered the entire stimulus. Edge filters that served as
Input
Span
Scale (width)
of Edge Filters
Motion
Detection
Output
Fig. 3 General layout of both motion detectors. A pair of edge filters
separated in space serve as inputs to subsequent motion detection; the
distance between the centers of their respective fields is referred to as the
detector’s span. For the ERD, the size of the span and the scale (width) of
the edge filter covary in order to maintain an approximate quadrature
relationship (i.e., so there is approximately a 90° phase shift with respect
to their preferred spatial frequency). The counterchange detector has no
such constraint, and in the present model, the scale of the edge filters is
held constant over a range of spans. For both models, detectors are
arranged in layers, and each layter corresponds to a specific span
�Atten Percept Psychophys
input to the motion detectors were located every one fourth of
a bar-width across both the displaced figure and its background. Following van Santen and Sperling’s (1985), there
were multiple layers of motion detectors, each layer corresponding to a particular span. In the present simulations, this
meant that there were four layers.
Direction discrimination
In order to simulate the direction discrimination task, for each
trial, all motion signals were summed across space and across
layers, and the sign of the sum indicated the motion direction
decision (since rightward motions were positive and leftward
motions were negative). Within each layer, responses were
summed across all motion detectors covering the 240 random
bars constituting the entire stimulus (not just the 60 or 120
random bars corresponding to the displaced figure). Summing
activation over the entire field of random bars was significant
because it meant that motion direction was being discriminated
by the models without predetermination of the shape of the
figure. That is, figure segregation was not considered a prerequisite for direction detection. This is consistent with the shape
of the figure being derived from the motion rather than vice
versa. Motion detector responses were also summed across all
layers (spans). That is, all spans contributed equally to the
determination of motion direction. This implies that direction
discrimination does not depend on motion signals being concentrated at a particular span or in a particular image location.
For each trial, therefore, a positive sum (the positive component is greater than the negative component) signifies rightward motion perception, whereas a negative sum signifies
leftward motion perception. In this way, both models make
the same kind of forced choice responses as the participants in
the actual experiments. The proportion of trials that motion
perception was signified in the direction of the displacement
was determined for 224 repetitions (matching the aggregated
number of experimental trials for the 4 participants in the
experiment). Proportions in the direction of the displacement
that were less than .5 indicated that a majority of the simulated
responses were in the so-called reverse-phi direction.
Shape discrimination
The ability of participants in the experiment to discriminate
the shape of the displaced figure indicates that the detected
motion could be used to segregate the figure from its background and determine its shape. This was simulated for both
the ERD and counterchange models with templates that
corresponded to the width of the two figures. The two templates functioned as filters whose inputs were the spatial
distribution of motion signals along the stimulus array.
The simulations for the experiment were based on two
principles of coherent motion supporting the perception of
shape-from-motion. Accordingly, coherent motion arises from
regions of activated motion detectors that (1) are in the same
direction and (2) are of the same span. A high density of such
signals within a template’s positive area, as compared with its
negatively weighted flanking regions, would result in a positive template output. The same-span constraint on motion
coherence was consistent with the two-dimensional percepts
elicited by the rigidly translating figures in the experiment.
(The possibility of relaxing this constraint to account for
recovery of depth information is addressed in the General
Discussion section.) One template was composed of a positive
interior region matching the relatively short one-dimensional
size of one figure (60 bar-widths), and another template was
composed of a positive interior region matching the relatively
long one-dimensional size of the other figure (120 barwidths). All the detected motions within the figure region
were summed with equal positive weight. Negative regions
flanking the positive interior regions extended to the boundaries of the random-bar stimulus, which was 240 bar-widths in
length. All detected motions within the flanking regions were
summed with equal negative weight. The templates were
normalized such that their positive interior region integrated
to 1 and their negative exterior regions integrated to −1. For
each trial, the output of each template was determined for each
direction (leftward and rightward) and for each of the four
spans. The figure size (either long or short) with the greatest
template response was taken as the shape decision for a trial.
(As in the experiment, shape discrimination required forced
choice decisions by the models.)
Simulations based on the elaborated Reichardt detector
A diagram of the ERD can be seen in Fig. 4a. As in van Santen
and Sperling’s (1985) ERD model, the edge filters in its
present implementation model are band-pass. Space-time filters in the Fourier domain are approximated by establishing a
quadrature relationship between pairs of filters constituting a
motion detector. Thus, pairs of edge filters, implemented as
one-dimensional real-valued Gabor filters, are modulated by
sine waves that are 90° out of phase with one another. Larger
spatial filters are therefore required to approximate the quadrature relationship among motion detectors whose component
receptive-field centers are further apart (i.e., have larger
spans).
Results
Single-trial simulations
As was indicated above, rightward motion was signified by
positive values and leftward motion by negative values. In the
�Atten Percept Psychophys
(a)
Elaborated Reichardt
Detector
(b) Counterchange Detector
Edge Filters
Edge Filters
Half-wave Rectification
Temporal Delay
d/dt
Half-Opponent Energy
-d/dt
-d/dt
x
Change Detectors
Half-wave Rectification
x
Opponent Motion
d/dt
x
-
+
x
-
+
Leftward and Rightward
Motion Signals
Opponent Motion
Fig. 4 Block diagrams of the a elaborated Reichardt detector and b counterchange detector. Only one polarity channel of the counterchange detector is
shown here; the other one operates in parallel
single trials presented in Fig. 5, the displacement of the figure
is to the right.
When the figure’s displacement is small (e.g., 2 bar-units
rightward; Fig. 5a), much of the activity is concentrated within
the figure at the span that corresponds to the actual displacement, with most motion signals in the correct direction
(rightward). In the background regions, there is also a fair
amount of activity, although weaker on average and
directionally incoherent, as would be expected for responses
that are driven by noise. At larger spans, directional responses
are generally consistent with the actual displacement direction
within the figure region, but are spread across several spans
for all displacement sizes, with the average strength of the
response decreasing with greater spans. This weakening of the
response is a consequence of the larger spatial filters required
by larger-span detectors due to the ERD’s quadrature
constraint.
When the figure’s displacement is larger (e.g., 6 bar-units;
Fig. 5b), the span corresponding to the displacement shows a
directionally consistent but relatively weak response within
the figure region. The responses of nearby spans also are
directionally consistent within the figure, and with similar
strength. Therefore, the directional motion information for
the figure region is again spread across several spans for all
displacement sizes. Furthermore, small-span detectors that are
driven almost entirely by noise respond strongly, due to their
filters responding more strongly to the spatial structure of the
stimulus.
Regardless of the size of the displacement, symmetrically
opposite results were indicated for the inverted-polarity conditions when the second frame was the exact inverse of the
second frame in the same-polarity condition. Motion was most
often signaled in the leftward, reverse-phi direction within the
figure, with the same strength and spatial distribution across
all locations and spans, within both the figure and the background, as in the same-polarity condition (Fig. 5a, dashed
curve).
Simulation of experimental results
ERD-determined simulations of direction and shape discrimination in the short-range motion paradigm are presented in
Fig. 6a, b, along with the averaged results for the 4 participants
in the experiment. It can be seen that the ERD successfully
simulated the effect of displacement size; direction and shape
discrimination were poorer for the larger displacements.
The ERD also simulates the perception of reverse-phi
motion in the inverted-polarity condition but incorrectly predicts that it is quantitatively equal to motion in the direction of
the displacement in the same-polarity condition; in the experiment, both direction discrimination and shape discrimination
were significantly poorer for motion in the reverse-phi direction. It could be concluded, because of its inherent symmetry
with respect to the same- and inverted-polarity stimuli, that the
detection of first-order motion energy by the ERD is not
sufficient in order to account for short-range motion
perception.
Second-order motion energy
Also considered was the possibility that the perception of
motion and shape entails second-order motion energy extraction (Lu & Sperling, 2001). Full-wave rectification of the edge
filters’ activation in the second-order system would make all
negative activation values positive, so inverting luminance
polarity would result in the output of the edge filters being
the same as in the same-polarity condition. The simulation of
second-order motion energy therefore would result in motion
�Atten Percept Psychophys
(a)
Single Trial ERD Output for a Displacement of 2 Bars
(c) Single Trial
1
0
Span 2
0
-1
Motion Detector Activation
Motion Detector Activation
Counterchange Output for a Displacement of 2 Bars
1
1
Span 4
0
-1
1
Span 6
0
-1
1
Span 8
0
Background
Figure Region
-1
Span 2
-1
1
Span 4
0
-1
1
Span 6
0
-1
1
Span 8
0
Background
Background
-1
Space
(b) 1 Single Trial
ERD Output for a Displacement of 6 Bars
Single Trial Counterchange Output for a Displacement of 6 Bars
1
0
-1
1
Span 4
0
-1
1
Span 6
0
-1
1
Span 8
0
Figure Region
Background
Motion Detector Activation
Motion Detector Activation
(d)
Span 2
Background
Background
Space
0
-1
Figure Region
1
Span 4
0
-1
1
Span 6
0
-1
1
Span 8
0
-1
Space
Span 2
-1
Background
Figure Region
Background
Space
Fig. 5 Singlel-trial simulation outputs of the ERD (a, b) and counterchange detector (c, d). Panels a and d show a rightward displacement of
6 bar-units. Solid curves represent the local motion detector output across
space for each of four layers of motion detectors with various spans.
Activations above 0 signal rightward motion, and activations below 0
signal leftward motion. The figure occupies the region between the
dashed vertical lines, and the flanking background regions fall outside
of it. The dashed curve in the first detection layerin panels a and c depict
the response to the inverted-polarity version of the same stimulus. Note
the ERD’s symmetry around 0 with respect to the same-polarity stimulus
(reverse-phi). Although not depicted, the same symmetry is obtained for
all the span-layers of the ERD. Also noteworthy is the indication that
ERD activation is spread across span-layers, rather than being concentrated at the span corresponding to the displacement, particularly for
larger displacements. In contrast, the inverted-polarity condition does
not elicit a symmetric response from the counterchange detector. This is
true at all span-layers, despite the dashed curve only being shown for the
smallest span-layer in panel c
perception being signified in the direction of the displacement,
regardless of whether or not the luminance polarity of the
elements is inverted during the second frame of the twoframe trials. Reverse-phi motion percepts would not be
predicted.
to testing short-range motion perception with high-contrast
(black and white) elements. An experiment was therefore
conducted in order to determine whether the ERD’s prediction
of symmetry with respect to the effect of same- versus
inverted-polarity would be obtained at very low (barely visible) contrast levels. The results, which are presented in
Fig. 7a, are very similar to those obtained in the primary
experiment. That is, both better direction and shape discrimination were obtained for the same-polarity than for the
inverted-polarity stimuli. A likelihood ratio test of the same
form used to analyze the results of shape discrimination in the
primary experiment was here used to test the significance of
the difference in both direction and shape perception at the
smallest displacement of 2 dot-units. For the direction discrimination task, the chi-square value was 90.18, p < .001; for
The effect of contrast
Van Santen and Sperling (1984, 1985) have reported that their
experimental support for the ERD as the basis for motion
perception was obtained only for low-contrast gratings. They
argued that the perceptual invariance of suprathreshold motion
is evidence of motion detectors’ early saturation. It might be
argued, therefore, that our empirical evidence, which was
contrary to the predictions of the ERD, might have been due
�Atten Percept Psychophys
Proportion Correct Judgments
(a)
Direction Discrimination
Empirical Means
ERD Simulation
Counterchange Simulation
0.9
0.7
0.5
0.3
Same-polarity
Inverted-polarity
0.1
(dot-units) 2
(mins) 4
4 6 8 10 12 14 16
8 12 16 20 24 28 32
(b)
Proportion Correct Judgments
vs
2
4
6
8 10 12 14 16
2
4
6
8 10 12 14 16
Size of Displacement
Shape Discrimination
Empirical Means
vs
Counterchange Simulation
ERD Simulation
0.9
0.7
0.5
0.3
Same-polarity
Inverted-polarity
0.1
(dot-units) 2
(mins) 4
4 6 8 10 12 14 16
8 12 16 20 24 28 32
2
4
6
8 10 12 14 16
2
4
6
8 10 12 14 16
Size of Displacement
Fig. 6 Results from the experimental simulations alongside the empirical
means for a the direction discrimination task (left or right) and b the shape
discrimination task (wide or tall rectangle). Solid curves represent mean
scores from the same-polarity conditions; dashed curves represent mean
scores from the inverted-polarity condition. Because of symmetry in its
response to the same- and inverted polarity stimuli, the ERD
overestimates performance in the inverted-polarity condition for both
direction judgments (corresponding to reverse-phi percepts) and shape
judgments. The counterchange detector is very similar to the empirical
data both qualitatively and quantitatively. The empirical symmetry between same- and inverted-polarity percepts as evidenced in both direction
and shape judgments is clearly evident in the counterchange simulation
the shape discrimination task, the chi-square value was
319.81, p < .001. Symmetry with respect to luminance polarity was not obtained for low-contrast short-range motion
stimuli, which might have been expected on the basis of van
Santen and Sperling’s (1984, 1985) evidence that the ERD
functions properly only for low-contrast motion stimuli.
run. For the direction discrimination task, the chi-square value
was 69.29, p < .001; for the shape discrimination task, the chisquare value was 483.28, p < .001. Again, asymmetry with
respect to polarity inversion was found for both direction and
shape discriminations (Fig. 7b).
The effect of frame rate
Simulations based on the counterchange motion detector
Another possibility is that the ERD functions properly only for
fast frame rates that more closely approximate continuous
motion, so the lack of symmetry found in the main experiment
may have been due to the relatively slow frame rate of the
stimulus (138 ms/frame). A variant of the experiment was run
with much faster frame rates (35 ms/frame). The same likelihood ratio test as in the low-contrast variant above was again
A diagram of the counterchange detector can be seen in Fig. 4b.
The counterchange motion detector is sensitive to simultaneous
and oppositely-signed changes in activation for pairs of spatial
filters at separate locations (Hock et al., 2009), motion being
signaled from the location of the decrease to the location of the
increase in activation. Decrease subunits respond with excitation
to decreases in their activational input, and increase subunits
�Atten Percept Psychophys
Low-Contrast Variant
Proportion Correct
(a)
vs
vs
Same-polarity
Inverted-polarity
0.9
0.7
0.5
0.3
0.1
JN
JN
2 4 6 8 10 12 14 16
(dot-units) 2 4 6 8 10 12 14 16
(mins) 4 8 12 16 20 24 28 32
4 8 12 16 20 24 28 32
Size of Displacement
(b)
Fast Frame-Rate Variant
vs
Proportion Correct
vs
0.9
Same-polarity
Inverted-polarity
0.7
0.5
0.3
0.1
JN
JN
2 4 6 8 10 12 14 16
(dot-units) 2 4 6 8 10 12 14 16
4 8 12 16 20 24 28 32
(mins) 4 8 12 16 20 24 28 32
Size of Displacement
Fig. 7 Two varians of the experiment in order to test the effects of a lowcontrast and b fast frame rates (35 ms) on the empirical asymmetry. Both
conditions show the same asymmetry as the main experiment in both
direction and shape judgments
respond with excitation to increases in their activational input.
Counterchange-determined motion is indicated when the product
of the “decrease” and “increase” excitation is greater than zero.
Although the perception of short-range motion has typically
been attributed to the detection of motion energy (e.g., Adelson
& Bergen, 1985; Cavanagh & Mather, 1989; van Santen &
Sperling, 1985), it was shown by Hock et al. (2009) that it could
plausibly be accounted for by the detection of counterchanging
activation. Their account, which is recapitulated below, was
based on the distribution of excitatory and inhibitory effects
on spatial filters by the randomly arranged white and black
elements constituting the short-range motion stimulus (Fig. 8).
Among the many edge filters that are stimulated by the
figural portion of a random checkerboard, there are some that
are (by chance) positively activated during the first frame of
each two-frame trial (Fig. 8b). When the figure is displaced to
a new location during frame 2, the filters that were excited
during frame 1 will be stimulated by a distribution of elements
that is more likely to produce a decrease than an increase in
activation. (It is illustrated in Fig. 8a that there is a greater
range of possible exCitation and inhibition levels that would
lead to decreases, as compared with increases, in activation.)
At the same time, the elements of the figure that had produced
an excitatory effect on an edge filter during frame 1 are exactly
displaced to a new location during frame 2, where they will
produce similar activation of another, paired edge filter with
the same excitatory/inhibitory polarity. It is likely that this
filter was more weakly activated during frame 1, so its activation is likely to increase. A counterchange motion detector
spanning these two locations within the figure will be activated by the multiplicative combination of decreased activation
at one edge filter location and increased activation at another
edge filter location. There is no constraint for the non-Fourier
counterchange model that requires a quadrature relationship
between the sizes of the edge filters and their span, so the size
of the edge filters was the same for all spans.
As was indicated earlier, the outputs of the edge filters are
half-wave rectified, so only positive activation levels are
passed forward. Likewise, the outputs of the decrease and
increase detectors are half-wave rectified before they are multiplied to yield a directionally-selective motion computation.
The reasons for the inclusion of half-wave rectification after
each stage of processing are twofold: for reasons of neural
plausibility and for conceptual soundness of the counterchange principle. These issues are addressed in more detail
in the General Discussion section.
In order to detect the motion of both white–black and
black–white edges, two channels detect counterchange motion in parallel. One channel is responsible for edge filters with
their excitatory zone on the left, and the other channel for
those with their excitatory zone on the right. The motion
computations for the two channels are then combined and
the leftward signals subtracted from the rightward to yield a
single array of motion responses.6
Finally, the counterchange model assumes that any decrease in edge filter activation can contribute to only one
motion signal. Shorter-path motions beginning at the location
of the activational decrease are preferred over longer-path
motions, and in the case of conflicting directions of the same
span, the stronger motion is preferred (in the case of equal
strength, one motion or the other is chosen with an equal
chance).
Results
Single-trial simulations
For small displacements (e.g. 2 bar-units rightward) in the
same-polarity condition, rightward motions (in the direction
of the displacement) were most strongly activated within the
figure for the span corresponding to the size of the displacement (i.e., the motion signals were coherent; Fig. 5c).
6
Although we used both polarity channels in the present simulation,
virtually identical results are obtained when only one polarity channel is
employed. However, because the ERD utilizes both edge polarities, a
more direct comparison was achieved by including both channels.
Additionally, including both channels shows that they do not interfere
with one another.
�Atten Percept Psychophys
(a)
Negative (inhibited)
edge filter responses
Positive (excited) edge
filter responses
Frequency
When an edge filter is activated during
Frame 1 (the solid vertical line), it is
likely that it its activation will be
reduced during Frame 2 (the shaded
gray area is greater than the unshaded area)
0
Edge Filter Activation
(b)
SAME-POLARITY
(c)
INVERTED-POLARITY
(no reverse-phi)
Location Location
A
B
-
+
Frame 1
Filter
Response
Half-Wave
Rectification
-
+
+
-
+ -
Frame 1
Frame 1
+2
-1
+2
-1
0
+2
+2
0
+2
0
0
+2
(Displacement with
inverted polarity)
(Displacement)
+
-
-
+
+
-
-
+
(Displacement with
inverted polarity)
+
-
+
-
Frame 2
Frame 2
Frame 2
Filter
Response
-
+
INVERTED-POLARITY
(reverse-phi)
Location Location
A
B
Location Location
A
B
-
+
(d)
+1
+2
-1
-2
+2
0
Half-Wave
Rectification
+1
+2
0
0
+2
0
Change Detection
-1
+2
-2
0
+2
-2
+1
0
+2
0
0
+2
0
+2
0
0
+2
0
(Frame 2 - Frame 1)
Decrease Detection
(Inverted and
half-wave rectified)
Increase Detection
(Half-wave rectified)
Counterchange
(Motion)
No
Counterchange
(No Motion)
Counterchange
(Reverse motion)
�Atten Percept Psychophys
8 Sketch of counterchange detection of motion in random-dot
cinematogram, restricted to one polarity for simplification. a Illustration
of why positively activated edge filters are likely to undergo a decrease in
activation when the pattern is displaced out of their current location. For
the same reason, there is likely to be an increase in activation at the
location the pattern is shifted to. b Example of counterculture motion
being detected for a stimulus in the same-polarity condition. c Typical
nullification effects of polarity inversion on counterchange motion. d
Arrangement of dots that elicit reverse-phi counterchange motion under
polarity inversion
Fig.
Responses in the background regions were sparser than in the
figure, with inconsistent directionality.
For larger displacements (e.g., 6 bar-units; Fig. 5d), there
was still activity within the figure region at the span corresponding to the displacement. However, it was less consistent
than for the small displacements, with the distribution of
motion responses spread across other, especially shorter,
spans. Again, the background regions are sparsely activated
and directionally incoherent.
In the inverted-polarity condition, motion signals were
generally very sparse, both within and outside of the figure.
At the span corresponding to the displacement, there are no
motion signals generated within the figure in the displacement
direction and a small number in the reverse direction. The
latter skews the response distribution in favor of a leftward
total response. This is indicated in Fig. 8c, d and is addressed
in the General Discussion section.
Simulation of experimental results
The counterchange model does a very good job of simulating
the averaged experimental results for direction and shape
discrimination (Fig. 6a, b). It successfully simulates the effect
of displacement size (both direction and shape discrimination
were poorer for the larger figure displacements) and also
simulates the weaker direction and shape discrimination obtained in the inverted-polarity condition.
These results contradict the general view that short-range
motion is perceived via motion energy detection and that the
perception of reverse-phi motion in particular is necessarily
the result of motion energy detection. They show that a much
different, non-Fourier model entailing the detection of
counterchanging activation can fully account for both the
perception of short-range motion and motion in the reversephi direction.
Spatial prefiltering
Whereas the scale of the edge filters for the ERD model were
determined by the quadrature constraint of the model, the edge
filters for the counterchange model were the same for all spans
and were selected to be responsive to the intrinsic scale of the
checkerboard stimulus. The filters for the counterchange
model therefore were relatively small. Morgan (1992), however, has argued for a stage of spatial low-pass filtering prior to
motion processing in order to account for how effects of
displacement size vary with the size of the elements and the
spatial frequency content of the image. Implementing this
low-pass prefiltering did not produce major deviations from
the simulation results obtained with the counterchange model
without prefiltering. (This also was the case for the ERD
model.)
General discussion
Any mechanism that yields symmetrical responses to sameand inverted-polarity two-frame stimuli cannot, by itself, account for asymmetrical data in either motion or shape discrimination for the short-range motion paradigm. In order for a
motion detector to potentially account for the observed asymmetry, its polarity channels must either function in a completely segregated manner or contain a parameter that enables
between-polarity interactions to be weighted differently than
within-polarity interactions. The ERD, which in this article
served as a representative model for the detection of first-order
motion energy, does not segregate its polarity channels, nor
does it contain a parameter that could weight the interactions
of the polarity channels differently; therefore, it necessarily
gives symmetrical responses to same- and inverted-polarity
conditions. Moreover, symmetry with respect to polarity inversion is not unique to the ERD. It is intrinsic as well to
Adelson and Bergen’s (1985) motion energy detector, which
replaces the multiplication scheme of the ERD by a sum-ordifference-then-square scheme. Despite such internal differences, it is formally equivalent on output to the ERD.
Both the ERD and the motion energy detector are
comparator-type detectors that call for a quadrature arrangement of filters in order to approximate a region in the spatiotemporal Fourier domain. However, this quadrature arrangement is not a necessary condition for obtaining symmetrical
responses to same- and inverted-polarity stimuli. Rather, the
symmetry that these detectors exhibit results from treating
both positive and negative spatial filter responses in the same
manner; that is, the output values of spatial filters are treated
arithmetically (e.g. multiplying negatives to get a positive
response), rather than as representing a biophysical quantity
in the nervous system. Consequently, when luminance polarity is inverted, the sign of the spatial filter response is also
inverted but retains the same magnitude. Regardless of whether one uses the multiplication scheme of van Santen and
Sperling’s (1985) ERD or the sum-or-difference-then-square
scheme of Adelson and Bergen’s (1985) motion energy detector, this inversion of the local spatial filter responses on the
second frame results in a change in the sign (direction) but not
the magnitude (strength) of the final motion detection output,
�Atten Percept Psychophys
leading to reverse-phi motion of equal magnitude to that in the
same-polarity condition. Moreover, the symmetry that results
from this multiplicative interaction is not unique to
comparator-type detectors. Gradient detectors that evaluate
motion at zero-crossings (Marr & Ullman, 1981) exhibit symmetry for the same reason. That is, inverting polarity on the
second frame changes the sign of the temporal derivative,
consequently inverting the sign of local motion signals while
preserving their magnitude and spatial distribution (Sato,
1989). The contribution and interaction of negative values in
comparator-type (and gradient) detectors raises questions with
respect to their biological plausibility. Neural systems generally communicate via action potentials, where only positive
activation is transmitted to postsynaptic units (Heeger, 1993).
Inhibition of a neuron reduces the amount of output, but
chemical synapses cannot transmit less-than-zero values.
The less-than-zero contributions entailed in the ERD (and
other models) makes a one-to-one mapping from the model
to the nervous system doubtful, since negative values are not
treated as inhibitory. In contrast, the counterchange detector,
which successfully accounts for the asymmetrical effect of
luminance polarity on direction and shape discriminations, is
neurally plausible, since only positive activation values contribute to motion detection computations.
Source of asymmetry and reverse-phi in counterchange model
The half-wave rectification of edge filter outputs also is responsible for motion being asymmetric in the same- and
inverted-polarity conditions. Because motion is computed
within polarity channels and not between them, stimuli that
would have signaled motion in the same-polarity condition in
most cases have their motions nulled rather than reversed in
the inverted-polarity condition. An example in Fig. 8 is restricted to one polarity channel for simplicity. In the samepolarity condition (Fig. 8b), a pattern of elements that is
positively stimulating edge filter A in frame 1 is shifted to
edge filter B in frame 2. This shift causes a decrease in
response in A and an increase in response in B, signaling
motion in that polarity channel from A to B. In the invertedpolarity condition (Fig. 8c, d), the response of B in frame 2 is
necessarily of the opposite polarity. Its response is therefore
negative, and the half-wave rectification leads to an output of
zero. A zero output during frame 2 implies that over the course
of the two frames at B, the only possible responses are a
decrease or no response (i.e., there cannot be an increase to
zero, since it is the lowest possible value for a half-wave
rectified signal).
In the inverted-polarity condition, some arrangements of
stimulus elements lead to counterchange detection in the
direction opposite to displacement (reverse-phi motion).
Figure 8d shows an example of such an arrangement. In frame
1, a near-zero response is elicited in an edge filter at location
A, and a stronger positive response is elicited in an edge filter
at location B. In frame 2, the near-zero response from location
A has shifted to location B and been inverted, causing a
decrease in activation (the inverted response of a near-zero
output is also near-zero), while new elements are shifted into
location A that happen to cause an increase in that polarity
channel, eliciting a (reverse) counterchange response. This
reverse-phi signaling is rare, as compared with counterchange
detection in the same-polarity condition in the direction of
displacement, since most responses are zeroed and do not lead
to a reverse-phi signal. This leads to the observed asymmetry
between same- and inverted-polarity counterchange detection.
Half-wave rectification in the counterchange model
Half-wave rectification at each stage of processing (only positive activation levels are passed forward) is an essential
feature of the counterchange model. In addition to its previously discussed biological plausibility (a given neuron can
transmit more or fewer action potentials, but never less-thanzero), half-wave rectification ensures that inhibitory activation
states have no role in signaling the presence of counterchange,
which entails a motion event that is detected by virtue of the
(effectively) simultaneous decrease in a feature at one location
and increase in that same feature at another location. In the
present case, the features are white–black (and black–white)
edges that are formed by chance within a random
cinematogram; motion is signaled from the location of a
decrease in edge filter activation to the location of an increase
in edge filter activation. Such features can be (more or less
strongly) present, or not present, but not negatively present.
Moreover, if half-wave rectification were removed prior to
the detection of decreases and increases in spatial filter activation, the resulting negative values would introduce ambiguities into the conceptual framework of counterchange. For
example, the response of a BW filter would be positive to a
black–white (BW) edge, negative to a white–black (WB)
edge, zero to a black–black (BB) nonedge, and zero to a
white–white (WW) nonedge. If the BW edge filter is exposed
to a two-frame sequence in which it is stimulated first by a WB
edge, followed by a WW nonedge, its activation will have
gone from a negative value to zero, so it would have increased
(assuming no rectification). However, in order to conform to
the principle of counterchange, this event is more appropriately registered as a decrease in the presence of a feature (WB
edge), rather than as an increase in a feature (BW edge).
Introducing half-wave rectification eliminates this ambiguity,
treating the increase of a BW edge as nonsymmetrical with
respect to the decrease of a WB edge (and vice versa). In other
words, the increase in one feature does not imply an equivalent decrease in its polar opposite feature. By including separate channels for each of the polar opposite edge filters, what
�Atten Percept Psychophys
would be a negative value for one channel (without rectification) constitutes positive values for the other channel.
Removing rectification before the outputs of the increase
and decrease subunits of the counterchange detector are multiplied also leads to violations of the counterchange principle,
eliminating directional selectivity. That is, instead of motion
occurring exclusively from the location of a positive response
for a decrease subunit to the location of a positive response for
an increase detector, the opposite motion could also be signaled from the location of the activation increase because the
negative output from a decrease detector (indicative of an
increase in activation) can be multiplied by a negative output
from an increase detector (indicative of a decrease in activation), yielding a positive motion detector output, erroneously
signaling motion from an increase to a decrease in local
activation.7
Dual motion pathways
It is well known that the nervous system is segregated into two
parallel pathways that respond with excitation to opposite
luminance-contrast polarities. The so-called ON and OFF
channels respond to luminance increments and decrements,
respectively. Here, we use the terms ON and OFF pathways to
refer to two parallel channels opposite luminance polarity
sensitivity and do not intend to imply a specific type of spatial
filter (e.g., center–surround, edge detector, etc.). The two
segregated polarity channels in the counterchange model can
be interpreted as corresponding to these two pathways, each
computing motion independently. Our simulations show that
these two segregated counterchange channels (or either one by
itself) are sufficient to account for both the standard and
reverse-phi percepts in the current stimulus. Furthermore,
other studies have shown evidence for the independence of
these channels in computing motion by demonstrating similar
asymmetries (e.g., Dosher, Landy, & Sperling, 1989; Edwards
& Badcock, 1994; Sato, 1989; Wehrhahn & Rapf, 1992).
In contrast, the aim of Bours, Kroes, and Lankheet (2009),
using a sparse random-dot display in which individual motion
signals were spatially and temporally uncorrelated, was to
show that motion detection thresholds were symmetrical for
same- and inverted-polarity dot-pairs. They argued that this
suggests that motion is computed by correlating (with equal
weighting) signals both within and between the ON and OFF
7
It would be feasible to remove one of the rectifiers after change detection as long as the other was still present and achieve reasonable behavior
from the detector; as long as the negative outputs of the motion detector
were ignored and only positive outputs signal motion (if one channel can
never go below zero, a positive product cannot result from multiplying
two negative values). However, the motion-opponency scheme employed
here to evaluate the final motion detection output would demand halfwave rectification on output of the motion detector, effectively displacing
a rectifier, but not eliminating it.
polarity channels, with between-channel correlations signaling reverse-phi motion. Such an architecture could account for
the symmetry observed in the ERD without appealing to the
interaction of negative activation values (an example of such a
detector can be seen in Eichner, Joesch, Schnell, Reiff, &
Borst, 2011).8
Although most of the parameter space probed in Bours
et al.’s (2009) experiments was not indicative of symmetry
(detection thresholds were higher for inverted-polarity
stimuli), symmetry with respect to luminance inversion was
consistently obtained for brief frame durations and small
displacements. Because they also are the spatial and temporal
conditions that are optimal for the perception of two-frame
short-range motion (Braddick 1974), it is worth considering
the implication of these results for motion detection. That is,
they indicate that for fast motions over short distances, direction discrimination is based on a motion mechanism that
correlates within- as well as between-polarity channels, which
is implied by motion energy models. Furthermore, the spatially and temporally uncorrelated nature of the motion signals
generated by Bours et al.’s (2009) stimuli implies that the
integration of motion signals does not depend on their being
simultaneous or spatially contiguous. In contrast, the shortrange motion paradigm studied in the present article constrains coherent motion signals to occur simultaneously and
within a spatially defined region (i.e., the displaced rectangle)
where all dots undergo the same frame-to-frame translation.
These conform to natural constraints of a rigidly translating
surface, where motion signals are necessarily generated simultaneously and are in close proximity to one another by
virtue of physical connectedness. Under these constraints,
there is convergent evidence that spatial structure is not recoverable when luminance polarity is inverted, while it is
recoverable when polarity is held constant. Evidence obtained
in the present study, Sato’s (1989), and Dosher et al.’s (1989)
are consistent in indicating that same-polarity motion correspondences are essential for the perception of shape from
motion.
Overall, these results are consistent with the existence of
dual pathways, one entailing within-polarity counterchange
mechanisms for the perception of motion for displaced objects, surfaces, and shapes, and the other entailing within- and
between-polarity motion energy mechanisms for the
8
Eichner et al. (2011) have also presented a ‘”2-quadrant” Reichardt
detector model in which only ON–ON and OFF–OFF spatial filter
pairings are established to account for physiological findings in the visual
system of the fly. This model showed weakened responses to invertedpolarity, as compared with, same-polarity, stimuli. However, it included
front-end elaborations whose introduction is not currently justified for the
human visual system. Nonetheless, it would be valuable for future studies
to compare the response characteristics of this Reichardt-variant detector
to the counterchange detector under conditions, which could clearly
distinguish the models (i.e., stimuli in which no counterchange information is present but a clear autocorrelation is not, and vice versa).
�Atten Percept Psychophys
perception of objectless global motion, without the individuation of particular objects, surfaces, and shapes.
The distinction between these two kinds of motion pathways has its origin in Wertheimer’s (1912) distinction between
beta (object) and phi (objectless) apparent motion. More recently, Sperling and Lu (1998) asserted that object motion
entails the detection of motion via their third-order, saliencebased motion system, whereas objectless motion is perceived
when motion is signaled only by first- or second-order motion
energy systems. Further evidence for dual pathways has come
from Azzopardi and Hock (2011), who found that motion
direction can be discriminated in the cortically blind hemifield
of an individual with unilaterally damaged visual cortex
(and thus, no object or shape perception) on the basis of
detected motion energy, whereas motion direction was
discriminated on the basis of changes in shape in the
unimpaired hemifield. Finally, Hock and Nichols (2013)
and Seifert and Hock (2014) have provided evidence
linking the perception of a surface’s motion with the
detection of counterchange and the detection of changes
in luminance (without the perception of surface motion)
to the detection of motion energy.
It is likely that these two motion systems, sensitive to
different stimulus patterns, subserve different behavioral functionalities—for example, the counterchange pathway to perceive changes in position of objects and the motion energy
pathway to perhaps detect optic flow patterns that guide
locomotion (Pelah et al., 2014). The motion energy pathway,
which leverages both within- and between-polarity-channel
correlations, subserves global motion perception, while the
counterchange pathway, detecting only same-polarity patterns, subserves form/motion perception, which can include
the derivation of a figure’s shape from the spatial relationships
among counterchange-determined motion signals (Fig. 9).
Further empirical work to identify the spatial and temporal
limits for the perception of spatial structure in the counterchange pathway and to determine what, if any, spatial localization is possible in the motion energy pathway would help to
further distinguish these two systems.
To summarize, several speculative conclusions can be
drawn from the relevant literature:
1. Although asymmetry in motion direction discrimination
between same- and inverted-polarity stimuli is observed
under most experimental conditions, evidence for symmetry is obtained for very fast motions over small distances in Bours et al. (2009). This parameter range is
typically associated with the short-range paradigm, suggesting that the presence of spatial structure among motion signals, which is absent in Bours et al.’s paradigm but
present in Braddick’s (1974) short-range paradigm, can
affect motion detection. The evidence for symmetry obtained by Bours et al. is consistent with motion energy as
the basis for motion direction discrimination in the absence of spatial structure.
2. The presence of temporal simultaneity and spatial contiguity among motion signals is not necessary to obtain
asymmetry with respect to luminance inversion; for example, Bours et al. (2009) have obtained evidence for
asymmetry with a stimulus for which motion signals are
spatially and temporally uncorrelated (this was the case
for slow motions over relatively long distances).
However, when simultaneity and spatial contiguity are
present, as in the short-range motion paradigm, asymmetry with respect to luminance inversion is obtained (as in
the present study) even when fast motions are perceived
over small distances (see Fig. 6b).
3. Spatial structure and form, including depth structure, is
recoverable only in same-polarity conditions (likely
through the detection of counterchange) and is decimated
in inverted-polarity conditions (Fig. 2 in the present study;
Dosher et al., 1989; Sato, l989).
4. To the extent that ON and OFF channels (or other
opposite-polarity channels) are correlated in motion detection, local spatial relationships are lost, and the motion
percept could be called global. Spatial and temporal
pooling in the motion energy pathway could be responsible for this loss (as suggested by the nature of the Bours
et al. [2009] stimulus).
The source of shape from coherent motion
The dual-pathways dichotomy described above proposes that
the detection of counterchange is basis for the derivation of
shape from coherent motion that has been defined as occurring
when multiple motion detector responses agree in direction
and span. When there is a high density of coherent motion
signals within some region of the moving image, that portion
of the image is perceived as moving together as a continuous
“surface.” In order to segregate the moving surface from the
background, coherent motion signals must be relatively dense
within the figure and relatively sparse and/or incoherent outside the figure. This difference in coherence and density
between the moving figure and the background is essential
for successful segregation and the recovery of shape, since it is
the only cue to the boundary of the figure.
This definition of coherence is at odds with how coherence
is typically framed in terms of motion energy (Sato, 1989;
Simoncelli & Heeger, 1998). The general motion energy
approach entails taking local velocity estimates of oriented
sinusoid components across a dynamic image. The output of a
given motion detector is then considered a time-varying velocity estimate at a given location, where the sign of the output
signifies the direction of motion and the magnitude signifies
the speed. In this view, multiple motion signals across some
�Atten Percept Psychophys
Fig. 9 Conceptual model of a
dual-pathway motion system. ON
and OFF here designate two
channels with opposite
luminance-polarity sensitivity and
do not necessarily imply a
particular type of spatial filter.
Both within- and betweenpolarity interactions subserve a
motion energy (ME) system that
detects global motion. Only
within-polarity interactions
subserve a counterchange (CC)
system in which spatial relations
of motion detectors are preserved,
allowing for recovery of form
from motion
Image
ON pathway
ON/OFF ME
(reverse phi)
ON ME
Global Motion
ON CC
OFF CC
Form and Motion
Motion Energy
Counterchange
Short-range
Objectless
Shapeless
Phi
Loss of Spatial relationships
Fast
Spatial and temporal pooling
Short- and Long-Range
Object
Shape
Beta
Recovery of spatial relationships
Fast and Slow
Spatial and temporal conservation
area of the image would be considered coherent if their
direction and speed were sufficiently similar (Yuille &
Grzywacz, 1998). In other words, among motion detectors
of the same scale and directional selectivity, a low variance
across the response magnitudes (speeds) would constitute
evidence of coherent motion. This presents a challenge for
the ERD account of shape-from-motion for short-range motion stimuli. For small displacements, single-trial simulations
for ERD detectors (Fig. 5a) indicate strong directional agreement, but with a high degree of variance in terms of magnitude
(and therefore, speed).9
The present approach using the counterchange detector
assumes a different role of motion detector responses. Rather
than the magnitude of the response representing a velocity
estimate, detector responses are conceived of as providing
evidence for a given displacement (corresponding to the span
of the detector). While the phase-invariant responses of motion energy detectors signal luminance-defined motion at a
single location, counterchange detectors signal motion of an
image feature (e.g., an edge) from one location to another. A
strong motion detector response indicates strong evidence for
a given displacement corresponding to the detector’s span.
Weaker responses, which could occur for multiple reasons
(pattern details, smaller contrast change, etc.), are not indicative of slower speeds but, instead, provide reduced evidence of
motion between two locations. There are two consequences of
this approach: (1) Counterchange-determined motion marks
9
OFF ME
OFF pathway
Sato’s (1989) motion-energy-based computations of shape-frommotion invoke a secondary “directed matching” algorithm, in addition
to a motion detection algorithm, in order to minimize the variance. Spatial
pooling in Sato’s model might also lead to a lower overall variance, but at
the cost of deteriorating spatial resolution, which is likely to be necessary
for figure segregation.
spatial distances, providing a direct basis for the recovery of
shape from motion, and (2) rather than a homogeneous (i.e.,
low-variance) response magnitude across a given direction
and span, a sufficient density of responses for a given span
is required for coherence within an image region.
While the interpretation of the outputs of ERD and counterchange detectors differ in general, in the present article,
they both simulate shape judgments with the same templatematching scheme. This scheme does not take into account the
variance of motion detector magnitudes, and the criterion for
coherence is the same for both models.
Theoretical framework for the recovery of depth
from counterchange motion
Although the definition discussed above limits motion coherence to motions of the same direction and span, this restriction
can be relaxed to account for coherent motion patterns that
give rise to the impression of depth structure in moving
images. The framework follows from the idea that motion
direction and shape discrimination entail patterns of activation
within and across layers of motion detectors with the same
directional selectivity, with each layer composed of a spatially
distributed, densely packed array of motion detectors. The
defining feature for each layer is that the same span separates
the pairs of edge filters that compose its constituent detectors.
When the directionally consistent motion detector activation within a displaced surface is concentrated in a particular
span-layer, it indicates that the detected motions all are in the
same depth plane, as must be the case for two-dimensional
surfaces oriented perpendicularly with respect to one’s line-ofsight. However, if motion signals within some local neighborhood occur at different, but similar, span-layers, these motions
�Atten Percept Psychophys
may be interpreted as belonging to a single surface that is
nonuniform in depth. For example, if a one-dimensional slice
were taken along the direction of motion from the front face of
a rotating cylinder composed of moving dots, all the dots
would be moving in the same direction but would stimulate
different span-layers depending on the speeds of the dots (the
speeds are constrained by the three-dimensional structure of
the cylinder). Dots near the outer edges of the cylinder would
be moving relatively slowly, therefore activating small-span
detectors. Toward the center of the cylinder, the speed of the
moving dots would increase, leading to the activation of
larger-span detectors, with a maximum span reached at the
center. With a sufficient density of dots, this cross-layer activation pattern would be smooth, with neighboring detectors
differing only minimally in span. Templates similar to the
ones used in the present simulations for single-depth motion
could respond to sufficiently smooth patterns across spanlayers, signaling depth structure in the moving image.
The single-trial simulations in Fig. 5, which were the basis
for the discrimination of motion direction and shape in the
short-range motion paradigm, made it possible for the counterchange model and the ERD motion energy model to be
compared with respect to their compatibility with this theoretical framework for deriving depth structure from image motion. Two features of the simulations are relevant: (1) the
extent to which motion detector activation for displaced surfaces is concentrated within the same span-layer and (2) the
spatial resolution of the activation patterns.
Concentration of activation within a span
It can be seen for the ERD simulations in Fig. 5 that
directionally consistent motion is most strongly concentrated
within the displaced surface for the detector span that corresponds to the surface’s displacement. However, directionally
consistent activation is evident for other spans. The latter
occurs because the ERDs are Fourier-based, so their edge
filters are constrained to maintain a quadrature relation between filter size and span. As a result, the detectors composing
different span-layers overlap significantly in terms of their
spatiotemporal frequency response. Thus, a motion detection
response in a given layer is likely to be accompanied by
similar responses in layers with similar spatiotemporal frequency sensitivities (i.e., with similar spans). Because of the
Fourier character of motion energy detectors like the ERD,
this sort of diffusion across multiple span-layers is unavoidable for most displaced objects.
This “muddling” of span-layer activation for the ERD does
not occur for the counterchange model, because directionally
consistent motions are concentrated within the displaced surface only for the detector span that corresponds to the surface’s displacement (particularly for small displacements).
Because the counterchange model does not require a
quadrature relationship between the span and size of the edge
filters composing the motion detectors, detectors have the
same size edge filter for every span. The consequence is that
the spatiotemporal stimulus patterns that a detector is sensitive
to are more dissimilar across span-layers than for the Fourierbased ERD. Because the edge filters for each span respond to
the same stimulus information, the detectors whose span
corresponds to the actual figure displacement will generally
signal more strongly and more often than displacementinconsistent spans. In addition to this, the shortest-path selection constraint in the counterchange simulation minimized
further the incidences of multiple motion signals occurring
across multiple span-layers at a given location.
Spatial resolution
It also can be seen in Fig. 5 that essentially all ERD detectors
composing a span-layer are activated for virtually every location across the short-range motion stimulus, regardless of
whether the detectors’ edge filters are responding to changes
in element luminance occurring within the displaced figure or
within the background. In contrast with this spatially continuous distribution of activation, the distribution of counterchange detector activations within the figure is dense but
discontinuous, and outside the figure, responses are very
sparse (Fig. 5c). This is due to the counterchange detectors
being much more selective than the ERD motion energy
detectors (and not to the difference in spatial filter inputs to
the two models). That is, counterchange detectors are responsive to a much smaller number of random dot patterns than are
motion energy/comparator models like the ERD. This is because counterchange detectors are activated only when their
edge filters are affected by changes in element luminance that
result in decreases in edge filter activation at one location and
increases in edge filter activation at another location, whereas
nearly any change in edge filter response will result in a
motion signal for the ERD. A discontinuous but dense distribution of activated motion detectors is important for the
spatial resolution of the shapes that are derived from detected
motion, especially when such a pattern indicates depth structure. That is, recovering depth would be exceedingly difficult
if it were unclear which span-layer was optimally stimulated at
a given location, since the relation between neighboring motion signals at different spans would need to be differentiated
in order to discern differences in depth.
Conclusion
In this article, we have demonstrated the insufficiency of
comparator-type motion energy detectors such as the ERD
in accounting for motion direction perception and shape-frommotion segregation in the short-range motion paradigm. As an
�Atten Percept Psychophys
alternative, we have shown the plausibility of a
counterchange-based mechanism in accounting for these experimental results. It is argued that the detection of
counterchange-determined motions mark spatial distances,
providing a direct basis for the perception of spatial shape
from motion. In addition, we have suggested how counterchange detection could be extended to account for the recovery of depth from motion. Finally, non-Fourier counterchange
detection can potentially account for other phenomena (e.g.,
the correspondence problem) that do not conform well to
motion-energy formulations without necessitating high-level
token trackers or centralized cost–function calculations
(Dawson, 1991; Morgan, 1992).
Appendix 1. Computational simulations
Stimulus
Implementation of the ERD (Fig. 4a)
Four scales of edge filters are used for the ERD simulation.
This is necessary in order to approximate quadrature for
motion detectors with differing spans (i.e., distance between
the center of the receptive fields that serve as inputs to a
motion detector). Parameter values are listed below, with
subscripts indicating layer numbers, with layers 1, 2, 3, and
4 corresponding to motion detectors with spans of 2, 4, 6, and
8 bars, respectively.
p1 ¼ 8; p2 ¼ 16; p3 ¼ 24; p4 ¼ 32
σ1 ¼ 1:6; σ2 ¼ 3:2; σ3 ¼ 4:8; σ4 ¼ 6:4;
For each motion detector layer, the entire one-dimensional
stimulus is convolved with the corresponding edge filter kernel (convolution being notated by *) for both frames (here
notated with the index i). The result is truncated at both ends to
maintain the original stimulus size:
ri ðxÞ ¼ gðxÞ� S ðx; iÞ:
The stimuli, each consisting spatially of 240 bars and temporally of two frames, are defined as S(x,t) at all locations along
the stimulus array x = [1 960]. Each random bar is composed
of 4 pixels), with each location taking on the value 0
(representing black) or 1 (representing white) and t = 1,2
(representing frames 1 and 2). A central figure region (either
60 or 120 bars long) is translated to the right by 2, 4, 6, 8, 10,
12, 14, or 16 bar-widths from frame 1 to frame 2, while the
background regions are independently and randomly generated for each frame.
For each location along the detector array a motion signal
m(x) is calculated by
mðxÞ ¼ r1 ðxÞr2 ðx þ x0 Þ−r1 ðx þ x0 Þr2 ðxÞ;
where ri(x) is the edge filter response at location x for frame i
and x′ is the magnitude of the detector span corresponding to a
given motion detection layer. The resulting array is padded
with zeros in order to maintain the one-to-one correspondence
between the motion detector array and the stimulus.
Edge filters
Implementation of the counterchange detector (Fig. 4b)
One-dimensional real-valued Gabor functions (a Gaussian
window modulated by a sine function) are used for all spatial
filtering in both the ERD and counterchange detectors. The
function is centered around zero and uses a 0-phase sine-wave
modulator so that it serves as a balanced receptive field by
virtue of it being antisymmetrical around zero. The filter is
described by the equation g(x) below. Parameter σ sets the
standard deviation of the Gaussian window, and parameter p
sets the period of the sine wave modulator (in dot units). The
ratio between the two parameters is the same in all edge filter
instantiations, regardless of scale (p/σ = 5). Finally, edge
filters are normalized such that their positive lobes always
are integrated to 1 and their negative lobes to −1.
g ðxÞ ¼ wðx; σÞcðx; pÞ
x2
wðxÞ ¼ e− 2σ�2
1
cðxÞ ¼ sin 2π⋅ ⋅x
p
Only one scale of edge filter was used for the counterchange
detector, regardless of the span. The parameters were
p ¼ 2; σ ¼ :4:
Both frames of the stimulus are convolved with the edge
filter. In a computational shortcut, two polarity channels are
derived from the filter response by half-wave rectifying the
filter responses to form channel 1 and inverting and half-wave
rectifying the responses to form channel 2.
Half-wave rectification:
�
x when > 0
hð x Þ ¼
0 when ≤ 0
Channel 1 responses for frames i = [1,2]:
�
r1i ðxÞ ¼ hðri ðxÞÞ
�Atten Percept Psychophys
Channel 2 responses for frames i = [1,2]:
r2i ðxÞ ¼ hð−ri ðxÞÞ
The frame-to-frame change in filter response is calculated
as
cc ðxÞ ¼ rc2 ðxÞ−rc1 ðxÞ;
where subscript c stands for channel c = [1,2] and the second
subscript refers to the frame index.
Decrease and increase responses for each channel are calculated by taking the half-wave rectified change values for the
increase response and inverting and half-wave rectifying for
the decrease responses:
i c ð x Þ ¼ hð c c ð x Þ Þ
d c ðxÞ ¼ hð−cc ðxÞÞ
For each location along the detector array of a given span,
motion is computed for both channels and summed into a
single motion vector:
X
d c ðxÞ⋅ic ðx þ x0 Þ−d c ðx þ x0 Þ⋅ic ðxÞ;
mðxÞ ¼
c¼1;2
where x′ equals the span of a given layer. Motion response
arrays are padded with zeros in order to maintain correspondence with the stimulus. Finally, motion responses over a
threshold (.2 in the reported simulations) inhibit longer range
motions originating from the same decrease locations (i.e., the
inhibited motions are set to 0). If two motions sharing a
decrease location are of the same span but opposite directions,
the stronger response is taken and the other set to 0, or else for
equal strength motions one is selected with a .5 probability
and the other set to 0. Thresholding prevents near-zero responses from contributing to inhibitory interactions, but the
exact size of this threshold did not have much effect, since
individual counterchange responses tended to be very vigorous or very weak (i.e., well above or well below threshold).
These interactions serve as a weak shortest-path assumption in
the counterchange model (weak because splitting motions are
prevented, but converging motions are not).
Direction decisions
After each trial, for each of the two detector arrays (ERD and
counterchange), the motion responses are summed across all
locations and spans. Rightward motion was signified by positive values, and leftward motion by negative values.
line, after each trial. The templates consist of an interior positive region that corresponds to the figure sizes (60 and 120
bars) and flanking negative regions that extended to the edge of
the stimulus. The value is homogeneous across the interior
region (i.e., the same at all locations) and, likewise, is homogeneous across the flanking regions. The interior regions were
normalized such that they integrated to a value of 1, and the
flanking regions are normalized to integrate to a value of −1.
After a trial, rightward and leftward motions for each detection
layer are separated in order to assess their template response
independently (leftward motions were made positive so that
only positive responses were considered as template matches).
Each span-layer (separated by direction) is correlated with both
templates. The corresponding figure of the maximum template
response is taken as the shape decision for a given trial.
Appendix 2 Symmetry of elaborated Reichardt detector
to two-frame same- and inverted-polarity stimuli
Consider a two-frame stimulus J in which frame 1 is some
spatial function f(x) and frame 2 is some other spatial function
g(x). A point-delay’Reichardt detector exposed to stimulus I
can then be described as
Rx1 ;x2 ;δt ½I ðt Þ ¼ I ðx1 ; t−δt ÞI ðx2 ; t Þ−I ðx1 ; t ÞI ðx2 ; t−δt Þ
where x1 and x2 are the two points in space that the
detector is sensitive to and δ t is the delay used to
detect motion across the two points. In response to the
two-frame stimulus J, Rx1 ;x2 ;δt ½ J ðt Þ will be zero, except
for those ts during frame 2 for which frame 1 was on at
time t−δt. For all such ts,
Rx1 ;x2 ;δt ½ J ðt Þ ¼ f ðx1 Þgðx2 Þ− f ðx2 Þg ðx1 Þ:
Now consider the inverted-polarity version of the same
stimulus K with the same first frame f(x), but in which spatial
function of the second frame h(x) is the opposite of g(x):
hðxÞ ¼ −gðxÞ
Rx1 ;x2 ;δt ½K ðt Þ ¼ f ðx1 Þhðx2 Þ− f ðx2 Þhðx1 Þ
¼ f ðx1 Þð−gðx2 ÞÞ− f ðx2 Þð−gðx1 ÞÞ
¼ −ð f ðx1 Þg ðx2 Þ−f ðx2 Þgðx1 ÞÞ
Thus,
Rx1 ;x2 ;δt ½K ðt Þ ¼ −Rx1 ;x2 ;δt ½ J ðt Þ:
Shape decisions
Two templates that corresponded to the 2 one-dimensional
figures are used to make a shape decision, long versus short
Furthermore, Chubb and Sperling (1988) proved that the
response of any Reichardt detector with arbitrary spatial and
temporal filters can be expressed as a linear combination of
�Atten Percept Psychophys
point-delay Reichardt detector responses. This implies that the
response of any given Reichardt detector, regardless of its
spatial or temporal sampling characteristics, is the negative
of the detector’s response to an otherwise identical two-frame
stimulus in which the luminance polarity of the second frame
is inverted. This is true regardless of whether or not the two
frames represent a spatiotemporally shifted pattern (i.e., motion) or not (i.e., noise).
References
Adelson, E. H., & Bergen, J. R. (1985). Spatiotemporal energy models for
the perception of motion. Journal of the Optical Society of America
A, 2(2), 284–299.
Anstis, S. M. (1970). Phi movement as a subtraction process. Vision
Research, 10(12), 1411–1430.
Azzopardi, P., & Hock, H.S. (2011). Illusory motion perception in
blindsight. Proceedings of the National Academy of Sciences, 108,
876–881.
Bours, R., Kroes, M., & Lankheet, M. J. (2009). Sensitivity for reversephi motion. Vision Research, 49(1).
Braddick, O. (1974). A short-range process in apparent motion. Vision
Research, 14, 519–527.
Cavanagh, P., & Mather, G. (1989). Motion: The long and short of it.
Spatial vision, 4(2–3), 2–3.
Chubb, C., & Sperling, G. (1988). Drift-balanced random stimuli- A general
basis for studying non-Fourier motion perception. Optical Society of
America, Journal, A: Optics and Image Science, 5, 1986–2007.
Dawson, M. R. (1991). The how and why of what went where in apparent
motion: Modeling solutions to the motion correspondence problem.
Psychological review.
Dosher, B. A., Landy, M. S., & Sperling, G. (1989). Kinetic depth effect
and optic flow–I. 3D shape from Fourier motion. Vision Research,
29(12), 1789–1813.
Edwards, M., & Badcock, D. R. (1994). Global motion perception:
Interaction of the ON and OFF pathways. Vision Research.
Eichner, H., Joesch, M., Schnell, B., Reiff, D. F., & Borst, A. (2011).
Internal structure of the fly elementary motion detector. Neuron,
70(6), 1155–1164. doi:10.1016/j.neuron.2011.03.028
Gilroy, L. A., & Hock, H. S. (2009). Simultaneity and sequence in the
perception of apparent motion. Attention, Perception &
Psychophysics, 71(7), 1563–1575. doi:10.3758/APP.71.7.1563
Heeger, D. J. (1993). Modeling simple-cell direction selectivity with
normalized, half-squared, linear operators. Journal of
Neurophysiology, 70(5), 1885–1898.
Hock, H. S., Gilroy, L., & Harnett, G. (2002). Counter-changing luminance: A non-Fourier, nonattentional basis for the perception of
single-element apparent motion. JOURNAL OF EXPERIMENTAL
PSYCHOLOGY HUMAN PERCEPTION AND PERFORMANCE,
28(1), 93.
Hock, H., Schöner, G., & Gilroy, L. (2009). A counterchange mechanism
for the perception of motion. Acta Psychologica, 132(1), 1–21.
Hock, H. S., & Nichols, D. F. (2013). The perception of object versus
objectless motion. Attention, Perception, & Psychophysics, 75(4),
726–737.
Lu, Z. L., & Sperling, G. (2001). Three-systems theory of human visual
motion perception: Review and update. Journal of the Optical
Society of America A, Optics, image science, and vision, 18(9),
2331–2370.
Marr, D., & Ullman, S. (1981). Directional selectivity and its use in early
visual processing. Proceedings of the Royal Society B: Biological
Sciences, 211(1183), 151–180. doi:10.1098/rspb.1981.0001
Morgan, M. J. (1992). Spatial filtering precedes motion detection. Nature,
355(6358), 344–346. doi:10.1038/355344a0
Pelah, A., Barbur, J., Thurrell, A., & Hock, H.S. (2014). The Coupling of
Vision with Locomotion in Cortical Blindness. Vision Research, (in
revision).
Reichardt, W. (1961). Autocorrelation, a principle for the evaluation of
sensory information by the central nervous system. In W. A.
Rosenblith (Ed.), Sensory Communication (pp. 303–317).
Cambridge: MIT Press.
Sato, T. (1989). Reversed apparent motion with random dot patterns.
Vision Research, 29(12), 1749–1758.
Seifert, M.S., & Hock, H.S. (2014). The Independent Detection of
Motion Energy and Counterchange: Flexibility in Motion
Detection. Vision Research, (in revision).
Simoncelli, E. P., & Heeger, D. J. (1998). A model of neuronal responses
in visual area MT. Vision Research, 38(5), 743–761.
Sperling, G., & Lu, Z.-L. (1998). A systems analysis of visual motion
perception. High-level motion processing, 153–183.
Stevens, M., & Merilaita, S. (2009). Animal camouflage: Current issues
and new perspectives. Philosophical Transactions of the Royal
Society B: Biological Sciences, 364(1516), 423–427. doi:10.1098/
rstb.2008.0217
van Santen, J. P., & Sperling, G. (1984). Temporal covariance model of
human motion perception. JOSA A, 1(5), 451–473.
van Santen, J. P., & Sperling, G. (1985). Elaborated Reichardt detectors.
Journal of the Optical Society of America A, Optics and image
science, 2(2), 300–321.
Wehrhahn, C., & Rapf, D. (1992). ON- and OFF-pathways form separate
neural substrates for motion perception: Psychophysical evidence.
The Journal of Neuroscience, 1–4. Retrieved from http://www.
jneurosci.org.ezproxy.fau.edu/content/12/6/2247.full.pdf
Wertheimer, M. (1912). Experimental studies of the perception of movement (Experimentelle Studien über das Sehen von Bewegung).
Zeitschrift für Psychologie under Physiologie der Sinnesorgane,
61, 161–265.
Yuille, A. L., & Grzywacz, N. M. (1998). A theoretical framework for
visual motion. In T. Watanabe (Ed.), High-level motion processing
(pp. 187–211). Cambridge: The MIT Press.
�
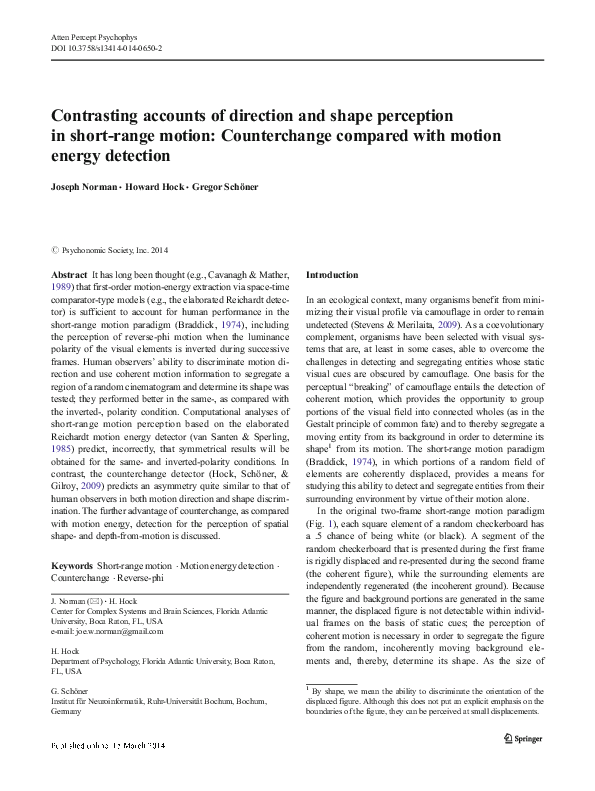
 Joe Norman
 Gregor Schoner
 Howard Hock