S136
Poster Presentations – 14th International Symposium on Myelodysplastic Syndromes / Leukemia Research 55 S1 (2017) S45–S167
<5% blasts from TNCs and ≥15% ring sideroblasts, fulfilling current
definition for RARS (WHO 2001 and 2008) and RCMD-RS (WHO
2001). Moreover 1,233 patients with ≥5% ring sideroblasts and <5%
blasts were analyzed in order to explore the future definition of
WHO 2016, that considered as MDS-RS those patients with 5–<15%
ring sideroblasts if SF3B1 mutation is present. This was a tentative
analysis since SF3B1 mutation information was not available in our
series. Percentage of BM blasts from NECs was calculated as
follows: [%blasts from TNCs/(100-%erythroblasts) × 100]. Survival
curves and univariable and multivariable Cox regression analysis
were implemented.
Results: Median age at diagnosis was 76 y (25–101 y). Median
follow-up was 50.1 months and median OS was 96.5 months.
Enumerating blasts from NECs, 10% of MDS-RS were reclassified
into categories with ≥5% blasts and showed a poorer OS than did
those who remained in initial categories (median OS, 68.1 vs 97.6
months, P = 0.025; Hazard ratio (HR): 1.41; 95%CI: 1.04–1.91; P =
0.026). After adjusting the analysis by IPSS cytogenetics, the
prognostic impact of blasts considered from NECs maintained its
significance (HR: 1.37; 95%CI: 1.01–1.85; P = 0.045). Similar results
were observed applying this method to the group of MDS patients
with ≥5% ring sideroblasts and <5% blasts. By considering BM blasts
from NECs, 10% of these patients were reclassified into categories
with ≥5% BM blasts and showed a poorer OS than did those who
remained in initial categories (median OS, 60.2 vs 85.8 months, P =
0.003; HR: 1.51; 95%CI: 1.15–1.97; P = 0.003; HR adjusted for IPSS
cytogenetics: 1.46; 95%CI: 1.12–1.92; P = 0.006).
Conclusion: considering bone marrow blasts from nonerythroid
cells improves the prognostic evaluation of MDS with ring
sideroblasts.
236
IMPROVING RISK STRATIFICATION OF MDS PATIENTS BY THE
INTEGRATION OF RBC-TRANSFUSION DEPENDENCY INTO THE
REVISED INTERNATIONAL PROGNOSTIC SCORING SYSTEM
M. Arnan1, H. Pomares1, I. Sánchez-Ortega1, E. Alonso2,
M. Encuentra3, X. Grau4, A. Sureda1
1
Hematology Department, Hospital Duran i Reynals. Intitut Català
d’Oncologia, Barcelona, Spain; 2Patology Department, Hospital de
Bellvitge, Barcelona, Spain; 3Hospital Duran i Reynals. Intitut Català
d’Oncologia, Clinical Research Unit, Barcelona, Spain; 4Department of
Laboratory Hematology, Hospital Universitari Germans Trias i PujolICO- Josep Carreras Leukemia Research Institute, Badalona, Spain
Background: IPSS was revised (R-IPSS) to better define the
prognostic impact on OS and PFS for patients with MDS.
Although RBC-transfusion dependency (RBC-TD) is associated
with poor prognosis, it was not included in R-IPSS because of the
relatively low proportion of patients with available data. We
hypothesize that the use of RBC-TD status may improve the R-IPSS
prognostic assessment.
Aim: To assess the impact of RBC-TD in addition to R-IPSS in
predicting survival outcome.
Methods: We identified 818 untreated MDS, AML (20–30%blasts)
and CMML patients. RBC-TD was defined as ≥1 RBC transfusion
every 8 weeks over a 4-months period (Malcovati JCO 2007).
Patients were classified into two groups according to RBC-TD at time
of or before the landmark time point. Landmark analyses were
conducted at 6, 12, 24 and 36 m after diagnosis. Patients experiencing the event (i.e. death) before the landmark time point were
excluded.
Results: Median age: 72 y (29–101). 65% males. R-IPSS categories:
29.9% Very Low, 44% Low, 15.8% Intermediate, 4.7% High and 5.7%
Very High risk. Median OS was lower in males (4.4 vs. 6.6y; p <
0.001) and in elderly patients (10, 5.7 and 2.9 y in <65, 65–80, >80 y
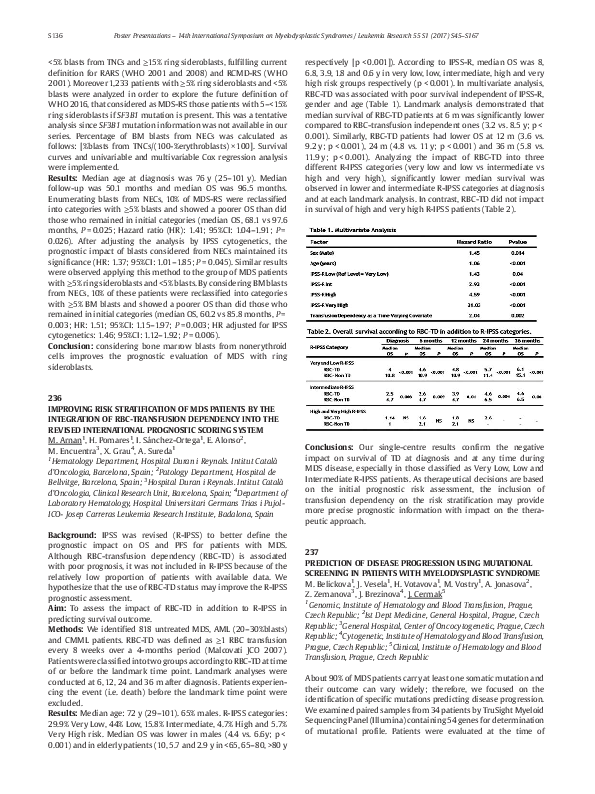
respectively [ p < 0.001]). According to IPSS-R, median OS was 8,
6.8, 3.9, 1.8 and 0.6 y in very low, low, intermediate, high and very
high risk groups respectively ( p < 0.001). In multivariate analysis,
RBC-TD was associated with poor survival independent of IPSS-R,
gender and age (Table 1). Landmark analysis demonstrated that
median survival of RBC-TD patients at 6 m was significantly lower
compared to RBC-transfusion independent ones (3.2 vs. 8.5 y; p <
0.001). Similarly, RBC-TD patients had lower OS at 12 m (3.6 vs.
9.2 y; p < 0.001), 24 m (4.8 vs. 11 y; p < 0.001) and 36 m (5.8 vs.
11.9 y; p < 0.001). Analyzing the impact of RBC-TD into three
different R-IPSS categories (very low and low vs intermediate vs
high and very high), significantly lower median survival was
observed in lower and intermediate R-IPSS categories at diagnosis
and at each landmark analysis. In contrast, RBC-TD did not impact
in survival of high and very high R-IPSS patients (Table 2).
Conclusions: Our single-centre results confirm the negative
impact on survival of TD at diagnosis and at any time during
MDS disease, especially in those classified as Very Low, Low and
Intermediate R-IPSS patients. As therapeutical decisions are based
on the initial prognostic risk assessment, the inclusion of
transfusion dependency on the risk stratification may provide
more precise prognostic information with impact on the therapeutic approach.
237
PREDICTION OF DISEASE PROGRESSION USING MUTATIONAL
SCREENING IN PATIENTS WITH MYELODYSPLASTIC SYNDROME
M. Belickova1, J. Vesela1, H. Votavova1, M. Vostry1, A. Jonasova2,
Z. Zemanova3, J. Brezinova4, J. Cermak5
1
Genomic, Institute of Hematology and Blood Transfusion, Prague,
Czech Republic; 2Ist Dept Medicine, General Hospital, Prague, Czech
Republic; 3General Hospital, Center of Oncocytogenetic, Prague, Czech
Republic; 4Cytogenetic, Institute of Hematology and Blood Transfusion,
Prague, Czech Republic; 5Clinical, Institute of Hematology and Blood
Transfusion, Prague, Czech Republic
About 90% of MDS patients carry at least one somatic mutation and
their outcome can vary widely; therefore, we focused on the
identification of specific mutations predicting disease progression.
We examined paired samples from 34 patients by TruSight Myeloid
Sequencing Panel (Illumina) containing 54 genes for determination
of mutational profile. Patients were evaluated at the time of
�Poster Presentations – 14th International Symposium on Myelodysplastic Syndromes / Leukemia Research 55 S1 (2017) S45–S167
diagnosis and during progression to more advanced MDS subtype
or to AML.
A total of 53 mutations at diagnosis and 78 mutations in
progression across 54 genes were identified in the patient cohort.
Patients in progression carried at average 2.3 mutations, three
patients harboured five mutations and only two patients had no
detectable mutation. The variant allele frequency (VAF) of mutations detected at the time of diagnosis increased during disease
progression, except of five mutations which were suppressed by
the expansion of clones carrying other mutations. Fifty-six percent
of patients carried mutations in RUNX1, TP53, PTPN11, SETB1 or
NRAS gene at the time of diagnosis and another 20% of patients
evolved these mutations in the course of disease. The median
overall survival (OS) was 30.6 months in patients with this
combination of mutations compared to 84.5 months (HR 3.1; p =
0.01) in patients without mutations. The most common acquired
mutations at the time of progression were found in PTPN11, SETB1
and NRAS genes. Overall survival did not depend on the number of
mutations detected at the time of diagnosis, but on the specific
mutated gene.
Comparison of mutational profiles of MDS patients at diagnosis and
during progression suggested candidate genes involved in AML
transformation. Our study demonstrated that mutated RUNX1,
TP53, PTPN11, SETB1 and NRAS genes were most associated with the
disease progression. Mutations in these genes were often detectable with low VAF already at the time of diagnosis and in some
patients were detectable until the time of progression. The results
indicate that routine monitoring of mutations in MDS should be
performed to refine the risk prediction of disease progression.
Acknowledgement: Supported by AZV grants (16-33485A and 1631689A) and the project for conceptual development of research
organization (00023736) from the Ministry of Health of the Czech
Republic.
(NECs). WHO-2008 recommended considering blasts from TNCs,
whereas in 2016 WHO-revision, NECs count rule was eliminated.
Recent data evidenced that considering blasts from NECs improves
outcome prediction in MDS when assessing IPSS and WHO
classification (Arenillas et al., J Clin Oncol 2016).
Aim: To evaluate whether calculating IPSS-R by enumerating blasts
from NECs improves outcome prediction in MDS-E.
Methods: We analyzed 498 de novo MDS-E diagnosed according to
WHO 2008 from the GESMD. Percentage of BM blasts from NECs
was calculated as follows: [%Blasts from TNCs/(100-% erythroblasts) × 100]. Survival analyses were performed. C-statistics for
censored data (Dxy and CPE) were implemented to assess the
method with the best predictive value for OS and time to AML
evolution.
Results: Median age was 74 y (27–94 y). Median follow-up was
54.08 months and median OS was 59.7 months. We assessed OS
and time to AML predicted by IPSS-R considering blasts from TNCs
and NECs (recoded IPSS-R). Five groups with significant differences
in OS were observed only by applying the recoded IPSS-R (Figure 1).
By using our approach, median OS of the intermediate group
improved from 28.9 to 41.2 months whereas patients classified into
higher-risk categories maintained the outcome expected in these
categories (OS <23 months). 41/448 patients (9.2%) classified into
lower-risk categories were reclassified into higher-risk ones and
showed a significantly shorter OS and time to AML (median OS,
22.6 vs 74.3 months, P < 0.001;median time to AML,74.6 vs N.R.
months, P < 0.001) (Figure 2). Likewise, 35/69 patients (51%)
classified into the intermediate group were reclassified into
higher-risk categories and showed a significantly shorter OS and
time to AML (median OS, 13.9 vs 43.7 months, P = 0.029; median
time to AML,74.6 vs N.R. months, P = 0.048). Finally, the recoded
IPSS-R showed a better capability for predicting OS and time to
AML [(survival, recoded IPSS-R vs IPSS-R: 0.374 vs 0.366, 0.654 vs
0.645; Dxy and CPE respectively) (time to AML, recoded IPSS-R vs
IPSS-R: 0.592 vs 0.536, 0.700 vs 0.673; Dxy and CPE respectively)].
238
CALCULATING IPSS-R BY ENUMERATING BONE MARROW BLASTS
FROM NONERYTHROID CELLULARITY IMPROVES OUTCOME
PREDICTION IN MDS WITH ERYTHROID PREDOMINANCE
X. Calvo1, L. Arenillas1, E. Luño2, L. Senent3, M. Arnan4, F. Ramos5,
C. Pedro6, M. Tormo7, J. Montoro8, M. Diez-Campelo9, M.L. Blanco10,
B. Arrizabalaga11, B. Xicoy12, S. Bonanad3, A. Jerez13,
M. Nomdedeu14, A. Ferrer1, G. Sanz3, L. Florensa1
1
Hospital del Mar, Laboratorio de Citología Hematológica, Barcelona,
Spain; 2Hospital Central de Asturias, Servicio Hematología, Oviedo,
Spain; 3Hospital La Fe, Servicio Hematología, Valencia, Spain; 4ICOHospitalet de Llobregat, Servicio Hematología, Hospitalet de Llobregat,
Spain; 5Hospital Universitario de León, Servicio Hematología, León,
Spain; 6Hospital del Mar, Servicio Hematología, Barcelona, Spain;
7
Hospital Clínico Universitario de Valencia, Servicio Hematología,
Valencia, Spain; 8Hospital Universitario Vall Hebron, Servicio
Hematología, Barcelona, Spain; 9Hospital Universitario Salamanca,
Servicio Hematología, Salamanca, Spain; 10Hospital de la Santa Creu i
Sant Pau, Servicio Hematología, Barcelona, Spain; 11Hospital
Universitario Cruces, Servicio Hematología, Baracaldo, Spain; 12ICOBadalona, Servicio Hematología, Badalona, Spain; 13Hospital Morales
Meseguer- IMIB-Arrixaca, Servicio Hematología, Murcia, Spain;
14
Hospital Clinic Barcelona, Servicio Hematología, Barcelona, Spain
Introduction: IPSS-R is the score with the best prognostic
capability in MDS. Some concerns have been generated about the
real prognostic significance of the intermediate risk category,
since these patients showed an outcome closer to the expected in
higher-risk. In MDS with ≥50% BM erythroblasts (MDS-E) there was
no consensus on the best method for enumerating BM blasts—from
total nucleated cells (TNCs) or from nonerythroid cellularity
S137
Fig. 1.
�
 Jaroslav Cermak