Clinical and Epidemiologic Research
The Effects of Macular Ischemia on Visual Acuity in
Diabetic Retinopathy
Dawn A. Sim,1,2 Pearse A. Keane,1,2 Javier Zarranz-Ventura,1,2,4 Simon Fung,1
Michael B. Powner,2 Elise Platteau,1,3 Catey V. Bunce,1,2 Marcus Fruttiger,2 Praveen J. Patel,1,2
Adnan Tufail,1,2 and Catherine A. Egan1
PURPOSE. To investigate the impact of diabetic macular ischemia
(DMI) on visual acuity (VA), through the analysis of novel
fluorescein angiography (FA) parameters.
METHODS. Data were retrospectively collected over a 6-month
period. DMI severity was graded using Early Treatment
Diabetic Retinopathy Study (ETDRS) protocols. Custom
software was used to quantify areas of the foveal avascular
zone (FAZ), and of capillary nonperfusion over the papillomacular nerve fiber layer bundle, and temporal macula, and
associations tested with VA.
RESULTS. A total of 488 patients with type 2 diabetes mellitus
and FAs of sufficient quality to allow detailed quantitative
analyses were included. ETDRS-DMI severity was graded as:
none, 39.7%; questionable, 18.4%; mild, 25.2%; moderate,
11.0%; and severe, 5.6%. Median FAZ areas were 0.19 mm2
(interquartile range [IQR], 0.13–0.25); 0.25 mm2 (IQR, 0.18–
0.32); 0.27 mm2 (IQR, 0.19–0.38); 0.32 mm2 (IQR, 0.25–0.54);
and 0.78 mm2 (IQR, 0.60–1.32), respectively, and were
significantly different between all grades (P < 0.002), apart
from ‘‘questionable’’ versus ‘‘mild’’ grades. Significant association of VA to FAZ area was observed only in the moderate (b
¼ 0.406, SE ¼ 0.101, P ¼ 0.001) and severe (b ¼ 0.299, SE ¼
0.108, P ¼ 0.006) subgroups, but not in milder ETDRS-DMI
grades. A strong association with VA was observed in cases
with papillomacular ischemia (b ¼ 1.123, SE ¼ 0.355, P ¼
0.005), independent of FAZ size or the presence of macular
edema.
CONCLUSIONS. Diabetic macular ischemia is associated with
reduced VA in eyes with moderate to severe ETDRS-DMI grades
of ischemia but preserved in milder grades. In addition, we
From the 1Moorfields Eye Hospital NHS Foundation Trust,
London, United Kingdom; the 2University College London, Institute
of Ophthalmology, London, United Kingdom; the 3Department of
Ophthalmology, Ghent University Hospital and Ghent University,
Ghent, Belgium; and the 4Department of Ophthalmology, Clı́nica
Universidad de Navarra, Pamplona, Navarra, Spain.
Supported by Fight For Sight UK, Grant 1987 (DAS, MF); the
Department of Health’s NIHR Biomedical Research Centre for
Ophthalmology at Moorfields Eye Hospital and UCL Institute of
Ophthalmology (PAK, PJP, CAE, DAS, AT); and a Spanish Retina and
Vitreous Society (Sociedad Española de Retina y Vı́treo, SERV) grant
(JZV).
Submitted for publication October 8, 2012; revised December
10, 2012 and January 22, 2013; accepted February 18, 2013.
Disclosure: D.A. Sim, None; P.A. Keane, None; J. ZarranzVentura, None; S. Fung, None; M.B. Powner, None; E. Platteau,
None; C.V. Bunce, None; M. Fruttiger, None; P.J. Patel, None; A.
Tufail, None; C.A. Egan, None
Corresponding author: Catherine A. Egan, Moorfields Eye
Hospital NHS Foundation Trust, 162 City Road, London EC1V 2PD,
UK; Catherine.Egan@moorfields.nhs.uk.
Investigative Ophthalmology & Visual Science, March 2013, Vol. 54, No. 3
Copyright 2013 The Association for Research in Vision and Ophthalmology, Inc.
describe the independent association of papillomacular nerve
fiber bundle ischemia with reduced VA. (Invest Ophthalmol
Vis Sci. 2013;54:2353–2360) DOI:10.1167/iovs.12-11103
D
iabetic macular ischemia (DMI) is an important cause of
visual impairment in patients with diabetic retinopathy1,2—in large part due to the devastating and irreversible
visual loss that it causes in a minority of cases.3 DMI is bestvisualized using fluorescein angiography (FA), and is characterized by enlargement and disruption of the foveal avascular
zone (FAZ), and by retinal capillary loss in other, noncontiguous areas of the macula (‘‘capillary drop-out’’).4–6 Standards
for assessment of DMI severity were first established in the
Early Treatment Diabetic Retinopathy Study (ETDRS) in the
1980s.5 Since then, numerous studies have demonstrated a link
between the presence of DMI and the loss of visual
function.3,7–10 Furthermore, other studies suggest that, in
patients receiving treatment for diabetic macular edema
(DME), the coexistence of DMI may have an adverse effect
on outcomes, or limit the benefits of treatments, regardless of
whether the treatment consists of laser photocoagulation or
intravitreal pharmacotherapies.2,11,12
Although the deleterious effects of DMI—both from clinical
studies, and from the weight of experience in clinical
practice—are well established, much remains uncertain. In
particular, the effects of DMI on visual function are ill defined,
with some patients demonstrating near normal levels of visual
acuity in the presence of profound ischemia.3 Such patients
can experience sudden and severe decreases in visual acuity
with small increases in disease severity; in most cases, the
tipping point for such changes is not obvious. In addition, the
effects of DMI on treatment outcomes remain equivocal.
Although some small studies have suggested a negative
effect,2,11,12 larger prospective studies, such as ETDRS and
the RESTORE study, have not demonstrated clear associations
between decreased treatment benefit and increased macular
ischemia.13,14 These contrasting results may be related, in part,
to the adoption in many studies of simplified DMI grading
schemes, commonly eschewing detailed quantitative analyses
of capillary loss for qualitative analysis of the FAZ.12,15 Finally,
due to the requirement of angiography for its evaluation, DMI
has not been studied in the pivotal epidemiological studies of
diabetic retinopathy.16–18 Thus, the prevalence and natural
history of this condition remains unknown.
In this report, we perform in-depth qualitative and
quantitative analyses of macular ischemia, both in the central
macula and paramacular areas, in a large cohort of patients
with type 2 diabetes mellitus. We also correlate these changes
with visual acuity in an effort to determine their visual
significance and to identify novel parameters of interest for
future clinical trials.
2353
�2354
Sim et al.
IOVS, March 2013, Vol. 54, No. 3
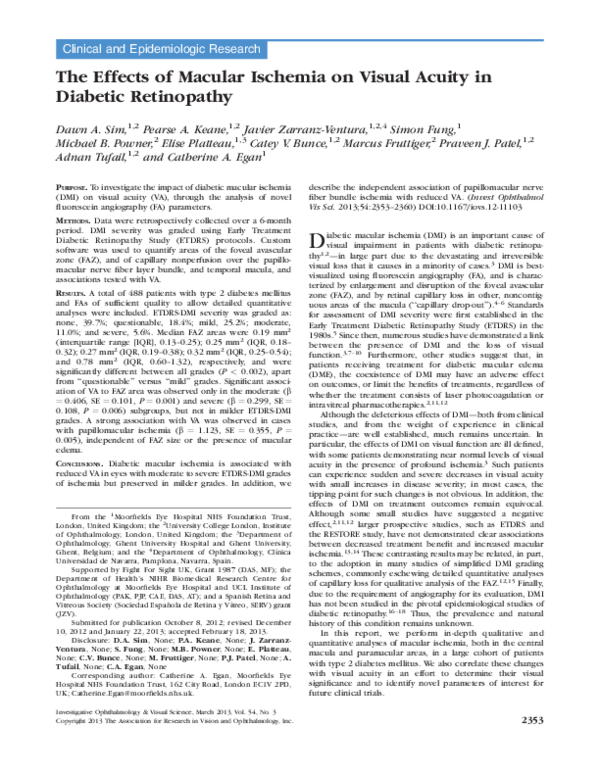
FIGURE 1. (a) An example of an early phase fundus FA image centered at the macula demonstrating papillomacular capillary dropout,
noncontiguous with the FAZ. (b) Annotated image of (a) with papillomacular ischemia highlighted in red and the enlarged FAZ highlighted in
yellow. (c) An example of an early phase FA image demonstrating temporal capillary dropout noncontiguous with the FAZ. (d) Annotated image of
(c) with temporal ischemia highlighted in green and the enlarged FAZ highlighted in yellow.
MATERIALS
AND
METHODS
Inclusion Criteria and Data Collection
Clinical and imaging data were collected retrospectively over a 6month time period, from patients attending a single consultant-led (CE)
medical retinal clinic, with a focus on diabetic eye disease. Approval for
data collection and analysis was obtained from the Moorfields Eye
Hospital research and ethics committee and adhered to the tenets set
forth in the Declaration of Helsinki.
Consecutive patients referred from the United Kingdom National
Screening Committee (UK NSC) – Diabetic Eye Screening Programme,
with a diagnosis of type 2 diabetes mellitus, who underwent an FA
within 6 months of the study period were included. (Patients with
Type 1 diabetes mellitus are being analyzed in a separate study.) Patient
demographic data, visual acuities, and retinopathy/maculopathy grades
(at the time of FA), were obtained from the UK NSC standardized
electronic reports, a grading system which has been described in more
detail elsewhere.20 Patient age at time of attendance, and presence of
ocular comorbidity, were obtained from diagnostic labels, electronic
patient records and FAs. Patients with ocular comorbidities—including
retinal arterial or venous occlusion, epiretinal membrane, neovascular
AMD, inherited macular disease, intermediate and posterior uveitis, or
macular scarring of any etiology—were excluded.
In most cases, FA images were obtained on the date of attendance
in the clinic; however, patients were also included in the study if
angiography had been performed within 6 months of the study
attendance date. In patients with bilateral disease of symmetrical
severity, a single eye was selected using permuted-block randomization
for inclusion in the study. In patients with bilateral asymmetrical
disease, the eye with the greatest degree of ischemic maculopathy was
selected.
Acquisition and Analysis of Fluorescein
Angiograms
Grading Methods for Macular Ischemia. All angiographic
images were acquired with a digital retinal camera system (Topcon
TRC 50IX; Topcon Medical Systems, Inc., Paramus, NJ). FA images
centered on the macula were chosen for optimal focus and intensity
levels, which allowed visualization of macular capillaries. No image
manipulation was performed prior to grading. Macular ischemia was
dual-graded by two masked assessors (DAS and EP) using protocols and
standard photographs from ETDRS Report No. 11.5 According to these
criteria, DMI was classified as none, questionable, mild, moderate, or
severe. In the case of disagreement between graders, open adjudication
was used to resolve the final grading decision.
Grading Methods for Temporal and Papillomacular
Ischemia. The presence of additional areas of capillary nonperfusion,
noncontiguous with the FAZ, was also noted at the time of grading,
‘‘papillomacular ischemia’’ was defined by its location within the nasal
quadrant of the ETDRS grid and/or the area of retina bordered by the
temporal edge of the optic disc and the nasal edge of the FAZ, along the
�IOVS, March 2013, Vol. 54, No. 3
Novel Angiographic Parameters for Macular Ischemia
2355
papillomacular nerve fiber raphe (Figs. 1a, 1b, 2a, 2b). ‘‘Temporal
ischemia’’ was defined as the area located one disc diameter temporal
to the central fovea and within the superior and inferior temporal
vascular arcades (Figs. 1c, 1d, 2a). The boundaries of these areas were
visualized in postmortem human eye tissue which was fixed in
paraformaldehyde 4% and the retinal nerve fiber layer immunostained
with tubulin beta III. The locations of both ‘‘PM’’ and ‘‘temporal’’ areas
were defined according to distinctive patterns of the retinal nerve fiber
layer, (illustrated in Fig. 2) and overlaid onto equivalent areas on FA
images.
Quantification of the FAZ and Other Areas of Capillary
Nonperfusion. Quantitative analysis of all images was performed
using a validated image viewer and grading software package
(‘‘GRADOR’’; Doheny Image Reading Center, Los Angeles, CA) that
facilitates planimetric measurements. Using this software, the areas of
the FAZ, and other areas of capillary nonperfusion, were assessed in
square millimeters (mm2). Temporal and papillomacular ischemia were
calculated in a similar fashion.
Statistical Analysis
Clinical and imaging data were analyzed with frequency and
descriptive statistics. Snellen visual acuities were converted to logMAR
(logarithm of the minimum angle of resolution) visual acuity for the
purposes of statistical analysis. The Mann-Whitney U test and Spearman’s correlation (q) were used to assess the relationships areas of
ischemia and visual acuity. Normality of the variables was examined
using histograms. As anticipated, distribution of visual acuity and FAZ
measurements were negatively skewed and traditional regression
analyses could not be applied to the data set. No simple transformation
of data redressed the skewness.
Multivariable quantile regression analysis was used to test for
associations between logMAR visual acuity and each of the following:
age, sex, retinopathy grade, diabetic macular edema, FAZ measurements,
and noncontiguous areas of ischemia. Quantile regression is a statistical
approach to model different sample percentiles or ‘‘quantiles’’ of an
outcome variable with respect to predictor variables, and is robust to
nonparametric distributions of data. This approach has been described
in more detail elsewhere.21 Briefly, the interpretation of quantile
regression is similar to linear regression, but where linear regression
models the mean of the outcome variable, quantile regression models
selected percentiles (e.g., the 0.50 quantile [the median, or 50th
percentile]). In this study, we analyzed the 0.10, 0.25, 0.50, 0.75, and
0.90 quantiles. This allowed the analysis of more complex relationships
between variables (such as VA), which may have unequal variation for
different ranges of another variable (e.g., FAZ). We developed models for
each DMI ischemia grade, and further adjusted for potential confounders
such as age (continuous variable); sex; retinopathy grade; and the
presence of diabetic macular edema (categorical variables). ‘‘b’’ indicates
the quantile regression coefficient and P values < 0.05 were considered
statistically significant. Statistical analysis was performed using statistical
software (R 2.15.0; http://cran.r-project.org, in the public domain), with
the addition of the ‘‘quantreg’’ package.
RESULTS
Baseline Characteristics
Electronic records of 2051 appointments were screened, and
488 patients with type 2 diabetes met the inclusion criteria. The
male to female ratio was 5:4, and mean age was 64.2 years (SD ¼
12.6). An attempt was made to grade both eyes for severity of
DMI. In 401 patients, FA images were of sufficient quality to
allow DMI grading in both eyes; in an additional 52 patients,
DMI grading was possible in a single eye only. In 35 patients, FA
images were of insufficient quality to permit grading of DMI in
either eye. Forty-six patients were then excluded due to the
FIGURE 2. (a) Tubulin beta III immunostaining of the retinal nerve
fiber layer in postmortem human eye tissue. After fixation in 4%
paraformaldehyde for 24 hours, the retina was dissected and whole
mounted for immunohistochemistry. The dotted green line delineates
the boundary for temporal ischemia, located one disc diameter
temporal to the central fovea. Solid blue lines represent one disc
diameter. Solid white scale bars equal to 0.5 mm. (b) The dotted red
line delineates the boundary for the papillomacular area where
increased density of nerve fibers/axons originating from the FAZ are
located. Solid white scale bars equal to 0.5 mm. (c) Overlay of
equivalent papillomacular boundary onto FA depicting areas of
capillary dropout.
presence of ocular comorbidities. In total, 408 eyes from 408
patients were included in the analysis. For this assessment of
DMI severity, substantial intergrader agreement was demonstrated, with a weighted kappa of 0.704. (SE ¼ 0.087, 95%
confidence interval [CI] ¼ 0.535–0.874).
Symmetry of Disease
Within the 401 patients where both eyes were gradable, 249
patients (62.1%) had bilaterally symmetrical macular ischemia.
�2356
Sim et al.
IOVS, March 2013, Vol. 54, No. 3
TABLE 1. Patient Demographics and Clinical Characteristics of Patients with and without DMI
No DMI, n ¼ 162
DMI, n ¼ 246
P Value
62 (11.4)
72/90
84/78
0.19 (0.13–0.25)
64 (12.2)
105/141
126/120
0.29 (0.20–0.42)
0.07
0.63
0.94
<0.001
Age, y, mean (SD)
Sex, n, female/male
Eye, n, right/left
FAZ area, mm2, median (IQR)
Retinopathy grades (%)*
No DR, n ¼ 44
Mild-moderate NPDR, n ¼ 139
Severe NPDR, n ¼ 67
PDR, n ¼ 158
24
75
27
36
(54.5)
(54.0)
(40.3)
(22.8)
20
64
40
122
(45.5)
(46.0)
(59.7)
(77.2)
0.83
0.85
1.48
3.39
58 (51.3)
67 (55.8)
121 (69.4)
1.05
1.44
2.24
Maculopathy grades (%)
No DME/CSME, n ¼ 113
DME, non-CSME; n ¼ 120
CSME, n ¼ 175
55 (48.7)
53 (44.2)
54 (30.6)
The difference in grade between the asymmetrical eyes was as
follows: no more than one grade in 107 patients (26.7%); two
grades in 32 (8%); three grades in 12 (3%); and four grades in 1
(0.2%). Where there was symmetrical disease, one eye was
randomized for analysis. In asymmetrical disease (154 patients
[37.9%]), the eye with the most severe DMI grade was
selected.
Prevalence of Diabetic Macular Ischemia
Overall Prevalence and Severity of Diabetic Macular
Ischemia by ETDRS-DMI Grade. In the 407 eyes analyzed,
162 eyes (39.7%) had none; 75 (18.4%) questionable; 103
(25.2%) mild; 45 (11.0%) moderate; and 23 (5.6%) had severe
ETDRS-DMI grades.
Prevalence of DMI (by ETDRS Grade) within Different
Severity Grades of Retinopathy and Maculopathy. DMI
was most prevalent in eyes with proliferative diabetic
retinopathy (PDR; 122/158 eyes [77.2%]); clinically significant
macular edema (CSME; 121/175 eyes [69.4%]); and in eyes
with DME, but without CSME (67/120 eyes [55.8%]). An
increase in the proportion of eyes with DMI in relation to eyes
with no DMI, expressed as the ‘‘DMI: No DMI’’ ratio, was seen
in patients with severe nonproliferative PDR (NPDR) and PDR,
and across all maculopathy grades (Table 1).
Increasing FAZ Area with ETDRS-DMI Severity Grades.
As expected, the median FAZ area increased with grade of
ETDRS-DMI severity. Median FAZ areas were 0.19 mm2
(interquartile range [IQR], 0.13–0.25) in ‘‘none’’; 0.25 mm2
(IQR, 0.18–0.32) in ‘‘questionable’’; 0.27 mm2 (IQR, 0.19–
0.38) in ‘‘mild’’; 0.32 mm2 (IQR, 0.25–0.54) in ‘‘moderate’’; and
0.78 mm2 (IQR: 0.60–1.32) in ‘‘severe’’ ETDRS-DMI grades.
Highly significant differences in median FAZ area were seen
across all subgroups of DMI, with the exception of ‘‘questionable’’ versus ‘‘mild’’ ETDRS-DMI grades (Table 2, Fig. 3).
Prevalence of Temporal and/or Papillomacular
Ischemia. Temporal and papillomacular areas of ischemia
were calculated using templates derived from nerve fiber layer
analysis in the postmortem human eye, and superimposed on
FA images. The median area of temporal ischemia was 3.62
mm2 (IQR, 2.10–6.66), and was present in 112/408 eyes
(27.5%), while the median area of papillomacular ischemia was
0.38 mm2 (IQR, 0.13–0.60) and was present in 34/408 eyes
(8.3%). Both temporal and papillomacular ischemia were most
prevalent in higher ETDRS-DMI grades. This was most notable
for temporal ischemia, which was present in 20/23 eyes
(87.0%) in the severe subgroup; 19/45 eyes (42.2%) in
moderate; 41/103 eyes (39.8%) in mild; 22/75 eyes (29.3%)
in questionable; and 10/162 eyes (6.2%) in none. Papillomacular ischemia was also more frequently seen with increasing
severity of ETDRS-DMI subgroups, with 8/23 eyes (34.8%) in
severe; 7/45 eyes (15.6%) in moderate; 11/103 eyes (10.7%) in
TABLE 2. Comparing Median FAZ Area (mm2) between all DMI
Subgroups
P Values
DMI
Subgroups
None
None
Questionable
Mild
Moderate
Severe
<0.001*
<0.001*
<0.001*
<0.001*
Questionable
0.18
<0.001*
<0.001*
Mild
0.002*
<0.001*
Moderate Severe
<0.001*
P values significant at 1% levels are indicated with *.
FIGURE 3. Box-plots of FAZ area (mm2) in different EDTRS grades of
DMI: none, questionable, mild, moderate, and severe. The top of the
box represents the 75th percentile, the bottom of the box represents
the 25th percentile, and the line in the middle represents the 50th
percentile. The whiskers represent the highest and lowest values that
are not outliers or extreme values. Circles beyond the whiskers
represent outliers and extreme values.
�Novel Angiographic Parameters for Macular Ischemia
IOVS, March 2013, Vol. 54, No. 3
TABLE 3. Comparing Median Visual Acuities (LogMar) between all DMI
Subgroups
P Value for VA
DMI Grade
None
Questionable
Mild
0.527
0.02*
<0.001**
0.03*
<0.001**
None
Questionable 0.651
Mild
0.143
Moderate
<0.001**
Severe
<0.001**
Moderate Severe
2357
25th, 50th, 75th, and 90th quantile regression lines (Table 5,
Fig. 4B), with a quantile regression coefficient of b ¼ 1.12 (SE ¼
0.355, P ¼ 0.005) at the 50th percentile. Thus, papillomacular
ischemia has an impact on VA independent of FAZ size. This
effect was maintained after adjusting for potential confounders
such as DME (Table 6). No relationship was observed with
temporal ischemia.
DISCUSSION
0.04*
P values significant at 5% level are indicated with * and ** at 1%
level.
mild; 3/75 eyes (4.0%) in questionable; and 0/162 eyes in
none.
Visual Significance of Macular Ischemia
Relationship between Visual Acuity and ETDRS-DMI
Severity Grade. Median logMAR visual acuity (VA) was 0.2
(IQR, 0–0.3; Snellen 20/32) in eyes with ‘‘none’’; 0.2 (IQR: 0–
0.5; Snellen 20/32) questionable; 0.2 (IQR: 0.2–0.5; Snellen 20/
32) mild; 0.5 (IQR: 0.2–0.6; Snellen 20/63) moderate; and 0.6
(IQR: 0.3–0.8; Snellen 20/80) with severe ETDRS-DMI grades.
Significant differences in VA were observed between moderate
and severe ETDRS-DMI grades compared with all other grades
(Table 3).
Relationship between FAZ Size and Visual Acuity.
Overall, we found no evidence any correlation between VA
and FAZ area (mm2) (q ¼ 0.061, P ¼ 0.219). However, when
the data were stratified by severity of ischemia, quantile
regression models revealed a statistically significant association
between VA and FAZ area (mm2) in all quantiles for eyes with
moderate and severe ETDRS-DMI grades (Table 4, Fig. 4A).
Severe DMI showed the strongest association with quantile
regression coefficient, b ¼ 0.406 (SE ¼ 0.101, P < 0.001), at
the 50th percentile. In moderate DMI, the greatest association
was also observed at the 50th percentile, b ¼ 0.299 (SE ¼
0.108, P < 0.006). The effects of FAZ area on VA on moderate
and severe ETDRS-DMI grades for different quantiles are
summarized in Table 4 and Figure 4A. No relationships were
observed between VA and FAZ area for milder grades of
ischemia.
Relationship of Temporal and Papillomacular
Ischemia with Visual Acuity. We investigated whether
papillomacular and temporal ischemia had a significant impact
on VA after adjustment for FAZ area. A higher than expected
association was observed in papillomacular ischemia at the
In this retrospective, cross-sectional study, we perform detailed
quantitative analyses of FA images obtained from a large cohort
of patients with type 2 diabetes mellitus. Using this approach,
we estimate the prevalence of DMI and, when present,
evaluate its visual significance. We also highlight novel
angiographic parameters that, if confirmed in future longitudinal studies, may be of value for monitoring of disease, both in
clinical practice and in clinical trials.
In this study, we determined the prevalence of DMI in a
cohort of patients with type 2 diabetes mellitus attending a
tertiary referral medical retina clinic (i.e., patients with some
level of diabetic retinopathy and/or maculopathy). In this
cohort, 16.6% had macular ischemic changes in the moderate
to severe range, considerably higher than previously reported.19 However, the prevalence determined in our study may
be more typical of those seen by retina specialists in routine
clinical practice, and cannot be compared with prospective
clinical trials such as ETDRS, which excluded patients with
active proliferative and severe nonproliferative diabetic
retinopathy. We also report the prevalence of DMI in
patients with different clinical grades of diabetic maculopathy and/or retinopathy. Coexisting pathology—i.e., DME and
DMI—is common in diabetic retinopathy and perhaps
unsurprisingly, some evidence of DMI was seen in 69.4% of
cases with CSME; of these, 19.4% were found to have DMI in
the moderate to severe range. Eyes with PDR (both treated
and untreated) and severe NPDR were found to have
evidence of DMI in the majority of cases (PDR: 77.2% [n ¼
122]; severe NPDR: 59.7% [n ¼ 40]). DMI, though less
commonly seen across all other grades of NPDR, was still
present in 46% of eyes (n ¼ 64) with mild to moderate
NPDR, and 45.5% of eyes (n ¼ 20) with no diabetic
retinopathy (DR) of interest. All 20 eyes (4.9% of the study
population) with no DR and concurrent DMI had some
degree of macular edema (CSME: 15 eyes; DME: 5 eyes).
Although the association between DME/CSME is well
established, it can also occur at any level of diabetic
retinopathy. However, there may be alternative explanations
for this finding: First, as the grades of DR were based on
clinical examination, there remains a possibility that mild or
nontreatable DR (such as the presence of microaneurysms
TABLE 4. Association between Visual Acuity and FAZ Area (mm2) Stratified by EDTRS DMI Severity Grades for Five Different Quantiles
10th Quantile
DMI Grade
b
SE
P Value
Questionable, n ¼ 75 0.041 0.064 0.530
Mild, n ¼ 103
0.019 0.063 0.757
Moderate, n ¼ 45
0.224 0.083 0.007**
0.326 0.083 <0.001**
Severe, n ¼ 24
25th Quantile
50th Quantile
b
SE
P Value
b
0.001
0.199
0.199
0.303
0.123
0.123
0.093
0.142
0.994
0.107
0.034*
0.034*
<0.001
0.013
0.299
0.406
SE
P Value
0.030 0.992
0.044 0.763
0.108 0.006**
0.101 <0.001**
75th Quantile
90th Quantile
b
SE
P Value
b
SE
P Value
0.097
0.110
0.257
0.359
0.142
0.081
0.099
0.118
0.497
0.177
0.009**
0.002**
0.406
0.246
0.289
0.299
0.186
0.122
0.117
0.128
0.030
0.044
0.014**
0.020*
Coefficient (b) and SE are reported for 10%, 25%, 50%, 75%, and 90%. Coefficients that are significant at 5% level are bold, and those at the 1%
level are bold and underlined. P values significant at 5% level are indicated with * and ** at 1% level. Standard errors are obtained using 1000
bootstrap replications. The DMI grade values presented adjust for age (continuous variable); sex; retinopathy grade; and the presence of macular
edema (categorical variable).
�2358
Sim et al.
IOVS, March 2013, Vol. 54, No. 3
FIGURE 4. (A) Line plot of quantile regression coefficients (vertical dotted line represents the median regression coefficient) of visual acuity with
FAZ area (mm2) in the moderate (dotted line) and severe (solid line) subgroups of DMI, after adjustment for age, sex, retinopathy grade, and the
presence of DME. (B) Line plot of quantile regression coefficients (vertical dotted line represents the median regression coefficient) of visual acuity
with papillomacular and temporal ischemia area (mm2), after adjustment for age, sex, retinopathy grade, the presence of DME and FAZ area (mm2).
associations were found for patients with moderate or severe
DMI. This relationship was particularly strong for patients
with severe DMI (Fig. 4A). Our results confirm, therefore, a
definite link between macular ischemia and visual function;
but only in the approximately 15% of patients with moderate
to severe DMI.
In this report, we also investigated a number of novel
angiographic parameters, including two regions of noncontiguous retinal capillary loss we hypothesized to be of
functional significance. Moreover, in this process, we
developed methods for standardized quantification of these
areas. First, we examined temporal ischemia: an area which
has been observed clinically to act as a driver of macular
edema, and has been previously associated with angle
neovascularization in patients with PDR.29 Secondly, we
evaluated papillomacular ischemia: an area where the
capillary network overlies and supplies the nerve fibers of
the papillomacular bundle, originating from the central
macula or fovea (Figs. 1, 2). We hypothesized that ischemia
in these locations, which contain a high density of axons
originating from the macula, may have an association with
reduction in VA. We observed a strong significant association
between papillomacular ischemia and VA, independent of the
FAZ size, and clinical covariates such as DME, suggesting that
the location of macular ischemic changes plays a critical role
in its effects on visual function.
Our study has a number of strengths, combining standardized qualitative and quantitative assessment of FA images, with
only) may have been missed. Second, the majority of these
20 eyes had either questionable or mild ETDRS-DMI grades
(questionable: 5 eyes; mild: 10 eyes; moderate: 5 eyes), the
FAZ capillaries of these eyes may represent variants of
normal, and may reflect the sensitivity of qualitative grading.
For this reason, we constructed our models that assessed the
effects of ischemia on visual acuity, based on the FAZ size
rather than the ETDRS-DMI grades alone.
Consistent with previous studies, we observed increasing
FAZ area in eyes with more severe grades of DMI.6,22–24 Some
studies have reported that the relationship between FAZ size
and DMI severity occurs from the earliest stages of NPDR,6,24
while others have observed this relationship only in more
advanced disease.25,26 This discrepancy is most likely due to
the large intersubject variability of the FAZ, ranging between
0.05 and up to 1.98 mm2 in nondiseased subjects.6,24,25,27,28 In
this study, the mean FAZ area of eyes without DMI fell on the
higher side of previously reported normal ranges, consistent
with the hypothesis that the FAZ may be affected in early
disease.
In addition to assessing the prevalence of ETDRS-defined
DMI grades, we also evaluated its visual significance. In
particular, we modeled the effects of FAZ size on VA, an area
where previous findings have been contradictory.6,22–26 On
preliminary analysis, we found no significant association
between increases in FAZ area and decreases in VA. However,
with more sophisticated modeling, with stratification by
grade of ETDRS-defined grades of DMI severity, robust
TABLE 5. Association between Visual Acuity and Area of Papillomacular or Temporal Ischemia (mm2) for Five Different Quantiles after Adjusting for
FAZ Area (mm2) as a Covariate
10th Quantile
Area of
Ischemia
b
SE
Papillomacular,
n ¼ 34
0.302 0.586
Temporal,
n ¼ 112
0.060 0.017
P Value
25th Quantile
b
SE
P Value
50th Quantile
b
SE
P Value
75th Quantile
b
SE
P Value
90th Quantile
b
SE
0.612
1.036 0.500
0.050*
1.123 0.355
0.005**
1.193 0.381
0.005**
0.383 0.547
0.001
0.051 0.015
0.002
0.056 0.026
0.039*
0.075 0.0401
0.079
0.075 0.0454
P Value
0.002**
0.110
Coefficient (b) and SE are reported for 10%, 25%, 50%, 75%, and 90%. Coefficients that are significant at 5% level are bold, and those at the 1%
level are bold and underlined. P values significant at 5% level are indicated with * and ** at 1% level. Standard errors are obtained using 1000
bootstrap replications. Area of ischemia values adjust for sex; retinopathy grade; the presence of macular edema (categorical variables); age; and FAZ
area (mm2; continuous variables).
�Novel Angiographic Parameters for Macular Ischemia
IOVS, March 2013, Vol. 54, No. 3
TABLE 6. Multivariable Median Regression between Visual Acuity and
Area of Papillomacular Ischemia (mm2) Adjusting for FAZ Area (mm2)
and Other Clinical Covariates
Papillomacular ischemia
FAZ area
Sex
Age
DME
No DME
CSME
Treated CSME
Median
Regression
Coefficient
Standard
Error
P Value
1.123
0.178
0.17
0.01
0.341
0.259
0.162
0.012
0.004**
0.501
0.291
0.401
0.193
0.310
0.106
0.271
0.485
0.252
0.485
0.530
0.679
The median regression coefficient is reported with standard errors
obtained using 1000 bootstrap replications. Coefficients that are
significant at 5% level are bold, and those at the 1% level are bold
and underlined. P values significant at 5% level are indicated with * and
** at 1% level.
a large sample size, in an area with a relative paucity of data.
We used FA grading software, equipped with standard
planimetric tools, which allowed quantification of novel
morphological parameters, and combined these measurements
with detailed statistical analysis. As anticipated, data regarding
VA and areas of ischemia were negatively skewed, with 39.7%
of patients in our cohort not having any evidence of DMI. As a
result, the application of linear regression would have a
substantial leverage on the slope of mean regression lines. Our
application of quantile regression is more robust to outliers and
allowed for an increased depth of analysis in the examination
of an inferential target, such as VA, in a given proportion of the
population. For example, patients with small or large FAZ areas
may respond differently to ischemia with corresponding
changes to visual acuity. Multivariable quantile regression
analysis also accounted for concurrent DME, a confounder of
the relationship between DMI and VA, often overlooked in
other studies.
Our study also has a number of limitations. First, the
retrospective cross-sectional nature of the work results in an
inherently biased selection of patients, particularly as patients
with more severe disease are those more likely to undergo
angiographic assessment. Despite this, our patient population
is likely representative of those seen in routine clinical
practice, and those enrolled into clinical trials. At present,
figures for the ‘‘true’’ prevalence of DMI would require FA
acquisition in population-based epidemiological studies. Such
estimates are unlikely to be derived prior to the widespread
introduction of noninvasive angiographic techniques. Secondly, we did not examine systemic parameters such as
duration of diabetes, or blood glucose control, which, as
observed in natural history studies with diabetic retinopathy,
is likely to play a role in DMI.16–18 We did however,
investigated the relationship of DMI with severity of diabetic
retinopathy and observed an increased prevalence of DMI in
both proliferative disease and macular edema. The independence of this relationship with systemic parameters will need
to be addressed in future prospective natural history studies.
Lastly, a further limitation is our reliance on Snellen visual
acuities, the limitations of which have been well documented.30,31
In summary, in patients with type 2 diabetes mellitus
attending a tertiary referral medical retina clinic, 41.8% of eyes
had evidence of DMI, while 16.6% of eyes had evidence of
moderate to severe DMI. DMI can sometimes be seen in eyes
with early retinal disease and, when present, appears
2359
symmetrical in the majority of cases. The presence of moderate
to severe DMI was also associated with impairment of visual
function. The presence of papillomacular ischemia was
particularly associated with VA reduction—this parameter
may be of particular interest for future evaluation in
prospective studies. No effective treatment currently exists
for patients with visual loss attributable to DMI—such a patient
group may be an appropriate first target for the development
of cellular therapies in diabetic retinopathy.
References
1. Klein R, Klein BE, Moss SE. Visual impairment in diabetes.
Ophthalmology. 1984;91;1–9.
2. Ticho U, Patz A. The role of capillary perfusion in the
management of diabetic macular edema. Am J Ophthalmol.
1973;76:880–886.
3. Bresnick GH, De Venecia G, Myers FL, et al. Retinal ischemia in
diabetic retinopathy. Arch Ophthalmol. 1975;93:1300–1310.
4. Bresnick GH, Condit R, Syrjala S, et al. Abnormalities of the
foveal avascular zone in diabetic retinopathy. Arch Ophthalmol. 1984;102:1286–1293.
5. Classification of diabetic retinopathy from fluorescein angiograms. ETDRS report number 11. Early Treatment Diabetic
Retinopathy Study Research Group. Ophthalmology 1991;
98(suppl 5):807–822.
6. Mansour AM, Schachat A, Bodiford G, Haymond R. Foveal
avascular zone in diabetes mellitus. Retina. 1993;13:125–128.
7. Arend O, Wolf S, Harris A, Reim M. The relationship of macular
microcirculation to visual acuity in diabetic patients. Arch
Ophthalmol. 1995;113:610–614.
8. Arend O, Remky A, Evans D, et al. Contrast sensitivity loss is
coupled with capillary dropout in patients with diabetes.
Invest Ophthalmol Vis Sci. 1997;38:1819–1824.
9. Unoki N, Nishijima K, Sakamoto A, et al. Retinal sensitivity loss
and structural disturbance in areas of capillary nonperfusion of
eyes with diabetic retinopathy. Am J Ophthalmol. 2007;144:
755–760.
10. Tyrberg M, Ponjavic V, Lovestam-Adrian M. Multifocal electroretinogram (mfERG) in patients with diabetes mellitus and an
enlarged foveal avascular zone (FAZ). Doc Ophthalmol. 2008;
117:185–189.
11. Jonas JB, Martus P, Degenring RF, et al. Predictive factors for
visual acuity after intravitreal triamcinolone treatment for
diabetic macular edema. Arch Ophthalmol. 2005;123:1338–
1343.
12. Chung EJ, Roh MI, Kwon OW, Koh HJ. Effects of macular
ischemia on the outcome of intravitreal bevacizumab therapy
for diabetic macular edema. Retina. 2008;28:957–963.
13. Focal photocoagulation treatment of diabetic macular edema.
Relationship of treatment effect to fluorescein angiographic
and other retinal characteristics at baseline: ETDRS report no.
19. Early Treatment Diabetic Retinopathy Study Research
Group. Arch Ophthalmol. 1995;113:1144–1155.
14. Mitchell P, Bandello F, Schmidt-Erfurth U, et al. The RESTORE
study: ranibizumab monotherapy or combined with laser
versus laser monotherapy for diabetic macular edema.
Ophthalmology. 2011;118:615–625.
15. Conrath J, Giorgi R, Raccah D, Ridings B. Foveal avascular zone
in diabetic retinopathy: quantitative vs qualitative assessment.
Eye. 2005;19:322–326.
16. Varma R, Torres M, Pena F, et al. Prevalence of diabetic
retinopathy in adult Latinos: the Los Angeles Latino eye study.
Ophthalmology. 2004;111:1298–1306.
17. Wong TY, Klein R, Islam FM, et al. Diabetic retinopathy in a
multi-ethnic cohort in the United States. Am J Ophthalmol.
2006;141:446–455.
�2360
Sim et al.
18. Klein R, Klein BE, Moss SE, Linton KL. The Beaver Dam Eye
Study. Retinopathy in adults with newly discovered and
previously diagnosed diabetes mellitus. Ophthalmology.
1992;99:58–62.
19. Nguyen QD, Brown DM, Marcus DM, et al. Ranibizumab for
diabetic macular edema: results from 2 phase III randomized
trials: RISE and RIDE. Ophthalmology. 2012;119:789–801.
20. Mackenzie S, Schmermer C, Charnley A, et al. SDOCT imaging
to identify macular pathology in patients diagnosed with
diabetic maculopathy by a digital photographic retinal
screening programme. PLoS One. 2011;6:e14811.
21. Hao L, Naiman DQ. Quantile Regression. Thousand Oaks, CA:
SAGE Publications, Inc.; 2007.
22. Bresnick GH, Condit R, Syrjala S, et al. Abnormalities of the
foveal avascular zone in diabetic retinopathy. Arch Ophthalmol. 1984;102:1286–1293.
23. Arend O, Wolf S, Jung F, et al. Retinal microcirculation in
patients with diabetes mellitus: dynamic and morphological
analysis of perifoveal capillary network. Br J Ophthalmol.
1991;75:514–518.
24. Conrath J, Giorgi R, Raccah D, Ridings B. Foveal avascular zone
in diabetic retinopathy: quantitative vs qualitative assessment.
Eye (Lond). 2005;19:322–326.
IOVS, March 2013, Vol. 54, No. 3
25. Sander B, Larsen M, Engler C, et al. Early changes in diabetic
retinopathy: capillary loss and blood-retina barrier permeability in relation to metabolic control. Acta Ophthalmol
(Copenh). 1994;72:553–559.
26. Hilmantel G, Applegate RA, van Heuven WA, et al. Entoptic
foveal avascular zone measurement and diabetic retinopathy.
Optom Vis Sci. 1999;76:826–831.
27. Sleightholm MA, Arnold J, Kohner EM. Diabetic retinopathy: I.
The measurement of intercapillary area in normal retinal
angiograms. J Diabet Complications. 1988;2:113–116.
28. Dubis AM, Hansen BR, Cooper RF, et al. The relationship
between the foveal avascular zone and foveal pit morphology.
Invest Ophthalmol Vis Sci. 2012;53:1628–1636.
29. Hamanaka T, Akabane N, Yajima T, et al. Retinal ischemia and
angle neovascularization in proliferative diabetic retinopathy.
Am J Ophthalmol. 2001;132:648–658.
30. Hussain B, Saleh GM, Sivaprasad S, Hammond CJ. Changing
from Snellen to LogMAR: debate or delay? Clin Exp
Ophthalmol. 2006;34:6–8.
31. Kniestedt C, Stamper RL. Visual acuity and its measurement.
Ophthalmol Clin North Am. 2003;16:155–170, v.
�
 Catherine Egan
 Pearse A Keane