Community Aware Random Walk for Network Embedding
Mohammad Mehdi Keikha1, 2, Maseud Rahgozar1, Masoud Asadpour1
Email: {mehdi.keikha, rahgozar, asadpour} @ut.ac.ir
Corresponding Author: Maseud Rahgozar
Abstract:
Social network analysis provides meaningful information about behavior of network members that can be
used for diverse applications such as classification, link prediction. However, network analysis is
computationally expensive because of feature learning for different applications. In recent years, many
researches have focused on feature learning methods in social networks. Network embedding represents
the network in a lower dimensional representation space with the same properties which presents a
compressed representation of the network. In this paper, we introduce a novel algorithm named “CARE”
for network embedding that can be used for different types of networks including weighted, directed and
complex. Current methods try to preserve local neighborhood information of nodes, whereas the proposed
method utilizes local neighborhood and community information of network nodes to cover both local and
global structure of social networks. CARE builds customized paths, which are consisted of local and
global structure of network nodes, as a basis for network embedding and uses the Skip-gram model to
learn representation vector of nodes. Subsequently, stochastic gradient descent is applied to optimize our
objective function and learn the final representation of nodes. Our method can be scalable when new
nodes are appended to network without information loss. Parallelize generation of customized random
walks is also used for speeding up CARE.
We evaluate the performance of CARE on multi label classification and link prediction tasks.
Experimental results on various networks indicate that the proposed method outperforms others in both
Micro and Macro-f1 measures for different size of training data.
Keywords:
Representation learning, Network embedding, Community detection, Skip-gram model, Link prediction.
1. Introduction:
There has been remarkable growth in online social networks and the number of their users. Valuable
information can be extracted from social networks by analyzing both their structure and content. Machine
learning techniques are used as a way to extract valuable features from social networks for different
analysis tasks such as classification [1, 2, 3], recommendation [4, 5] and link prediction [6, 7, 8, 9]. These
1
2
School of Electrical and Computer Engineering, College of Engineering, University of Tehran, Tehran, Iran
University of Sistan and Baluchestan, Zahedan, Iran
�learning methods can be both supervised and unsupervised. Supervised learning algorithms are able to
extract features better for a specific task on social networks but their scalability would be challenging for
large networks. On the other hand, unsupervised methods can handle scalability of feature learning
methods; however, the extracted features show low accuracy in different network analysis tasks. They are
too general to give valuable information for a specific task. [10, 11, 12, 13, 14, 15, 16].
Network embedding, as an unsupervised representation learning task, tries to extract informative lower
dimensional representation of network nodes. It learns social relationships of network nodes in a low
dimensional space to preserve both microscopic and macroscopic network structure including various
proximity orders, community membership and their inherent properties. These representation vectors can
be used in different social network analysis tasks such as classification [17], recommendation [18] and
link prediction [6]. Some of classic network embedding methods use eigenvectors of affinity graph as
feature vectors [10, 15, 19, 20]. Graph factorization is another technique which is used for network
embedding [21]. The aforementioned approaches suffer from scalability for large social networks.
In recent years, deep learning as an unsupervised method is widely used in natural language processing
which a detailed description of these researches can be found in [11]. There are also many researches that
have used deep learning for social network embedding [22, 23, 24, 25]. Network embedding methods try
to represent graph nodes with some informative feature vectors. DeepWalk [22], LINE [23] and
Node2vec [24] are the most important methods that are proposed in the recent years. Though, these
methods show good performance in comparison to other graph representation methods such as Spectural
clustering, but they attempt to extract only local structural information from each node, and then employ
them to learn final representation of the node. However, communities are important structural information
ignored by these methods [26].
Community structure imposes constraints in a higher structural level on the nodes’ representation. The
representation of nodes within a community should be more similar than those belonging to different
communities. Furthermore, for two nodes within a community, even if they only have weak relationship
in local structure due to the data sparsity issue, their similarities will also be strengthened by the
community structure constraint. Thus, incorporating community structure in network embedding can
provide effective and rich information to solve data sparsity issues in global structures and moreover,
make the learned nodes’ representation more discriminative [25].
In this paper, we propose a new network embedding method called “CARE," which utilizes community
information of network nodes to capture more structural information of networks. Some previous
researches tried to embed community information on nodes’ representation. For instance, Grover et al. in
[24] only consider the community members that their distance to the source nodes is less than 2.
However, in real-world networks which communities have thousands of members, Node2vec would not
be able to consider information about the nodes that their distance is more than two from the source of
random walk because Node2vec creates second order random walks. CARE can also produce the
representation vector of nodes for arbitrary type of networks such as weighted, complex and directed.
CARE, firstly, extracts communities of the input network. We prepare this information with the Louvain
method [27] which has effective performance on different social networks. To learn final representations,
we generate some community aware random walks that consider both first and higher order proximities as
well as community membership information for each node. The customized paths contain the nodes that
are in the same neighborhood structure as well as nodes that belong to the same community. CARE
makes several customized paths for each network node to embed different structural information into final
�representation. Finally, the customized random walks are used as contextual information to learn final
representation of nodes by the Skip-gram learning model.
CARE is evaluated with two social network analysis tasks: multi label classification and link prediction.
The experimental results show that CARE outperforms Node2vec with a gain of 50% on multi label
classification with BlogCatalog dataset and 3% on the link prediction task for PPI dataset.
To summarize, we make the following contributions:
-
-
-
We present a novel network embedding algorithm named CARE that learns the representation of
nodes for different types of networks such as: weighted, directed and complex networks.
Our method can preserve community information of the network in the learned representation vectors
while the previous researches are not able to define an optimization function considering this
information explicitly.
CARE preserves all properties of the network structure through the generation of customized paths
for each node, independently. Therefore, it spends less time to learn final representations of nodes
because of parallel path generation.
We empirically evaluate the algorithm on multi label classification and link prediction problems with
different real world social networks. The experimental results indicate the efficiency of CARE in
contrast to other network embedding methods.
The rest of paper is organized as follows: In section 2, we summarize related works to network
embedding. We explain details of CARE in section 3. Section 4 outlines the experimental results on two
network analysis tasks. Finally, Section 5 presents conclusion and future works.
2. Related Works:
In this section, we review recent researches related to unsupervised representation learning of network
nodes. Some feature learning approaches use adjacency matrix of the network and try to preserve the first
order proximity of nodes. These researches act as dimension reduction methods and find the best
eigenvectors of network matrices [10, 15, 16, 19, 20, 21, 28] to use as the feature vector of networks.
Eigenvector decomposition is usually computationally expensive. Furthermore, they only consider
immediate neighborhood of nodes and do not use higher order proximities and community information.
So, they are unable to preserve the global structure of networks. As a result, the learned representations
would not provide an appropriate performance on diverse network analysis tasks.
In recent years, deep learning is used as an alternative to learn feature vector of network nodes. These
methods have utilized deep learning to learn representation vectors. They generate random walks with
different graph exploration strategies and have embedded them as contextual information into the Skipgram model. DeepWalk was the first method that used the Skip-gram model [22]. It treats DFS like
search strategy to generate random walk. Despite the good performance on multi label classification, this
method failed to preserve global network structure because it does not consider community information of
network nodes. LINE uses first and second order proximities to learn nodes’ representation, but it also
preserves local information of the networks [23]. The authors in [23] define two independent functions for
first and second order proximities but they ignore community information. LINE and DeepWalk also fail
to learn representation vector for network edges.
�Node2Vec makes random walks based on DFS and BFS like strategies [24]. While Node2vec uses two
controlled parameters to consider both homophily [29] and structural equivalences [30] of networks, it
does not guarantee to reach different nodes of a community. The main reason for this problem is that
these algorithms only consider second order proximities and cannot reach the nodes that their distance is
more than 2 from the start node of random walk. Because in real networks, there are many nodes in a
community and obviously their distance is greater than two, thus Node2vec would not consider all the
community members during creation of random walks for a node. SDNE proposes a semi-supervised
deep model, which has multiple layers of non-linear functions, thereby being able to capture the highly
non-linear network structure [31]. It exploits the first and second-order proximity jointly to preserve the
network structure, but it doesn’t use community information.
The proposed method in [25] uses modularized non negative matrix factorization to preserve both
microscopic and macroscopic information of networks. The authors in [25] define two independent model
to embed local and community information independently and then optimize the joint function to learn
the representation of nodes. They learn local and community structure separately. Consequently, they
combine the final representations. Their final representation is not general enough to be used in different
network analysis tasks because It also has some local structure information loss because it combines first
and second order proximities in a unified matrix. Unification of matrices leads to missing information
about different proximities during representation learning. Their method also suffers from scalability
when the networks are large because they should learn many parameters to preserve local and global
structures, thus it is not applicable on real social networks.
Unlike previous researches, we employed a mixture of BFS and DFS like strategies alongside community
information of network nodes without any restriction of search length over search space. We preserve
both local and global information because we use first and higher order proximities as well as community
information of nodes to learn nodes’ representations.
3. CARE: Community Aware Random Walk for Network Embedding
Community information is one of the key features of social networks, which preserves the global structure
of the network [26]. However, it is ignored by the most previous researches in network embedding when
they want to gather information about network nodes. We present a new algorithm to embed graph
structure alongside community information into the learned representation vectors of network nodes.
Therefore, we redefine network embedding as a maximum likelihood problem which is gained by global
network structures. Suppose G = (V, E) is an (un) directed graph which V and E are set of graph nodes
and edges. We are going to find a mapping function f: V Rd which d is the representation size of each
graph node. To obtain the best mapping function f, the Skip-gram model is used [32, 33].
In CARE, first neighborhood structure for each node is extracted from the given network using
community aware random walk strategy. Subsequently, by using the Skip-gram model, the representation
vector of the node is learned from these generated random walks. Most of the previous approaches for
modeling neighborhood structure of a node have only used the first and the second order proximities. In
contrast, we use the nodes that may not have an immediate connection or second order proximity with the
source node. However, they have a homophily relationship which is not presented by the first and the
second order proximities.
Once different neighborhood structures are extracted for all nodes, we use the Skip-gram model similar to
[24] to maximize N(u); where N(u) contains the neighborhood structure of a node u. The Skip-gram
�model learns the best representation vector for the node u based on the structural information contained in
N(u). In the following, we explain how we create neighborhood structure and how they are used to learn
social representations of a node in the given network. Algorithm 1 illustrates the steps of CARE
algorithm.
Algorithm 1: CARE (G, 𝑤, d, µ, Ɩ)
Input:
Graph G (V, E)
Window length 𝑤
Representation size d
Number of random walks per node µ
Random walk max length Ɩ
Output:
Matrix of node representations 𝑓 ϵ ꓣ|v| × d
1: Com = CommunityDetection (G)
2: sample 𝑓 from ꓴ|v| × d
3: while (i < µ)
4:
S = shuffle (V)
5:
for each vi ϵ S do
6:
7:
8:
𝒲𝑣𝑖 = CommunityawareRW ( G, vi , Com, Ɩ )
SkipGram (𝑓, 𝒲𝑣𝑖 , 𝑤)
end for
9: end while
In algorithm 1, Line 1 detects the communities of the given graph G. The Louvain method is used for
detecting communities, which is explained in section 3.1. Before we learn the optimal representation
vectors for graph nodes, we generate the matrix U randomly to initialize the representation vector of
nodes in line 2. Now we are able to learn final representation vectors in lines 3-9 of Algorithm 1. For each
node in V, it is generated µ different customized random walks to better capture the global and local
structure of the node in line 4. Before iterating over network nodes, they are shuffled to avoid the effect of
nodes visiting order in the final representations. The core of the presented method for network embedding
is line 6 where we generate customized random walks for the chosen node which would be clarified in
section 3.2. Finally, the generated paths are used to update node representation in line 7. In the following
sections, different functions of Algorithm 1 are explained in more details.
3.1. Community Detection:
�We have used the Louvain method to maximize modularity in the network to detect communities [27].
Modularity is a metric to compare the density of edges that are inside a community to the edges between
communities. It is an optimization algorithm that firstly considers each node in a separate community.
Subsequently, a node is chosen and the modularity of joining the node to the neighbors’ communities are
calculated. It finally assigns the node to the community, in which the modularity is maximized.
Modularity in the network is calculated using the following formula:
𝑄=
1
2𝑚
∑𝑖𝑗[𝐴𝑖𝑗 −
𝑘𝑖 𝑘𝑗
2𝑚
] 𝛿 (𝑐𝑖 . 𝑐𝑗 )
(1)
In Eq. 1, m stands for sum of all edge weights in the graph. 𝐴𝑖𝑗 denotes the edge weight between nodes i
and j. Summation of edge weights of i and j are represented by 𝑘𝑖 . 𝑘𝑗 . The communities of i and j are
shown by 𝑐𝑖 and 𝑐𝑗 . Finally 𝛿 is a delta function that returned 1 when communities are equal.
As the modularity maximization problem is intractable, we have first used a heuristic version of the
Louvain method to find communities, then each small community is considered as a node in a new
network, and we try to maximize the modularity with the new network [27].
3.2. Generation of neighborhood structure:
To extract neighborhood structure of a node, we build µ customized random walks. A customized random
walk that starts from node v is shown by 𝒲v. Since a random walk is a path in the given network; we can
denote a customized random walk for node v with some random variables 𝒲v1 , 𝒲v2 , … , 𝒲v𝑘 such that
𝒲v𝑘+1 is a node selected at random from immediate neighbors or the nodes that are in a same community
with k-th node of the path.
To create a customized random walk started from node v, we first extract all of its immediate neighbors.
Then a random variable r between 0 and 1 is generated. If r is less than α, we pick a node at random from
the immediate neighbors; otherwise, we choose a node from the nodes that are in the same community
with k-th node of 𝒲v as it is shown in Eq.2.
𝑖𝑚𝑚𝑒𝑑𝑖𝑎𝑡𝑒 𝑛𝑒𝑖𝑔ℎ𝑏𝑜𝑟𝑠
𝒲v𝑘+1 = {𝑛𝑜𝑑𝑒𝑠 𝑖𝑛 𝑐𝑜𝑚𝑚𝑢𝑛𝑖𝑡𝑦 𝑜𝑓 𝑘−𝑡ℎ 𝑛𝑜𝑑𝑒
0<𝑟≤ 𝛼
𝛼<𝑟<1
(2)
If k-th node of 𝒲v be a member of several communities, we first extract all the members of these
communities. Then we choose one of them, randomly.
This process is continued until it reaches a predefined length Ɩ for the path. Furthermore, if a node in the
path has no new neighbor, we stop expanding the path. Algorithm 2 explains the details of forming
customized random walks in CARE.
Algorithm 2: CommunityawareRW ( G, 𝑣𝑖 , Com𝑣𝑖 , Ɩ , α)
Input:
Graph G (V, E)
Source node of RW 𝑣𝑖
Nodes belong to the same community with 𝑣𝑖 Com𝑣𝑖
Random walk max length Ɩ
�Random variable to select from neighbors or same community members α
Output:
A path with max length Ɩ
1: initialize RW with 𝑣𝑖
2: while length(path) < Ɩ
3:
if current node has neighbors
if (random (0, 1) < α)
4:
5:
6:
else
select 𝑣𝑗 at random from members of 𝑣𝑖 ′𝑠 communities
7:
8:
else
9:
select 𝑣𝑗 at random from 𝑣𝑖 ′𝑠 neighbors
backtrack in the path and select the last node which has neighbors
that are not in the path
10: end while
The proposed random walk generator extracts local and global information from the given network. In
addition, we can parallelize the algorithm to speed up the process of network embedding. This is because
the customized random walks are made independently from each other. Additionally, if some new nodes
are added to (removed from) the network, their biased random walks are generated without the need to
obtain new customized random walks for previous nodes.
3.3. Skip-Gram:
According to Algorithm 1, after generation of random walks, we use the Skip-gram model to learn
representation of graph nodes [32, 33]. The Skip-gram is a language model that maximizes conditional
probability of words’ co-occurrence in a predefined window 𝑤 as it is shown in Eq.3:
Pr(𝑤 | 𝑓(𝑢)) = max ∏𝑖+𝑤
𝑗=𝑖−𝑤 Pr( 𝑣𝑗 |𝑓(𝑢) )
𝑓
𝑗≠ 𝑖
𝑤 = {𝑣𝑖−𝑤 ¸ … ¸ 𝑣𝑖+𝑤 }\𝑢
(3)
For each node in the given network, we iterate over all its customized paths. We define a window 𝑤 to
slide over a path. Similar to the previous approaches, the independence assumption of conditional
probabilities is considered in Eq. 3. Additionally, Softmax function is used to approximate the probability
distribution of Eq. 3 as the following in Eq. 4:
Pr(𝑣𝑗 | 𝑓(𝑢)) = 1 ⁄ ( 1 + 𝑒 −𝑓(𝑢).𝑓(𝑣𝑗 ) )
(4)
�Furthermore, Stochastic gradient descent (SGD) is used to optimize the parameters similar to the
proposed method in [34]. In the beginning of the training, the learning rate is 2.5%, and it decreases
linearly with the number of vertices that are seen so far as stated in [22].
For complex networks, we consider different edges of two nodes independently. If there are more edges
between nodes in the given network, it is more probable to choose these nodes along the path. If the given
network is weighted, we consider weights of edges as a probability to pick the edges when producing
customized random walks.
In large scale networks, CARE prepared different communities with the Louvain method in parallel
settings. The customized paths are obtained by multiple threads simultaneously, since the path generation
for each node is done independently.
Our algorithm is also scalable when some new nodes are appended to (removed from) the network.
Customized random walks are only generated for new nodes, and their representation vectors are
calculated as stated above. We are able to generate the customized random walks in parallel to increase
the speed of CARE. The time complexity of CARE is the same as the Skip-gram model. When the
community detection and path generation phases are finished, the representation learning of nodes is
started. The biggest time complexity among these phases corresponds to node representation learning of
the Skip-gram model.
4. Experiments:
In this section, we evaluate CARE with two supervised learning tasks: multi label classification and link
prediction. We also analyze the effect of different parameters. We compare our results on the
aforementioned tasks with the best representation learning methods, which are explained in section 4.1.
4.1. Baseline Algorithms:
To evaluate the performance of the proposed algorithm, we compare it with the following representation
learning algorithms that have the best results on multi label classification and link prediction tasks:
-
-
-
-
-
Spectral clustering [28]: This algorithm attempts to find graph cuts that lead to better classification
of the graph. Therefore, it first calculates the normalized Laplacian matrix of the graph G. Then, it
considers the d-smallest eigenvectors of the matrix as the best feature vector to represent graph nodes.
DeepWalk [22]: DeepWalk is the first algorithm that uses deep learning for social network
embedding. It generates random walks to learn representation vector of the nodes. DeepWalk could
be considered as a variant of CARE with α = 0 in algorithm 2.
LINE [23]: LINE uses local information, including first and second order proximities of nodes
instead of generating random walks. It, firstly, defines two separate functions to preserve immediate
relations and second order proximities in a social network. In the second stage, two functions are
combined linearly to calculate the final representation of each node.
Node2vec [24]: Node2vec is a semi supervised algorithm that generates a second order random walk
to capture network neighborhood information of nodes. It uses two parameters to simulate BFS and
DFS search strategies.
M-NMF [25]: This algorithm learns final representation of nodes using two independent functions
that generate two matrices. The first matrix keeps information about the local structure of network,
including the first and second order proximities, while the second matrix contains the representation
of network communities. Finally, the Non negative matrix factorization is used to preserve all the
network structural information.
�Parameter settings: To compare our results with the above algorithms, we have used the same parameter
settings that are reported in [24] for all the algorithms. We set 𝑤= 10, d= 128, µ= 10, Ɩ=80. The optimal
value for α is 0.2. We have employed the same datasets and experimental procedure as [24]. The best
values for p and q in Node2vec algorithm are chosen from {0:25, 0:5, 1, 2, 4} as stated in [24].
4.2. Multi label classification:
In the multi label classification task, we predict one or more label for each network node. To compare our
algorithm with baseline algorithms, we evaluate the methods with the following datasets:
BlogCatalog [35]: This is a social network of bloggers in which, the node’s labels are topic categories
generated by each blogger. It has 10312 nodes and 333983 edges and 39 different topic labels.
Protein-Protein Interactions (PPI) [36]: This is a subgraph of Homo Sapiens PPI network which is
preprocessed in [24], including 3890 nodes, 76584 edges and 50 labels which are extracted from gene
sets.
Wikipedia [37]: It is a co-occurrence words’ network of Wikipedia’s articles that has 4777 nodes,
184812 edges and 40 different labels. The labels of nodes are part of speech (POS) tags of network nodes.
Table 1 summarizes statistics of datasets that are used in the multi label classification task.
|V|
|E|
Labels
BlogCatalog
10312
333983
39
Protein-Protein Interactions (PPI)
3890
76584
50
Wikipedia
4777
184812
40
Table 1 datasets that used in multi label classification
To learn a classifier, we use a fraction of the learned representations along with their labels as training set.
The rest of the nodes’ representations are used to evaluate the performance of all algorithms in multi label
classification. The regression classifier is used to predict the nodes’ labels of the test set.
4.2.1. Experimental Results:
In the experiments, the training size of input datasets is increased from 10% to 90%. Micro and Macro-f1
measures are applied to evaluate performance of different algorithms [31]. Micro-f1 considers equal
weights to each data instance, while Macro-f1 is a metric which gives equal weights to each class. They
are defined as follows:
𝑃𝑟𝑒𝑐𝑖𝑠𝑖𝑜𝑛 =
𝑅𝑒𝑐𝑎𝑙𝑙 =
∑𝐴 𝜖 𝐶 𝑇𝑃 (𝐴)
∑𝐴 𝜖 𝐶 (𝑇𝑃(𝐴) + 𝐹𝑃(𝐴))
(5)
2 ∗ 𝑃𝑟𝑒𝑐𝑖𝑠𝑖𝑜𝑛 ∗ 𝑅𝑒𝑐𝑎𝑙𝑙
𝑃𝑟𝑒𝑐𝑖𝑠𝑖𝑜𝑛 + 𝑅𝑒𝑐𝑎𝑙𝑙
(7)
∑𝐴 𝜖 𝐶 𝑇𝑃 (𝐴)
∑𝐴 𝜖 𝐶(𝑇𝑃(𝐴) + 𝐹𝑁(𝐴))
𝑀𝑖𝑐𝑟𝑜 − 𝑓1 =
(6)
�𝑀𝑎𝑐𝑟𝑜 − 𝑓1 =
∑𝐴 𝜖 𝐶 𝑀𝑖𝑐𝑟𝑜 − 𝑓1 (𝐴)
|𝐶|
(8)
In aforementioned formulas, TP(A), FP(A) and FN(A) are the number of true positives, false positives
and false negatives in the instances which are predicted as A, respectively. Suppose C is the overall label
set. Micro-f1(A) is the Micro-f1 measure for the label A.
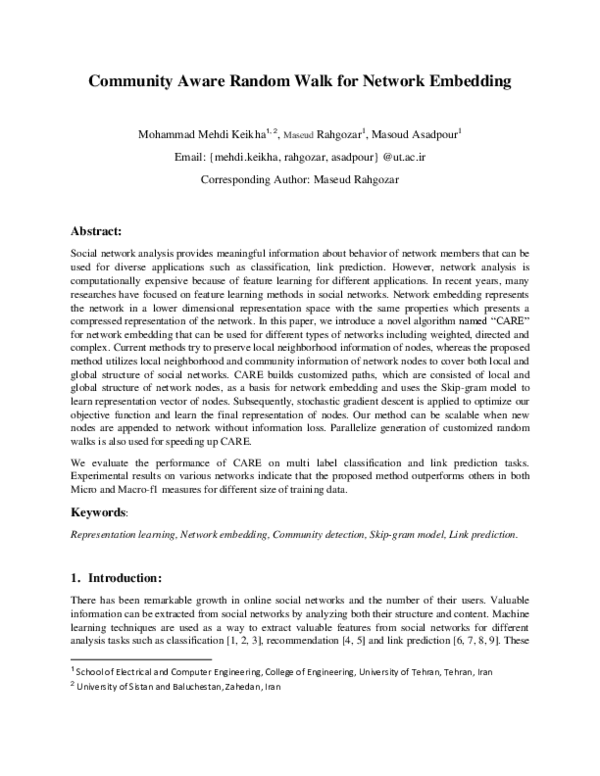
Figure 1 shows the performance of CARE in comparison to the other methods for multi label
classification task over different networks. In the following, we discuss the experimental results for each
dataset.
-
BlogCatalog:
For BlogCatalog dataset, our method shows significant improvements over both Micro and Macro-f1.
When there are only 10% training data, CARE achieves a gain of 50% over Node2vec. In this condition,
both LINE and Spectral clustering show poor performance because they only use local neighborhood
information. M-NMF does not also provide good performance than deep learning based methods because
it combines first and second order proximity in a unified matrix. Thus, network sparsity cannot be
handled by these algorithms. This property would be useful, especially in sparse networks. The most
important difference between CARE and the other algorithms is the usage of community information
during path generation. As a result, we will be able to maintain both local and global structural
information of the network when learning the representation vector of each node.
-
PPI:
As the results shows in figure 1, both evaluation metrics have less value than BlogCatalog network
because PPI network has lower density in comparison to BlogCatalog. CARE has significant
improvements over Node2vec, DeepWalk and Community preserving methods. When training data is
50%, our method outperforms about 50 % over Node2vec because we utilize community membership
information during nodes’ representation learning. M-NMF also gives weak results in the dataset because
it suffers from local structure information loss as discussed in section 2.
-
Wikipedia:
As another evaluation, we test CARE on the co-occurrence word network of Wikipedia’s articles. The
results of experiments show CARE outperformed baseline algorithms, considering both Micro and
Macro-f1. When training data size reaches 80%, our method achieved the highest improvements of 7%
over Node2vec. Wikipedia dataset is denser than the other datasets. So, M-NMF cannot predict nodes’
labels because it may not preserve local information directly during the learning of nodes’ representation.
�60.00
60.00
50.00
50.00
40.00
Macro-f1
40.00
30.00
20.00
30.00
20.00
10.00
10.00
90%
80%
70%
60%
70%
80%
90%
70%
80%
90%
60%
50%
Training size
Training size
35.00
60.00
30.00
55.00
25.00
Macro-f1
65.00
50.00
45.00
20.00
15.00
Training size
60%
50%
40%
30%
10%
90%
80%
70%
60%
50%
40%
30%
35.00
20%
5.00
20%
10.00
40.00
10%
Micro-f1
40%
30%
20%
10%
45.00
40.00
35.00
30.00
25.00
20.00
15.00
10.00
5.00
-
90%
80%
70%
60%
50%
40%
30%
20%
Macro-f1
45.00
40.00
35.00
30.00
25.00
20.00
15.00
10.00
5.00
10%
Micro-f1
PPI
50%
Training size
Training size
Wikipedia
40%
10%
90%
80%
70%
60%
50%
40%
30%
20%
10%
30%
-
-
20%
Micro-f1
Blog Catalog
70.00
Training size
Figure 1 Micro and Macro-f1 scores on Multi label classification task
As it has shown in figure 1, when the network is sparse, there is less local information for nodes and as a
result, most networks embedding methods cannot perform the multi label classification task well. The
average Micro and Macro-f1 measures for different datasets are also reported in Table 2.
BlogCatalog
Algorithm
Micro-f1
Macro-f1
PPI
Micro-f1
WikiPedia
Macro-f1
Micro-f1
Macro-f1
�CARE
Node2vec
DeepWalk
M-NMF
60.69
39.98
37.94
35.2
44.09
25.61
20.70
17.66
37.55
19.86
19.77
18.14
34.21
17.37
17.23
12.86
59.33
55.88
51.14
46.17
20.30
16.42
13.80
10.31
LINE
22.27
19.57
8.15
4.45
19.19
14.31
13.68
7.61
49.87
40.12
12.63
4.28
Spectural Clustering
Table 2 Average Micro and Macro-f1 for different datasets
4.2.2. Parameter sensitivity:
In this experiment, the best parameter values for CARE are found on BlogCatalog in the multi label
classification task. In each experiment, we consider default values for all the parameters and change only
one parameter. We also pick 50% of the input network as training set. One of the most important
parameters of our method is α. Figure 2(a) shows the best value of α while other parameters set to default
values. The effect of different size of representation vector is illustrated in figure 2(b). When Micro-f1
reaches to 128, the curve is saturated. Of course, as it stated in [22], µ and 𝑤 can also affect on
representation size.
We have shown the optimal value of µ in figure 2(c). When the number of walks for a node is increased,
we are able to gather more information about that node. This would lead to more coverage of nodes’
neighborhood. Although, after the number of walks reaches 40, the curve is saturated for BlogCatalog and
there is no difference in Micro-f1 when we increase µ more than 40.
80%
60%
60%
Micro-f1
80%
40%
20%
40%
20%
0%
α
(a) Effect of parameter α on CARE
0.9
0.8
0.7
0.6
0.5
0.4
0.3
0.2
0.1
0%
0
Micro-f1
The Skip-gram model uses a window to extract the relationship of words that are close to each other in a
document. We use the same window to relate the nodes that are located in a path. As figure 2(d) indicates,
by increasing 𝑤, less local information about the nodes in 𝑤 would be embedded into the representation
vector. Therefore, the performance of CARE is decreased.
32
64 100 128 200 300 400 500
d
(b) Effect of different dimensions on CARE
�Micro-f1
Micro-f1
0.8
0.7
0.6
0.5
0.4
0.3
0.2
0.1
0
10
20
40
80
120
0.7
0.6
0.5
0.4
0.3
0.2
0.1
0
8
160
10
12
14
16
18
20
𝑤
µ
(c) Effect of µ on CARE
(d) Effect of window size on CARE
Figure 2 effect of different parameters on CARE performance
4.3. Link Prediction:
Link prediction task is a supervised learning problem that attempts to detect some future edges of the
given network. We removed 50% of network edges at random to evaluate performance of CARE in link
prediction. In contrast to Node2vec, we don’t consider connectivity of the remained network after each
edge removal. Node2vec depends on the connectivity of network. Thus, it fails to detect edges of leaf
nodes in the given network. While CARE is able to detect leaf nodes’ neighborhood structures using
community information of them that are embedded in their representation vector though their edge was
removed.
Since representation learning algorithms only generate the feature vector for each node separately, similar
to [24], we also extend our algorithm by different operators to produce an edge representation for edge (u,
v) such that the learned representation has the same size of the representation vectors of source and
destination nodes on the edge. The operators which are considered by CARE, are defined by the
following formulas [24]:
𝐻𝑎𝑑𝑎𝑚𝑎𝑟𝑑:
𝐴𝑣𝑒𝑟𝑎𝑔𝑒:
[𝑓(𝑢) ⊡ 𝑓(𝑣)]𝑖 = 𝑓(𝑢)𝑖 ∗ 𝑓(𝑣)𝑖
[𝑓(𝑢) ⊞ 𝑓(𝑣)]𝑖 =
𝑊𝑒𝑖𝑔ℎ𝑡𝑒𝑑 − 𝐿1:
𝑊𝑒𝑖𝑔ℎ𝑡𝑒𝑑 − 𝐿2:
(9)
𝑓(𝑢)𝑖 + 𝑓(𝑣)𝑖
2
(10)
||𝑓(𝑢) ⋅ 𝑓(𝑣)||1𝑖 = |𝑓(𝑢)𝑖 − 𝑓(𝑣)𝑖 |
(11)
||𝑓(𝑢) ⋅ 𝑓(𝑣)||2𝑖 = |𝑓(𝑢)𝑖 − 𝑓(𝑣)𝑖 | 2
(12)
In the above formulas, 𝑓(𝑢)𝑖 . 𝑓(𝑣)𝑖 are the ith features of 𝑢 and 𝑣 respectively, that are learned by the
representation methods.
We confirm performance of our method in comparison to other algorithms on the datasets which their
statistics are presented in Table 3.
|V|
|E|
PPI [37]
19706
390633
arXiv ASTRO-PH [38]
18772
198110
�Table 3 datasets that used for link prediction
To learn a classifier for link prediction, we choose different training sets at random from the existing links
of the network as positive edge set. We also provide negative edge set with the same size of positive edge
set that contain edges that are not in the network. Then, we evaluate different algorithms with the
remaining links of the network. Regression classifier is used to predict different existing and non-existing
links of the network.
4.3.1. Experimental results:
The AUC_ROC score of our algorithm is reported in Table 4. For the link prediction task, the best value
for α is 0.15. We have compared CARE with previous heuristic methods for the link prediction task [24].
These scores consider the number of shared immediate neighbors of nodes in different conditions as the
score for each edge. Comparing the performance of CARE with heuristic methods showed about 14%
improvement on arXiv dataset.
We also compare the performance of our algorithm with some representation learning algorithms, which
are introduced in 4.1. Our method shows 3% gains over Node2vec algorithm on PPI dataset.
Algorithm
arXiv
PPI
Pref. attachments
0.6996
0.6670
Jaccard’s Coefficient
0.8067
0.7018
Common neighbors
0.8153
0.7142
Adamic-Adar
0.8315
0.7126
Spectral Clustering
0.5470
0.4920
M-NMF
0.9028
0.7318
LINE
0.8902
0.7249
DeepWalk
0.9340
0.7441
Node2vec
0.9366
0.7719
CARE
0.9473
0.7966
Table 4 AUC score for different methods on link prediction (All values except for CARE come from [24] )
Our method shows improvements on both datasets in comparison to Node2vec and DeepWalk that have
the best results in representation learning algorithms. DeepWalk and Node2vec generate walks randomly
and there is no information about community of nodes. Although, Node2vec attempts to consider
homophily property using two controlled parameters, but these parameters unable to guarantee to preserve
community information of nodes in a biased random walk. In contrast to Node2vec, CARE embeds this
information into a customized random walk while we jump with probability of α to the nodes that are in
the same community with the last node along the path.
We also investigate the effectiveness of different operators for obtaining the edges representation. The
results for different operators are shown in Figure 3.
�0.96
0.94
ROC_AUC
0.92
0.9
0.88
0.86
0.84
0.82
0.8
Hadamard Weighted-L1 Weighted-L2
Average
Figure 3 – AUC_ROC Score for different operators
As it is illustrated in Figure 3, Hadamard operator is the best choice for CARE on the link prediction task.
5. Conclusion:
In this paper, we have presented a novel algorithm for network embedding called CARE. To learn the
representation vector of nodes, we generate some customized random walks as contextual information. In
contrast to previous researches on network embedding methods, we consider both global and local
neighborhood of nodes while creating paths. The Skip-gram model is used in CARE to learn the final
representations of nodes. Our algorithm can embed different types of networks. The proposed method is
robust to nodes addition and removal. It is scalable because it is able to generate and process customized
random walks for different nodes in parallel. We have evaluated CARE on multi label classification and
link prediction tasks. Experimental results on different networks show significant improvements
compared to the state-of-the-art methods on network embedding.
As a part of future works, we plan to create customized random walks while we compute communities of
input network to speed up CARE. We would also like to extend the proposed method to heterogeneous
networks with different types of nodes and relations. In real-world networks, nodes might be in multiple
communities and as another research direction; we would like to investigate the effect of various
community detection algorithms such as overlapping community detection on real-world social networks
using CARE. We also plan to investigate the effect of community aware random walks on Node2vec and
LINE algorithms.
6. References:
[1] L. Getoor, B. Taskar, Introduction to statistical relational learning, MIT press, 2007.
[2] P. Sen, G. Namata, M. Bilgic, L. Getoor, B. Galligher, T. Eliassi-Rad, Collective classification in network data,
AI magazine, 29(3): 93-106, 2008.
[3] G. Tsoumakas, I. Katakis, Multi-label classification: An overview, Dept. of Informatics, Aristotle University of
Thessaloniki, Greece, 2006.
�[4] L. Backstrom, J. Leskovec, Supervised random walks: predicting and recommending links in social networks, In WSDM,
2011.
[5] F. Fouss, A. Pirotte, J. M. Renders, M. Saerens, Random-walk computation of similarities between nodes of a graph with
application to collaborative recommendation, IEEE Trans. on Knowledge and Data Engineering, 19(3):355-369, 2007.
[6] D. Liben-Nowell, J. Kleinberg, The link-prediction problem for social networks, J. of the American society for
information science and technology, 58(7):1019–1031, 2007.
[7] P. Radivojac, W. T. Clark, T. R. Oron, A. M. Schnoes, T. Wittkop, A. Sokolov, K. Graim, C. Funk, Verspoor, et al,
A large-scale evaluation of computational protein function prediction, Nature methods, 10(3):221–227, 2013.
[8] A. Vazquez, A. Flammini, A. Maritan, A. Vespignani, Global protein function prediction from protein-protein
interaction networks, Nature biotechnology, 21(6):697–700, 2003.
[9] S.-H. Yang, B. Long, A. Smola, N. Sadagopan, Z. Zheng, H. Zha, Like alike: joint friendship and interest
propagation in social networks, In WWW, 2011.
[10] M. Belkin, P. Niyogi, Laplacian eigenmaps and spectral techniques for embedding and clustering, In NIPS, 2001.
[11] Y. Bengio, A. Courville, P. Vincent, Representation learning: A review and new perspectives, IEEE TPAMI,
35(8):1798–1828, 2013.
[12] T. Mikolov, K. Chen, G. Corrado, J. Dean, Efficient estimation of word representations in vector space, In ICLR, 2013.
[13] J. Pennington, R. Socher, C. D. Manning, GloVe: Global vectors for word representation, In EMNLP, 2014.
[14] S. T. Roweis, L. K. Saul, Nonlinear dimensionality reduction by locally linear embedding, Science, 290(5500):2323–2326,
2000.
[15] J. B. Tenenbaum, V. De Silva, J. C. Langford,A global geometric framework for nonlinear dimensionality reduction,
Science, 290(5500):2319–2323, 2000.
[16] S. Yan, D. Xu, B. Zhang, H.-J. Zhang, Q. Yang, S. Lin, Graph embedding and extensions: a general framework for
dimensionality reduction, IEEE TPAMI, 29(1):40–51, 2007.
[17] S. Bhagat, G. Cormode, S. Muthukrishnan, Node Classification in Social Networks, In: Aggarwal C. (eds) Social Network
Data Analytics. Springer, Boston, MA, 115-148, 2011.
[18] X. Yu, X. Ren, Y. Sun, Q. Gu, B. Sturt, U. Khandelwal, B. Norick, J. Han, Personalized entity recommendation: A
heterogeneous information network approach, In WSDM, 283-292, 2014.
[19] T. F. Cox, M. A. Cox, Multidimensional scaling, CRC Press, 2000.
[20] S. T. Roweis, L. K. Saul, Nonlinear dimensionality reduction by locally linear embedding, Science, 290(5500):2323 2326,
2000.
[21] A. Ahmed, N. Shervashidze, S. Narayanamurthy, V. Josifovski, A. J. Smola, Distributed large-scale natural graph
factorization, In WWW, 37-48, 2013.
[22] B. Perozzi, R. Al-Rfou, S. Skiena, DeepWalk: Online learning of social representations, In KDD, 2014.
[23] J. Tang, M. Qu, M. Wang, M. Zhang, J. Yan, Q. Mei, LINE: Large-scale Information Network Embedding, In
WWW, 2015.
[24] A., Grover, J. Leskovec, Node2vec: Scalable feature learning for networks, In SIGKDD, 1225–1234, 2016.
[25] X. Wang, P. Cui, J. Wang, J. Pei, W. Zhu, S. Yang, Community preserving network embedding, in AAAI, ,203–209, 2017.
[26] X. Wang, D. Jin, X. Cao, L. Yang, W. Zhang, Semantic community identification in large attribute networks, In AAAI,
2016.
�[27] Vincent D Blondel, Jean-Loup Guillaume, Renaud Lambiotte, Etienne Lefebvre, Fast unfolding of communities in large
networks, J. of Statistical Mechanics: Theory and Experiment, 10, 2008, doi: 10.1088/1742-5468/2008/10/P10008.
[28] L. Tang, H. Liu, Leveraging social media networks for classification, IEEE Trans. On Data Mining and Knowledge
Discovery, 23(3):447–478, 2011.
[29] S. Fortunato, Community detection in graphs, Physics Reports, 486(3-5):75 – 174, 2010.
[30] K. Henderson, B. Gallagher, T. Eliassi-Rad, H. Tong, S. Basu, L. Akoglu, D. Koutra, C. Faloutsos, L. Li, RolX: Structural
role extraction & mining in large graphs, In KDD, 2012.
[31] D. Wang, P. Cui, W. Zhu, Structural deep network embedding, In SIGKDD, 1225–1234, 2016.
[32] R. I. Kondor, J. La_erty, Diffusion kernels on graphs and other discrete input spaces, In ICML, 2: 315-322, 2002.
[33] F. Lin, W. Cohen, Semi-supervised classification of network data using very few labels, In ASONAM, 192-199, 2010.
[34] L. Bottou, Stochastic gradient learning in neural networks, In Proc. of Neuro- Nimes, France, 1991.
[35] R. Zafarani, H. Liu, Social computing data repository at ASU, 2009.
[36] B. J. Breitkreutz, C. Stark, T. Reguly, L. Boucher, A. Breitkreutz, M. Livstone, R. Oughtred, D. H. Lackner,
J. Bähler, V. Wood, et al, The BioGRID interaction database, Nucleic acids research, 36: 637–640, 2008.
[37] M. Mahoney, Large text compression benchmark, www.mattmahoney.net/dc/textdata, 2011.
[38] J. Leskovec, A. Krevl, SNAP Datasets: Stanford large network dataset collection, 2014, http://snap.stanford.edu/data.
�
 Maseud Rahgozar