By running an A/B test specifically focused on optimizing Web Vitals, Vodafone found that a 31% improvement in LCP led to 8% more sales, a 15% improvement in their lead to visit rate, and a 11% improvement in their cart to visit rate.
Vodafone is a leading telecommunications company in Europe and Africa operating fixed and mobile networks in 21 countries and partnering with mobile networks in 48 more. By running an A/B test on a landing page (where version A was optimized for Web Vitals and had a 31% better LCP score in the field than version B), Vodafone determined that optimizing for Web Vitals generated 8% more sales.
31%
A 31% improvement in LCP led to…
+8%
Increase in total sales
+15%
Uplift in the lead to visit rate
+11%
Uplift in the cart to visit rate
Highlighting the opportunity
Vodafone knew that faster websites generally correlate to improved business metrics and were interested in optimizing their Web Vitals scores as a potential strategy for increasing sales, but they needed to determine exactly what kind of ROI they would get.

The approach they used
A/B test
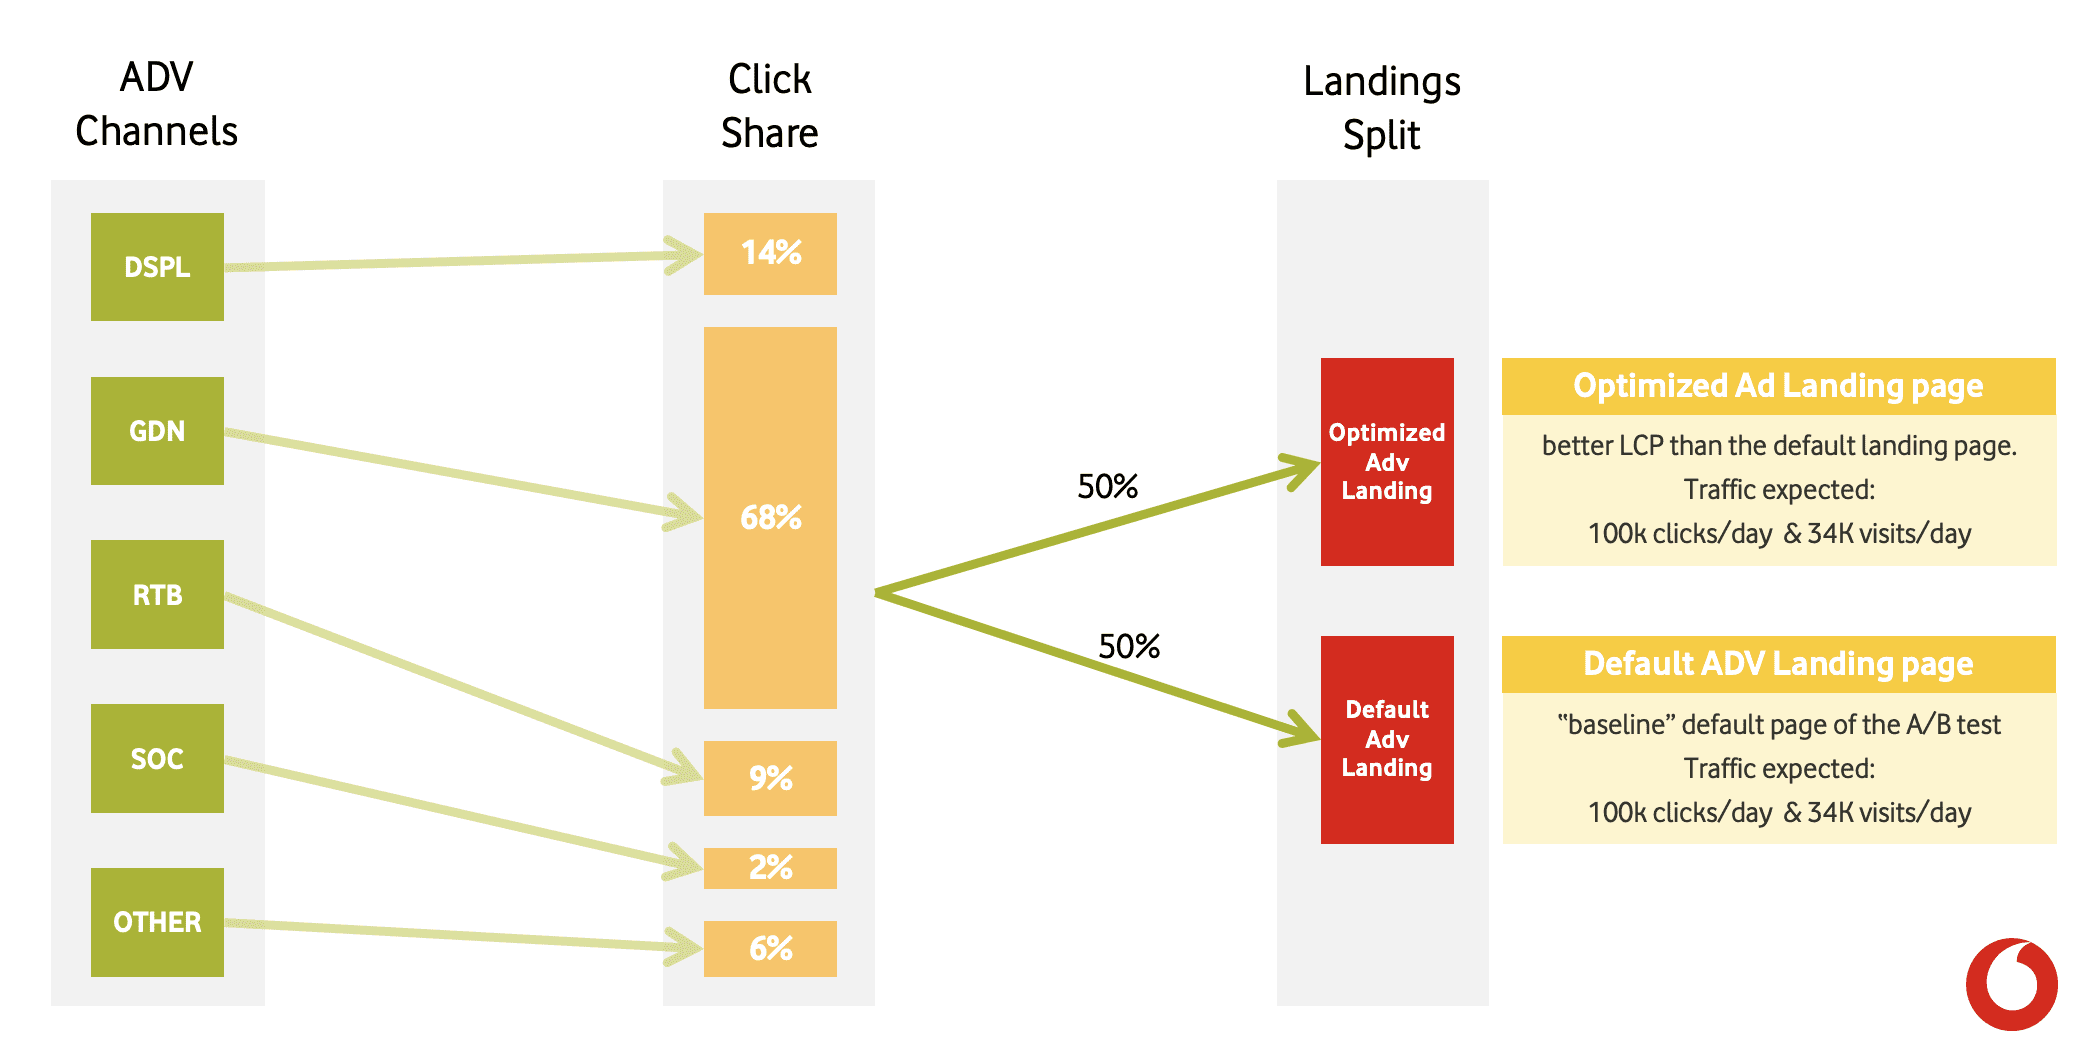
The traffic for the A/B test came from different paid media channels, including display,
iOS/Android, search, and social. 50% of the traffic was sent to the optimized landing page (version
A), and 50% was sent to the baseline page (version B). Version A and version B both got around 100K
clicks and 34K visits per day. As mentioned before, the only difference between version A and
version B was that version A was optimized for Web Vitals. There were no functional or visual
differences between the two versions other than that. Vodafone used the
PerformanceObserver API to
measure LCP on real user sessions and sent the
field data
to their analytics provider.

Optimizations
Vodafone made the following changes on the optimized page (version A):
- Moved the rendering logic for a widget from client-side to server-side, which resulted in less render-blocking JavaScript
- Server-side rendered critical HTML
- Optimized images, including resizing the hero image, optimizing SVG images, using media queries to avoid loading images that weren't yet visible in the viewport, and optimizing PNG images
Overall business results
After optimizing version A for Web Vitals and comparing it to the unoptimized version B, Vodafone found that version A led to:
- An 8% increase in sales
- A 15% improvement in the lead to visit rate (the number of users who became a lead versus the total number of visitors)
- An 11% improvement in the cart to visit rate (the number of users who visited their cart versus the total number of visitors)

The following table shows the values for DOMContentLoaded ("DCL") and LCP that
Vodafone observed on version A ("Optimized Page") and version B ("Default
Page"). Note that DCL actually increased 15%. The absolute values related to
business metrics have been redacted.

At Vodafone, we test new solutions, measure results, keep what worked and question what didn't, learning from mistakes. We call it "Experiment, Learn Fast". Thanks to the collaboration with Google and the introduction of LCP as the main KPI for page performance, it was possible to significantly improve the customer experience of our e-commerce.
Davide Grossi, Head of Digital Marketing, Business
Check out the Scale on web case studies page for more success stories.