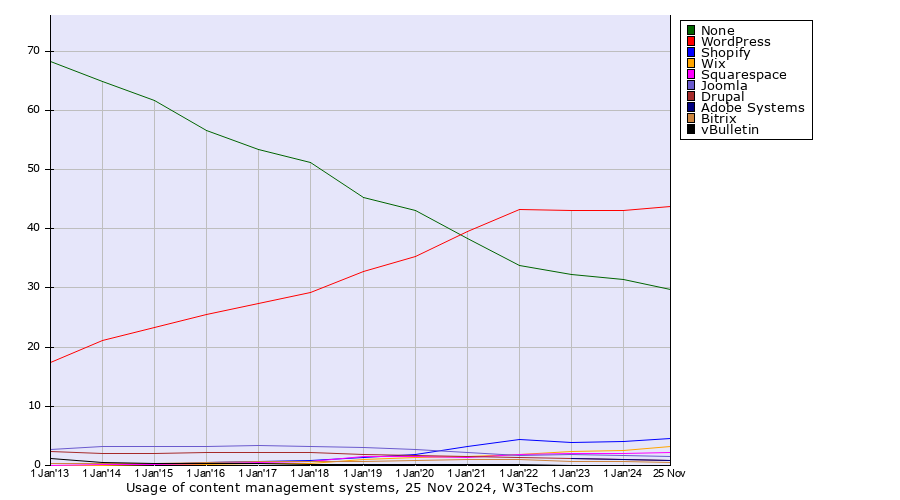
Technologies > Content Management > Usage Trend > Yearly Historical yearly trends in the usage statistics of content management systemsThis report shows the historical trends in the usage of the top content management systems since January 2013. | 2013
1 Jan | 2014
1 Jan | 2015
1 Jan | 2016
1 Jan | 2017
1 Jan | 2018
1 Jan | 2019
1 Jan | 2020
1 Jan | 2021
1 Jan | 2022
1 Jan | 2023
1 Jan | 2024
1 Jan | 2024
23 Nov | | None | 68.2% | 64.8% | 61.7% | 56.6% | 53.3% | 51.3% | 45.3% | 43.1% | 38.3% | 33.8% | 32.3% | 31.4% | 29.8% |
|---|
| WordPress | 17.4% | 21.0% | 23.3% | 25.6% | 27.3% | 29.2% | 32.7% | 35.4% | 39.5% | 43.2% | 43.1% | 43.1% | 43.7% |
|---|
| Shopify | | 0.1% | 0.3% | 0.4% | 0.6% | 0.9% | 1.4% | 1.9% | 3.2% | 4.4% | 3.8% | 4.1% | 4.6% |
|---|
| Wix | <0.1% | 0.1% | 0.1% | 0.2% | 0.3% | 0.4% | 1.0% | 1.3% | 1.5% | 1.9% | 2.4% | 2.6% | 3.2% |
|---|
| Squarespace | <0.1% | 0.1% | 0.2% | 0.4% | 0.5% | 0.7% | 1.4% | 1.5% | 1.4% | 1.8% | 2.0% | 2.1% | 2.2% |
|---|
| Joomla | 2.8% | 3.3% | 3.3% | 3.3% | 3.4% | 3.2% | 3.0% | 2.6% | 2.2% | 1.7% | 1.8% | 1.7% | 1.6% |
|---|
| Drupal | 2.3% | 1.9% | 2.0% | 2.1% | 2.2% | 2.3% | 1.9% | 1.7% | 1.5% | 1.3% | 1.2% | 1.1% | 0.9% |
|---|
| Adobe Systems | | | | | | | | | | | 1.1% | 1.0% | 0.9% |
|---|
| Webflow | | | | | | | 0.1% | 0.1% | 0.2% | 0.4% | 0.6% | 0.7% | 0.8% |
|---|
| PrestaShop | 0.3% | 0.4% | 0.5% | 0.6% | 0.6% | 0.6% | 0.8% | 0.7% | 0.5% | 0.5% | 0.7% | 0.8% | 0.7% |
|---|
| Google Systems | | | | | | | | | | | 0.8% | 0.7% | 0.6% |
|---|
| Duda | | | 0.1% | 0.1% | 0.1% | 0.1% | 0.1% | 0.1% | 0.1% | 0.2% | 0.3% | 0.4% | 0.6% |
|---|
| Tilda | | | | | | | 0.1% | 0.1% | 0.2% | 0.3% | 0.3% | 0.4% | 0.6% |
|---|
The diagram shows only content management systems with more than 1% usage.
 | Find more details in our extensive content management systems market reports. Learn more
|
Share this page | 
 Bluesky