Tutorial pyplot_scales.py crashes when used with plt.tight_layout() #6789
Description
Trying to replace plt.subplots_adjust with plt.tight_layout in the pyplot tutorial pyplot_scales.py (see #6779), seems to results in errors.
- Matplotlib version, Python version and Platform (Windows, OSX, Linux ...):
- Linux (at least Archlinux and CentOs 7)
- Tested on mpl 1.5.1 from Anaconda and mpl 2.0.0b3.post1799+ga4fdd60 from github
- MWE (kind of…):
Based onpyplot_scales.py:
import numpy as np
import matplotlib.pyplot as plt
plt.style.use('default')

# make up some data in the interval ]0, 1[
y = np.random.normal(loc=0.5, scale=0.4, size=1000)
y = y[(y > 0) & (y < 1)]
y.sort()
x = np.arange(len(y))

plt.figure(1)
plt.subplot(221)
plt.subplot(222)
plt.subplot(223)

# logit
plt.subplot(224)
plt.plot(x, y)
plt.yscale('logit')
#plt.subplots_adjust(top=0.92, bottom=0.08, left=0.10, right=0.95, hspace=0.25,
#                    wspace=0.35)
plt.tight_layout()

plt.show()
When I run this example with plt.tight_layout instead of plt.subplots_adjust (or simply no subplot layout adjusting at all), I get these outputs (mpl 2.0.0b3.post1799+ga4fdd60):
- with Qt4Agg backend
In [1]: run pyplot_scales_mwe.py  # that's the MWE posted above
/home/adrien/matplotlib/lib/matplotlib/transforms.py:380: RuntimeWarning: invalid value encountered in double_scalars
  return points[1, 0] - points[0, 0]
/home/adrien/matplotlib/lib/matplotlib/tight_layout.py:199: RuntimeWarning: invalid value encountered in double_scalars
  kwargs["wspace"] = hspace / h_axes
/home/adrien/matplotlib/lib/matplotlib/axis.py:1008: UserWarning: Unable to find pixel distance along axis for interval padding of ticks; assuming no interval padding needed.
  warnings.warn("Unable to find pixel distance along axis "
/home/adrien/matplotlib/lib/matplotlib/axis.py:1018: UserWarning: Unable to find pixel distance along axis for interval padding of ticks; assuming no interval padding needed.
  warnings.warn("Unable to find pixel distance along axis "

Traceback (most recent call last):
  File "/home/adrien/matplotlib/lib/matplotlib/backends/backend_qt5agg.py", line 182, in __draw_idle_agg
    FigureCanvasAgg.draw(self)
  File "/home/adrien/matplotlib/lib/matplotlib/backends/backend_agg.py", line 464, in draw
    self.figure.draw(self.renderer)
  File "/home/adrien/matplotlib/lib/matplotlib/artist.py", line 68, in draw_wrapper
    return draw(artist, renderer, *args, **kwargs)
  File "/home/adrien/matplotlib/lib/matplotlib/figure.py", line 1262, in draw
    renderer, self, dsu, self.suppressComposite)
  File "/home/adrien/matplotlib/lib/matplotlib/image.py", line 139, in _draw_list_compositing_images
    a.draw(renderer)
  File "/home/adrien/matplotlib/lib/matplotlib/artist.py", line 68, in draw_wrapper
    return draw(artist, renderer, *args, **kwargs)
  File "/home/adrien/matplotlib/lib/matplotlib/axes/_base.py", line 2383, in draw
    mimage._draw_list_compositing_images(renderer, self, dsu)
  File "/home/adrien/matplotlib/lib/matplotlib/image.py", line 139, in _draw_list_compositing_images
    a.draw(renderer)
  File "/home/adrien/matplotlib/lib/matplotlib/artist.py", line 68, in draw_wrapper
    return draw(artist, renderer, *args, **kwargs)
  File "/home/adrien/matplotlib/lib/matplotlib/axis.py", line 1109, in draw
    ticks_to_draw = self._update_ticks(renderer)
  File "/home/adrien/matplotlib/lib/matplotlib/axis.py", line 942, in _update_ticks
    tick_tups = [t for t in self.iter_ticks()]
  File "/home/adrien/matplotlib/lib/matplotlib/axis.py", line 885, in iter_ticks
    majorLocs = self.major.locator()
  File "/home/adrien/matplotlib/lib/matplotlib/ticker.py", line 1721, in __call__
    return self.tick_values(vmin, vmax)
  File "/home/adrien/matplotlib/lib/matplotlib/ticker.py", line 1726, in tick_values
    locs = self._raw_ticks(vmin, vmax)
  File "/home/adrien/matplotlib/lib/matplotlib/ticker.py", line 1674, in _raw_ticks
    nbins = max(min(self.axis.get_tick_space(), 9),
  File "/home/adrien/matplotlib/lib/matplotlib/axis.py", line 2008, in get_tick_space
    return int(np.floor(length / size))
ValueError: cannot convert float NaN to integer
which results in
(NB: it's a screenshot because savefig complained about the “ValueError: cannot convert float NaN to integer” stuff)
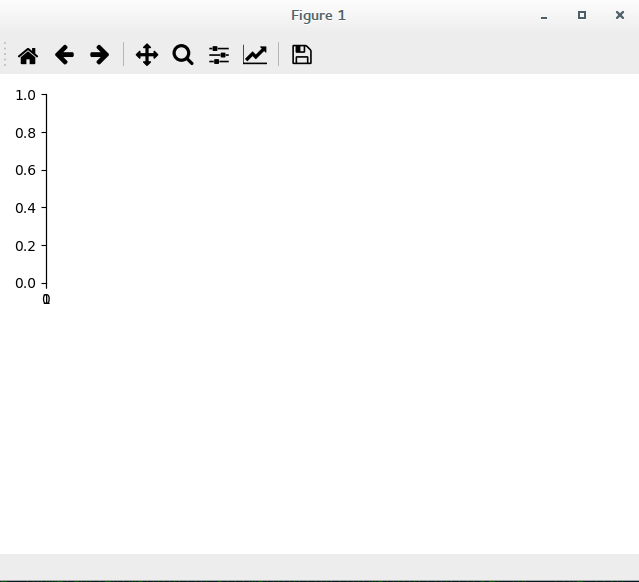
- with TkAgg backend
In [1]: run pyplot_scales_mwe.py  # that's again the MWE posted above
/home/adrien/matplotlib/lib/matplotlib/transforms.py:380: RuntimeWarning: invalid value encountered in double_scalars
  return points[1, 0] - points[0, 0]
/home/adrien/matplotlib/lib/matplotlib/tight_layout.py:199: RuntimeWarning: invalid value encountered in double_scalars
  kwargs["wspace"] = hspace / h_axes
/home/adrien/matplotlib/lib/matplotlib/axis.py:1008: UserWarning: Unable to find pixel distance along axis for interval padding of ticks; assuming no interval padding needed.
  warnings.warn("Unable to find pixel distance along axis "
/home/adrien/matplotlib/lib/matplotlib/axis.py:1018: UserWarning: Unable to find pixel distance along axis for interval padding of ticks; assuming no interval padding needed.
  warnings.warn("Unable to find pixel distance along axis "

Exception in Tkinter callback
Traceback (most recent call last):
  File "/home/adrien/anaconda/envs/Python2.7_matplotlib-git/lib/python2.7/lib-tk/Tkinter.py", line 1536, in __call__
    return self.func(*args)
  File "/home/adrien/matplotlib/lib/matplotlib/backends/backend_tkagg.py", line 283, in resize
    self.show()
  File "/home/adrien/matplotlib/lib/matplotlib/backends/backend_tkagg.py", line 354, in draw
    FigureCanvasAgg.draw(self)
  File "/home/adrien/matplotlib/lib/matplotlib/backends/backend_agg.py", line 464, in draw
    self.figure.draw(self.renderer)
  File "/home/adrien/matplotlib/lib/matplotlib/artist.py", line 68, in draw_wrapper
    return draw(artist, renderer, *args, **kwargs)
  File "/home/adrien/matplotlib/lib/matplotlib/figure.py", line 1262, in draw
    renderer, self, dsu, self.suppressComposite)
  File "/home/adrien/matplotlib/lib/matplotlib/image.py", line 139, in _draw_list_compositing_images
    a.draw(renderer)
  File "/home/adrien/matplotlib/lib/matplotlib/artist.py", line 68, in draw_wrapper
    return draw(artist, renderer, *args, **kwargs)
  File "/home/adrien/matplotlib/lib/matplotlib/axes/_base.py", line 2383, in draw
    mimage._draw_list_compositing_images(renderer, self, dsu)
  File "/home/adrien/matplotlib/lib/matplotlib/image.py", line 139, in _draw_list_compositing_images
    a.draw(renderer)
  File "/home/adrien/matplotlib/lib/matplotlib/artist.py", line 68, in draw_wrapper
    return draw(artist, renderer, *args, **kwargs)
  File "/home/adrien/matplotlib/lib/matplotlib/axis.py", line 1109, in draw
    ticks_to_draw = self._update_ticks(renderer)
  File "/home/adrien/matplotlib/lib/matplotlib/axis.py", line 942, in _update_ticks
    tick_tups = [t for t in self.iter_ticks()]
  File "/home/adrien/matplotlib/lib/matplotlib/axis.py", line 885, in iter_ticks
    majorLocs = self.major.locator()
  File "/home/adrien/matplotlib/lib/matplotlib/ticker.py", line 1721, in __call__
    return self.tick_values(vmin, vmax)
  File "/home/adrien/matplotlib/lib/matplotlib/ticker.py", line 1726, in tick_values
    locs = self._raw_ticks(vmin, vmax)
  File "/home/adrien/matplotlib/lib/matplotlib/ticker.py", line 1674, in _raw_ticks
    nbins = max(min(self.axis.get_tick_space(), 9),
  File "/home/adrien/matplotlib/lib/matplotlib/axis.py", line 2008, in get_tick_space
    return int(np.floor(length / size))
ValueError: cannot convert float NaN to integer
which produces an empty figure.
- If this is an image generation bug attach a screenshot demonstrating the issue:
See above. - If this is a regression (Used to work in an earlier version of Matplotlib), please
note where it used to work:
The behavior seems to be the same with mpl 1.5.1 and (at least) both TkAgg and Qt4Agg backends.