The first subplot is missized after savefig to a png file. #6457
Description
I'm not sure if this is an issue related to matplotlib or cartopy. I'll give an example here, hope somebody will figure this out. With packages of the following, I can still reproduce this:
matplotlib = 1.5.1
cartopy = 0.14.dev0
%matplotlib inline
%config InlineBackend.figure_format = 'svg'

import cartopy.crs as ccrs
from cartopy.mpl.ticker import LongitudeFormatter, LatitudeFormatter
import numpy as np
import matplotlib.pyplot as plt
import pandas as pd

#prepare the data
data = pd.DataFrame(np.array([[123.5, 39.2, 0, 1, 2, 3, 4],
                              [123.5, 39.3, 5, 6, 0, 1, 2],
                              [121.5, 40.7, 3, 4, 5, 6, 0],
                              [121.5, 40.3, 1, 2, 3, 4, 5]]),
                    index=['D01', 'D02', 'D03', 'D04'],
                    columns=['x', 'y', 'g_3', 'g_4', 'g_5', 'g_6', 'g_7'])
labels = ['0', '0-0.5', '0.5-1', '1-2', '2-3', '3-4', '4-5']
groups = [data.groupby('g_'+str(i)) for i in [3, 5, 6, 4, 7]]

x0, x1, y0, y1 = extent = 121, 124, 38.8, 41.1
width = 5
height = width * (y1-y0)/(x1-x0)

# creating 3*2 maps. Actually I only need 5, but I don't how to do that while x&y
# being both shared. So let's put a legend on the 6th one.
fig, axs = plt.subplots(3, 2, sharex=True, sharey=True,
                        figsize=(width*2, height*3),
                        dpi=300, subplot_kw={'projection': ccrs.PlateCarree()})
# for everymap
for i, ax in enumerate(axs.flatten()):
    #some settings of everymap
    ax.set_extent(extent)
    ax.set_xticks([122, 123], crs=ccrs.PlateCarree())
    ax.set_yticks([39, 40, 41], crs=ccrs.PlateCarree())
    ax.xaxis.set_major_formatter(LongitudeFormatter())
    ax.yaxis.set_major_formatter(LatitudeFormatter())
    [tick.label.set_fontsize(11) for tick in ax.yaxis.get_major_ticks()]
    [tick.label.set_fontsize(11) for tick in ax.xaxis.get_major_ticks()]

    #plot the point for the first 5th map
    if i < 5:
        for n, g in groups[i]:
            ax.scatter(g.x, g.y, s=10*n**2, c='k', transform=ccrs.PlateCarree())

# I need a legend for all 5 maps, let's put it on the 6th map
# I don't need to plot on the 6th map, so, I put it outside the extent
for n in range(len(labels)):
    ax.scatter(120, 38, s=10*n**2, c='k', transform=ccrs.PlateCarree(),
              label=labels[n])
ax.legend(loc='upper right', scatterpoints=1)
fig.tight_layout()
fig.savefig('a.png', dpi=300)
By running the code in notebook, I got an image shown as inline in notebook. I did a screen clipping. The image is as:

And the a.png file saved by fig.savefig('a.png', dpi=300) is as:
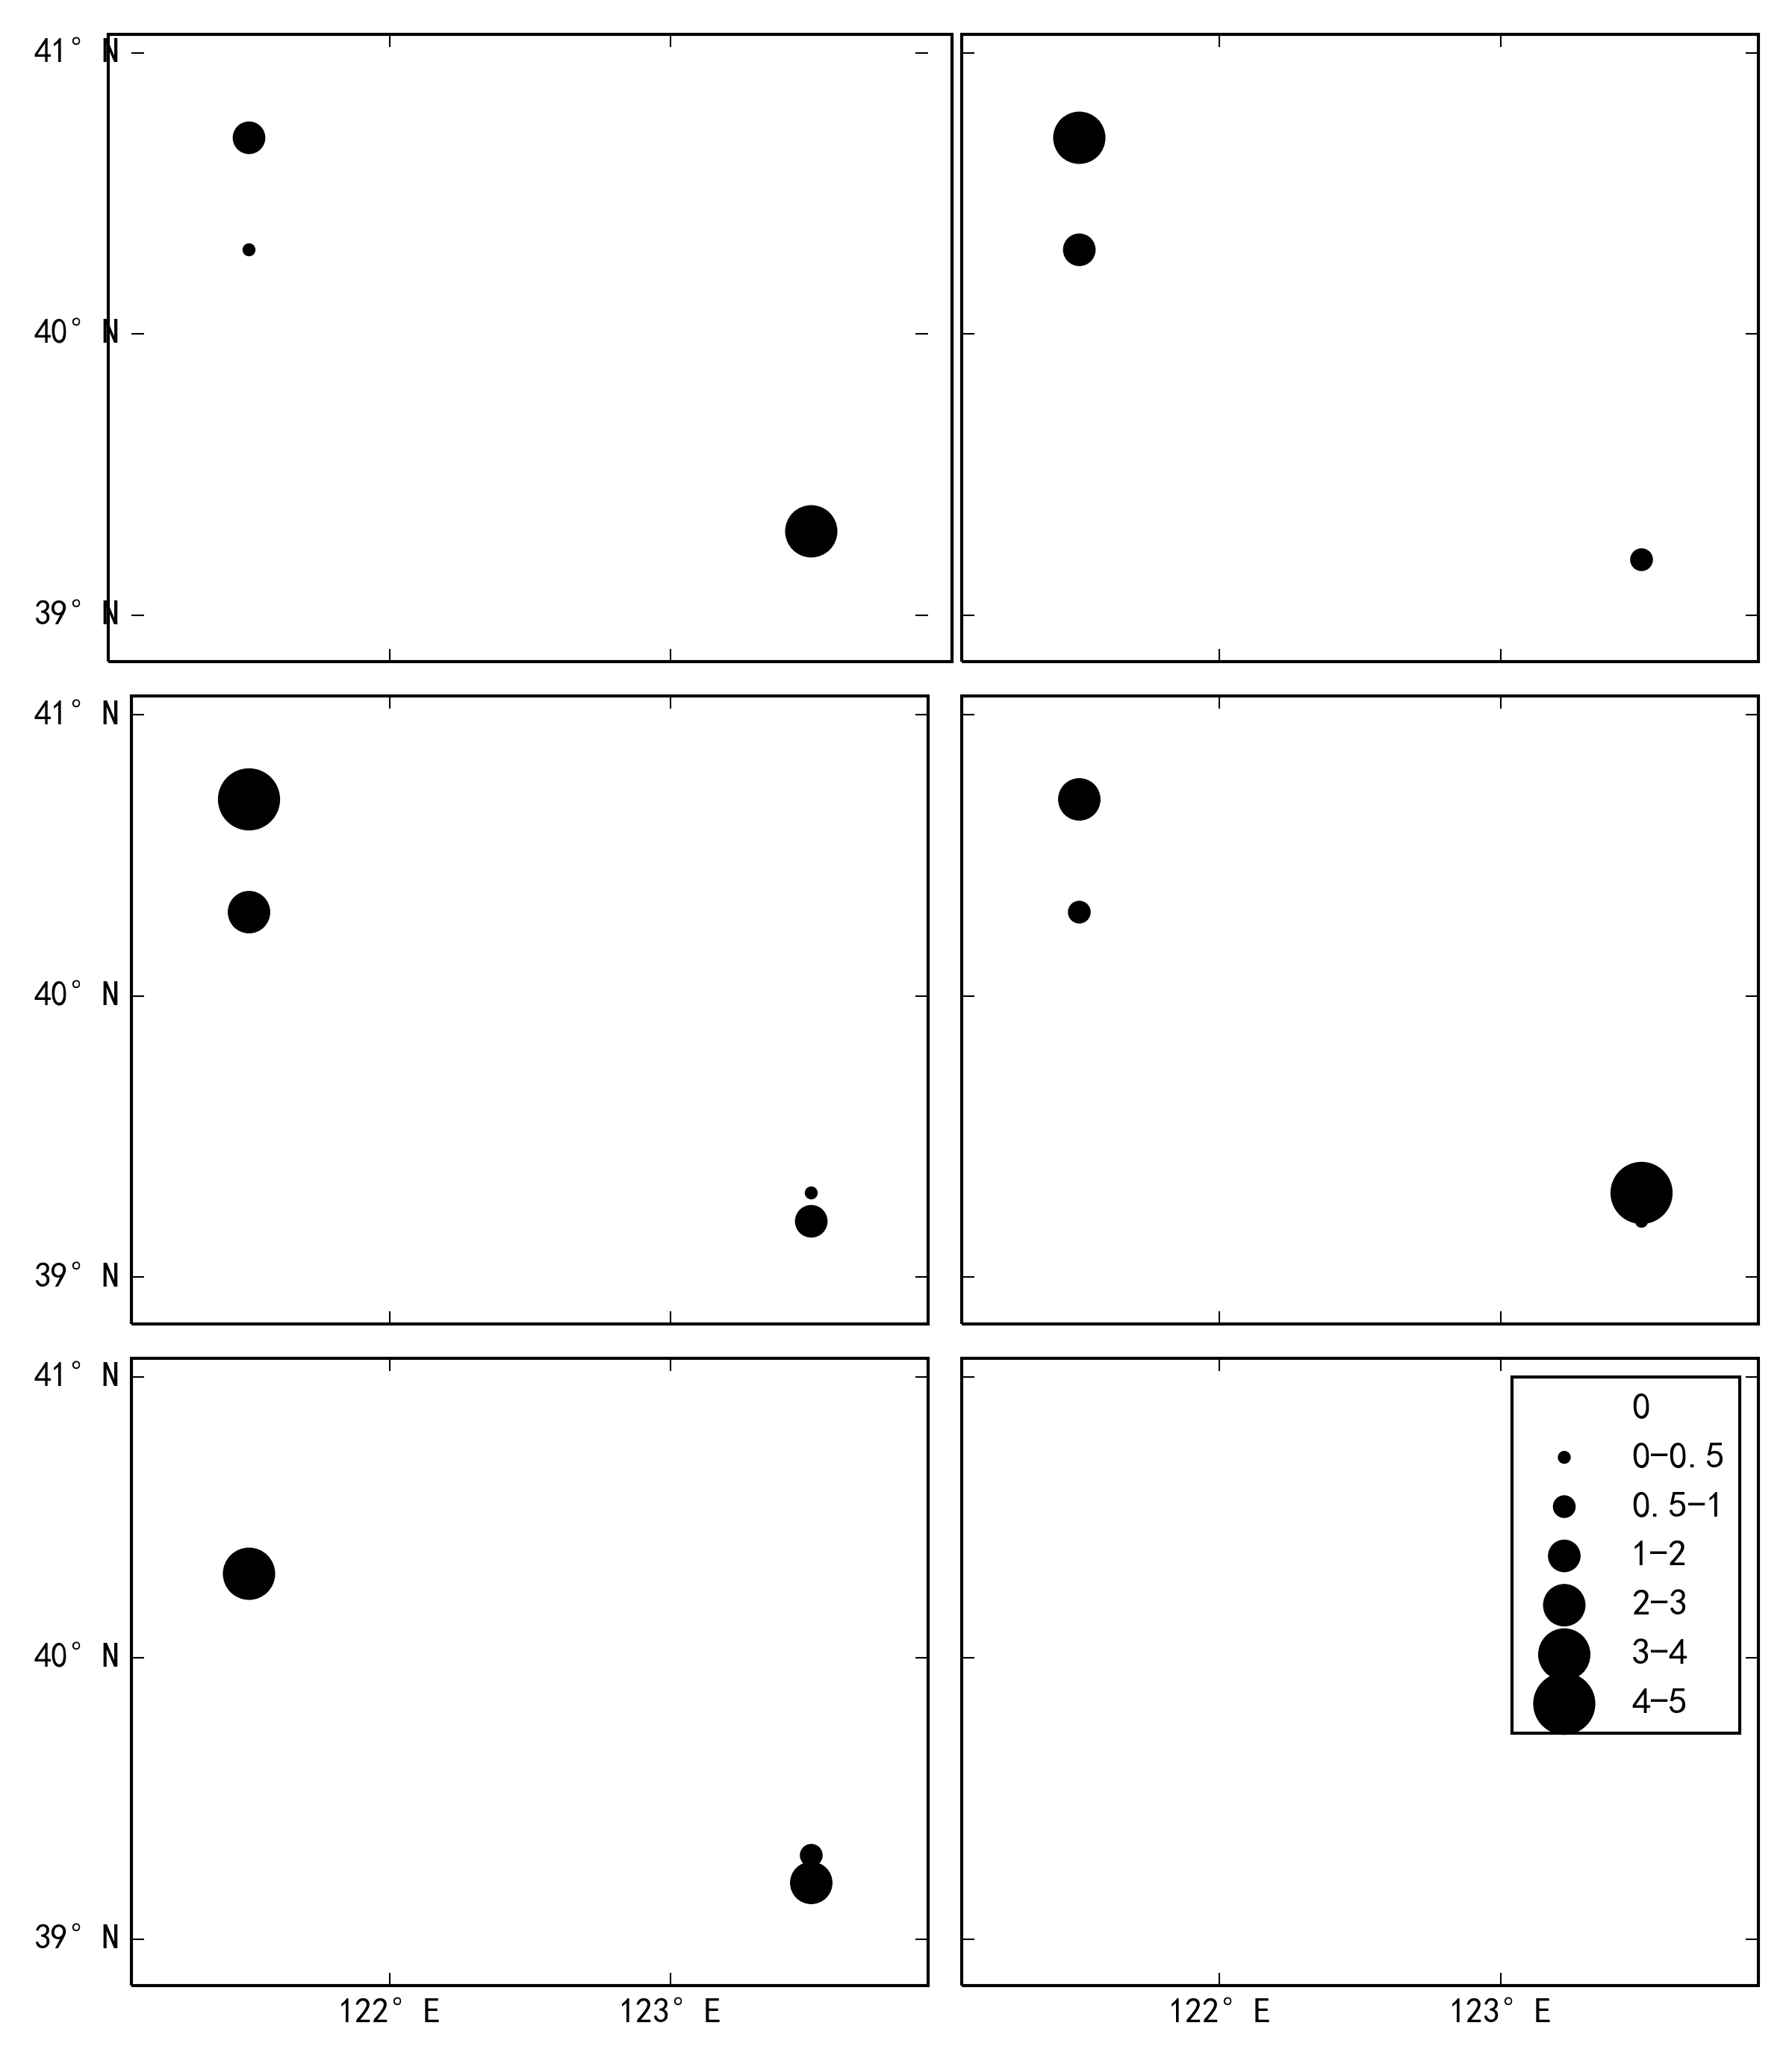
Notice that the first plot of the a.png is not the same size as the others, and it isn't aranged well.
Something out of the issue:
Of this example, how can I get 3 or 5 (any odd number other than 1) axes? Because now, I have to photoshop the result image to remove the 6th subplot and leave only the legend. If somebody know something, please let me know. Very appreciate.
Please tell me if any more information is needed.
Thanks.