10000 Subscripts not displayed correctly for high dpi · Issue #18899 · matplotlib/matplotlib · GitHub
[go: up one dir, main page]

Skip to content

Subscripts not displayed correctly for high dpi #18899

New issue

Have a question about this project? Sign up for a free GitHub account to open an issue and contact its maintainers and the community.

By clicking “Sign up for GitHub”, you agree to our terms of service and privacy statement. We’ll occasionally send you account related emails.

Already on GitHub? Sign in to your account

Closed
swish42 opened this issue Nov 5, 2020 · 1 comment
Closed

Subscripts not displayed correctly for high dpi #18899

swish42 opened this issue Nov 5, 2020 · 1 comment

Comments

@swish42
Copy link
swish42 commented Nov 5, 2020

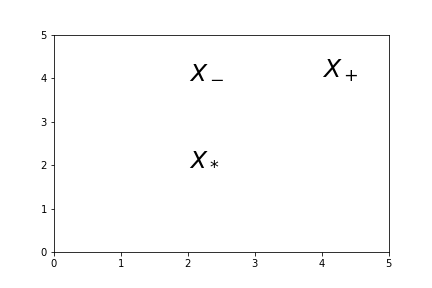
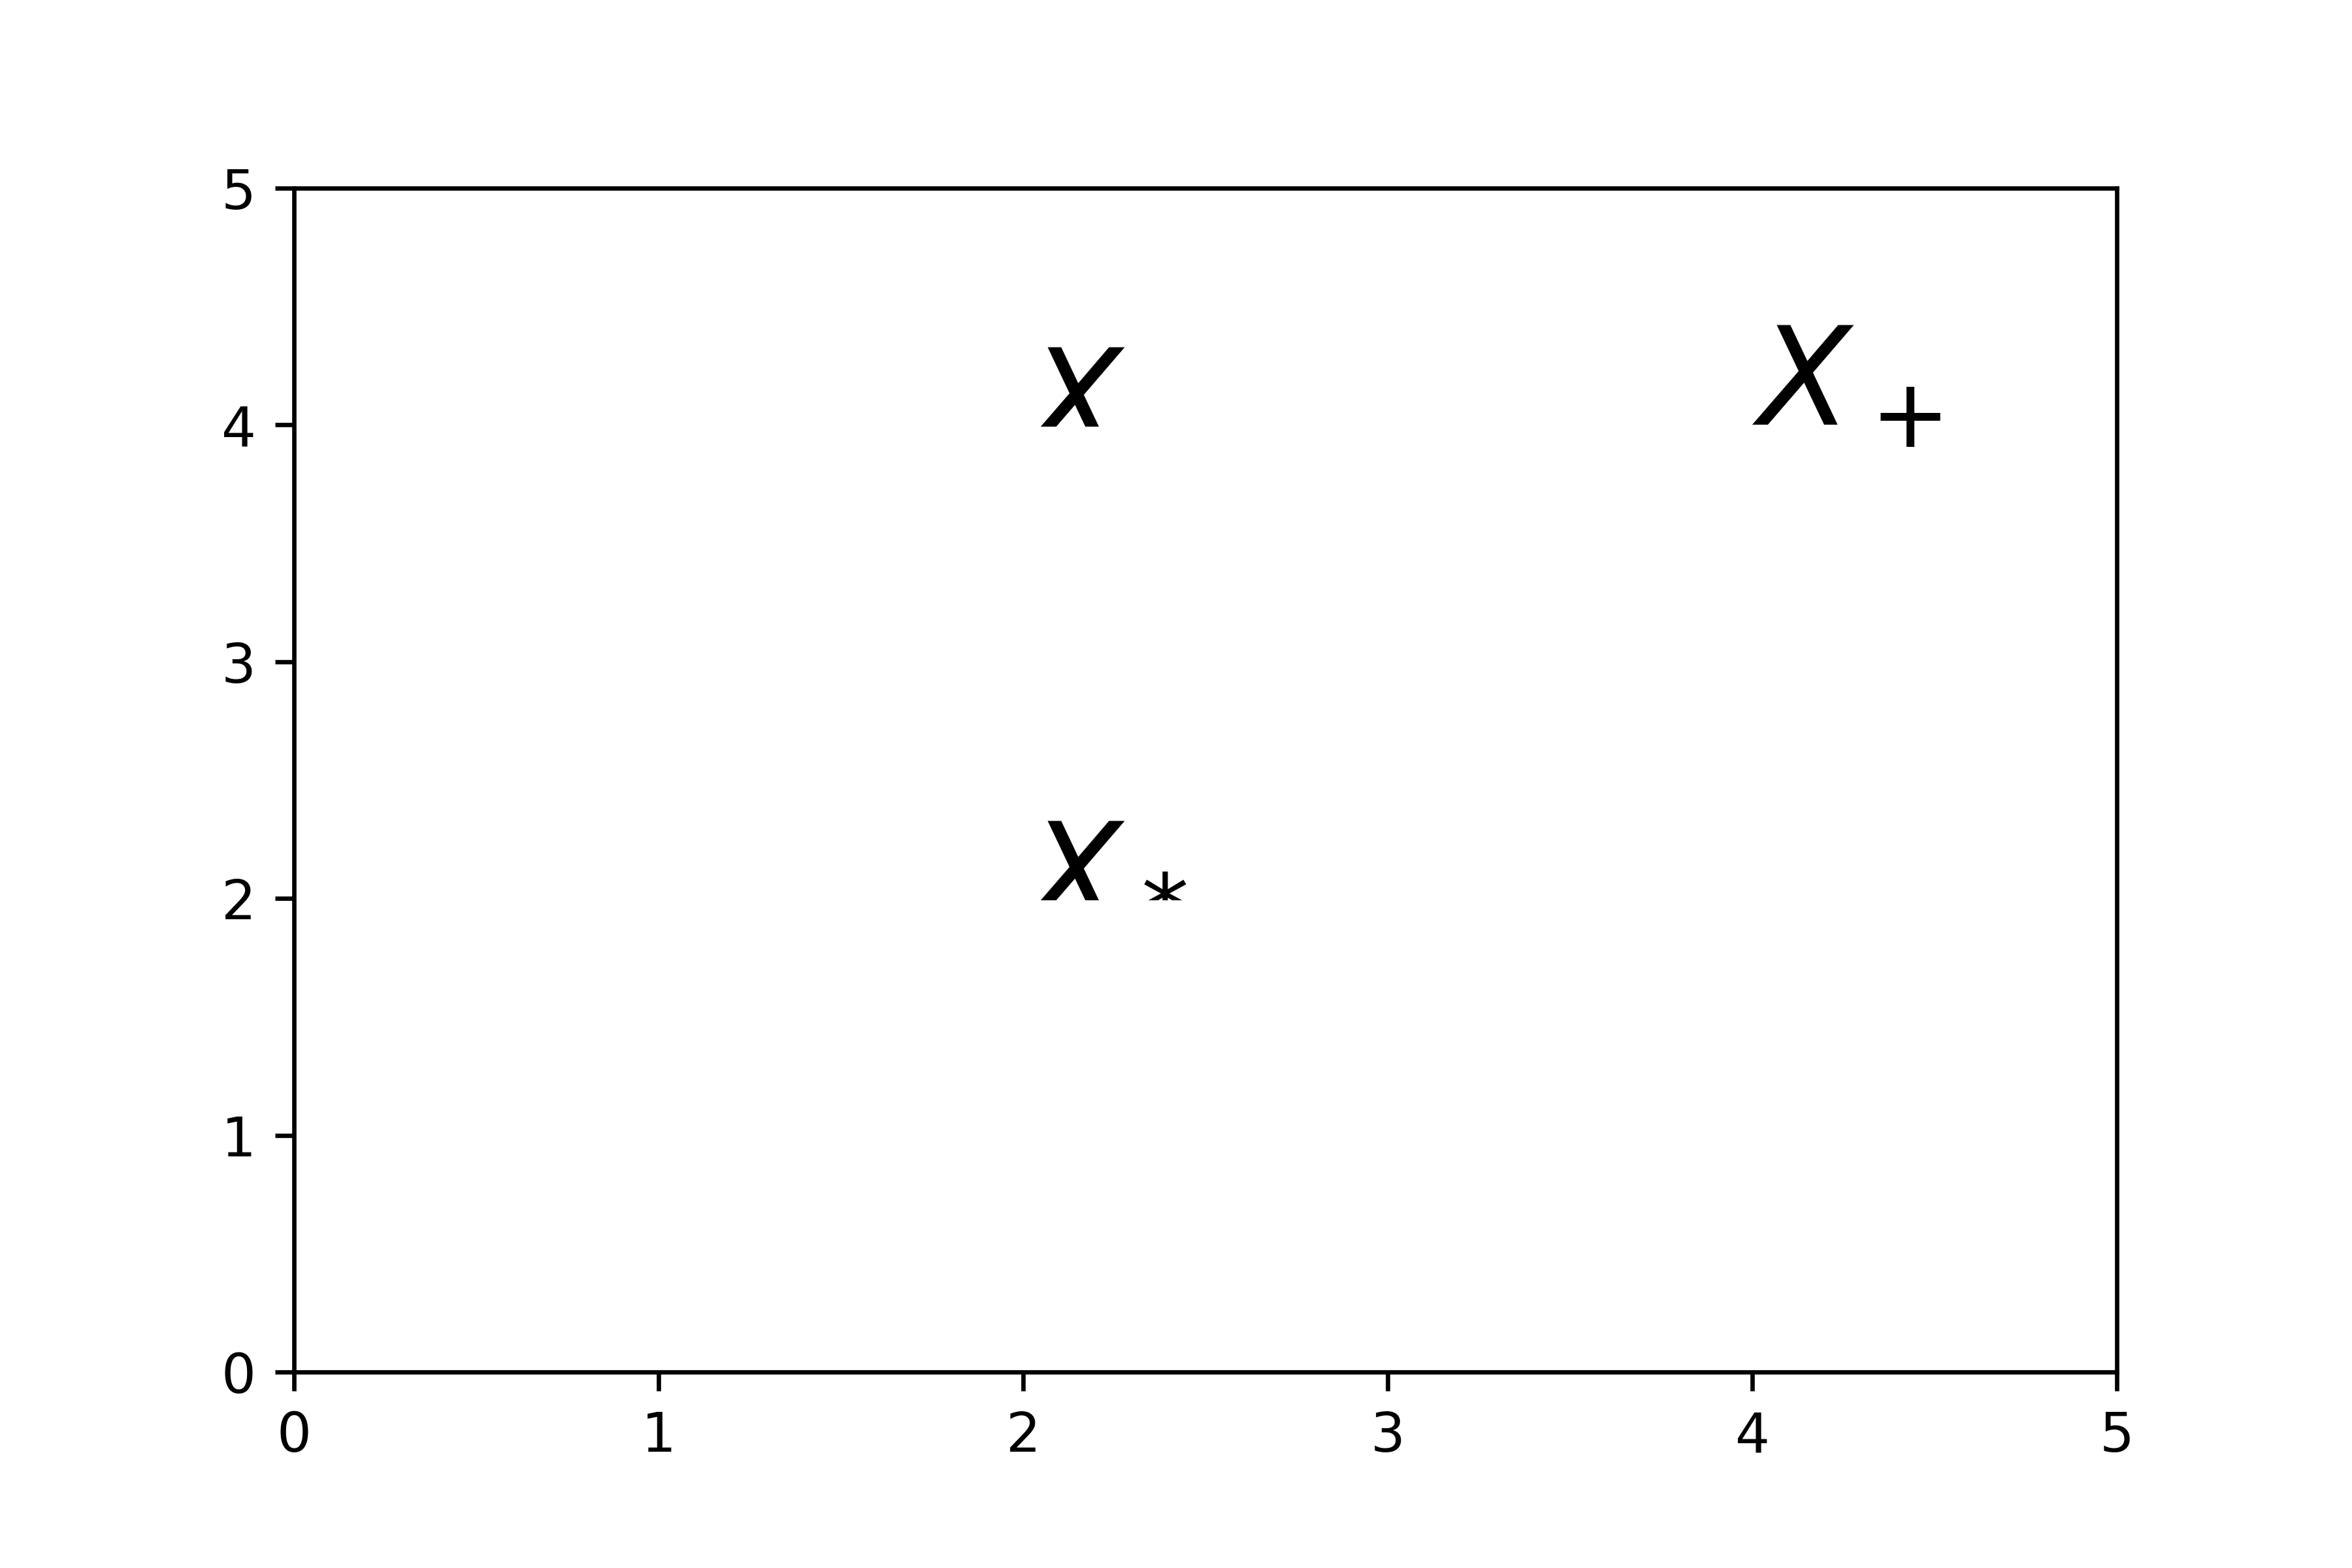
Some subscripts seem to be incorrectly displayed in figures with high pixel density. For example, subscript + is shown correctly even for dpi=600, while subscript - or * are not shown correctly and the previous letter is cut off. This is similar to #4428, so apparently the issue has not been resolved.
Example:

import matplotlib.pyplot as plt
fig1 = plt.figure()
ax1 = fig1.add_subplot(111)
ax1.axis([0, 5, 0, 5])
ax1.text(2,4, '$X_-$', fontsize=25)
ax1.text(4,4, '$X_+$', fontsize=25)
ax1.text(2,2, '$X_*$', fontsize=25)

fig2 = plt.figure(dpi=600)
ax2 = fig2.add_subplot(111)
ax2.axis([0, 5, 0, 5])
ax2.text(2,4, '$X_-$', fontsize=25)
ax2.text(4,4, '$X_+$', fontsize=25)
ax2.text(2,2, '$X_*$', fontsize=25)

produces
correct
error

I am using matplotlib 3.3.2 with Python 3.7.8.

@anntzer
Copy link
Contributor
anntzer commented Nov 5, 2020

I think this is a duplicate of #15313?

Sign up for free to join this conversation on GitHub. Already have an account? Sign in to comment
Projects
None yet
Development

No branches or pull requests

2 participants
0