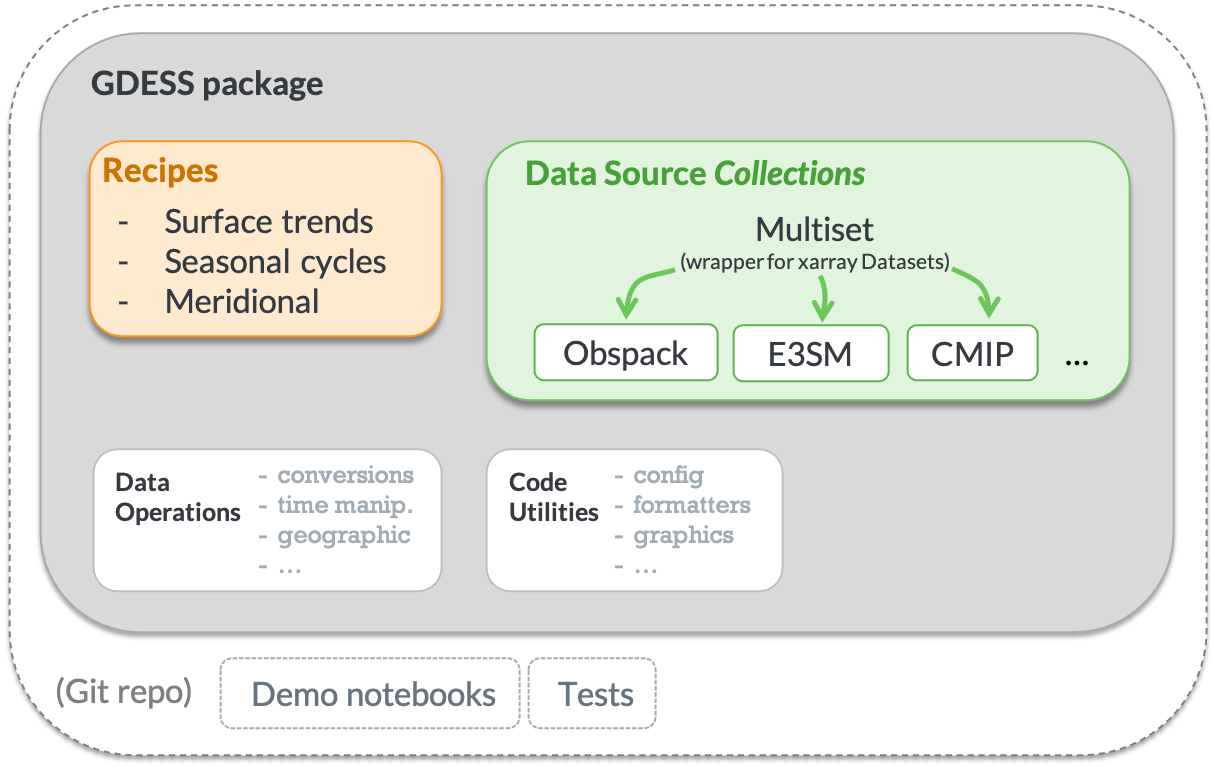
GDESS facilitates comparison of simulated atmospheric CO2 against observational data. Specifically, it selects, loads, and parses the observational datasets and model simulations to be in a consistent structure and generates data visualizations for several diagnostic use cases. Three diagnostic recipes currently implemented examine multidecadal trends, seasonal cycles, and meridional gradients.
Model intercomparisons and benchmarking is critical for Earth System Models. By comparing the values of variables, such as CO2, in these simulations against observed values, one can discover the needs and means for refining model components, and learn much about Earth system dynamics in the process.
Development of gdess was initiated by a need to evaluate atmospheric CO2
for the U.S. Department of Energy's Energy Exascale Earth System Model (E3SM)
and its campaign focused on simulations of global biogeochemistry.
Although there are existing diagnostic tools for Earth System Models (e.g. ESMValTool, ILAMB, BGC-val), they do not provide functionality specific for atmospheric CO2 concentrations.
See ./gdess/bin/gdess_cli.py --help for more command-line switches and the documentation
for more usage examples.
- Data requirements and availability
- Getting started
- Example
- Usage
- Updating
- Uninstalling
- Contributing
- Running built-in tests
- Project structure
- Credits
- Disclaimer
Observations - Globalview+ data
- For parsing and running demo notebooks, one must first download the Obspack, which is available from the NOAA Global Monitoring Laboratory (GML) here: https://www.esrl.noaa.gov/gmd/ccgg/obspack/data.php
- There is a sample file from NOAA GML included in this Git repository to enable the running of test cases.
Model Output - CMIP6
- CMIP6 data do not need to be downloaded before running recipes, as GDESS can use the intake-esm dependency to retrieve CMIP6 data programmatically while running.
- It seems that recipes involving CMIP data won't work when on the PNNL VPN (presumably because the VPN blocks retrieval of the CMIP data catalog using a web URL, which is initiated by the intake package).
Model Output - E3SM
- E3SM outputs do not need to be available to run recipes that compare Globalview+ and CMIP6 data.
- For parsing and running recipes from E3SM Collection,
one must have access to model output history as NetCDF file(s),
and a script for post-processing E3SM output is provided in
gdess/bin/.
👥 Clone this repository to the location of your choice.
git clone https://github.com/E3SM-Project/gdess.git ~/gdess
cd ~/gdess
🌍 Using conda, create a runtime or development environment and install dependencies. Note: Replace “myenv” with the preferred name of your environment, e.g. "gdess_env". From here on we’ll use “myenv” to refer to our environment.
conda create -n myenv python=3.8
conda activate myenv
conda config --add channels conda-forge
conda install --file requirements.txt
💾 Install the package:
pip install .(Optional) Retrieve the example data files used for running tests:
git lfs install
git lfs pullInstead of passing data filepaths to the recipe functions each time, you can define environment variables for the directory containing Globalview+ Obspack and CMIP model output.
- Specify the path to the repo on the first line of
gdess/bin/set_path_vars.sh. For instance, by executing:export GDESS_REPO=${HOME}/gdess - Set paths to the test data by running the script at the command line:
source ./gdess/bin/set_path_vars.sh- To use stored data other than the test data, modify the other data paths in the scripts.
For example, to set the paths for every future terminal instance (and if you are running in a bash environment),
set these paths in your
~/.bash_profile:
export GDESS_CMIP_DATA=Path/to/Model/Output/NetCDF/Files
export GDESS_GLOBALVIEW_DATA=Path/to/Obspack/NetCDF/Files- Follow the instructions provided in
./gdess/bin/set_path_vars.bat
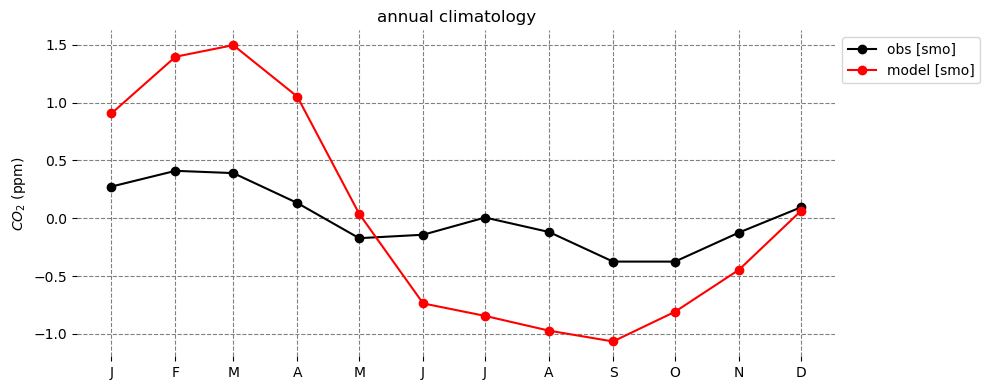
- The following steps generate this figure:
- Install the
gdesspackage according to the installation instructions - Follow the configuration instructions to use the included example data files
./gdess/bin/gdess_cli.py --verbose seasonal --start_yr 1980 --end_yr 2015 --model_name BCC.esm-hist --cmip_load_method local --station_list smo
- Other examples are given in the provided jupyter notebooks,
which show recipe usage (
trends_recipe.ipynb,seasonal_cycle_recipe.ipynb, andmeridional_recipe.ipynb). To run them:- Enable your conda environment via:
python -m ipykernel install --user --name=myenv - Start jupyter by entering:
jupyter notebook - Navigate within jupyter to
gdess/notebooks/demo/
- Enable your conda environment via:
Diagnostic recipes can be run from the command line or from within a Python kernel:
Command line
- Use
gdess/bin/gdess_cli.pyfollowed by the recipe name and then recipe options. To see available commands, run, e.g.gdess/bin/gdess_cli.py --helporgdess/bin/gdess_cli.py seasonal --help - To specify options from a file [recommended for repeated tests], use the
@symbol prefix for the filename. For example, using the provided file:gdess/bin/gdess_cli.py @recipe_options_example.txt
In a Python kernel
- The diagnostic recipes can be called directly, with options passed as a Python
dictobject. - Check out the demonstration notebooks in
gdess/notebooks/demo/. The notebooks show recipe usage.
To use the latest version of this repository:
-
Enter the
gdess/directory -
Activate your desired environment
-
Run the commands:
git pull
git checkout main
pip install . --upgrade
🚮 To remove this package from your environment:
pip uninstall gdess
If you're interested in participating in the development of gdess,
want to suggest features or report bugs,
please leave us a message through the issue tracker.
Note that most work is done in the 'develop' branch,
so please git checkout develop
(or you can create a new branch) before modifying code.
To run the built-in tests:
pytestgdess
│
├── README.md <- Top-level README for users/developers of this project
├── requirements.txt <- Package dependencies
├── recipe_options_example.txt
│
├── notebooks <- Example jupyter notebooks to see diagnostic capabilities of gdess
│ └──demo/
│
├── gdess <- *Python package* for handling co2 diagnostics
│ │
│ ├── bin
│ │ ├── gdess_cli.py <- Run recipes from the command line
│ │ ├── set_path_vars.sh <- Script to set up data file paths for running examples
│ │ └── concat_and_remap_E3SM_co2.sh <- Script template for post-processing of E3SM output
│ │
│ ├── recipes <- Generate repeatable diagnostics that span multiple data sources available as recipes
│ │ ├── surface_trends.py
│ │ ├── seasonal_cycles.py
│ │ ├── meridional_gradient.py
│ │ ├── recipe_utils.py
│ │ └── ...
│ │
│ ├── data_source <- Load, parse, and manipulate data from a particular source
│ │ ├── models/
│ │ ├── observations/
│ │ ├── multiset.py
│ │ └── ...
│ │
│ ├── operations <- Manipulate datasets (e.g. spatially or temporally)
│ │ ├── Confrontation.py
│ │ ├── geographic.py
│ │ ├── time.py
│ │ ├── convert.py
│ │ ├── datasetdict.py
│ │ └── ...
│ │
│ ├── formatters <- Manipulate formatting in desired ways
│ │ ├── args.py
│ │ ├── nums.py
│ │ ├── strings.py
│ │ └── ...
│ │
│ ├── graphics <- Make repeated graphic actions available
│ │ ├── comparison_plots.py
│ │ ├── single_source_plots.py
│ │ ├── utils.py
│ │ └── ...
│ │
│ ├── config <- Configuration options
│ │ ├── defaults.ini
│ │ ├── stations_dict.json
│ │ └── log_config.json
│ │
│ └── recipe_parsers.py
│
├── tests <- Unit and integration tests for development
│ └── ...
├── ccgcrv <- Curve fitting code from NOAA GML (see credits in the README)
│ └── ...
├── ci <- Environment specification for continuous integration
│ └── ...
├── paper <- Manuscript for the Journal of Open Source Software (JOSS)
│ └── ...
│
├── LICENSE
├── MANIFEST.in
├── setup.cfg
└── setup.py
The full list of dependencies is in the requirements.txt file.
-
Although not a dependency, ideas were also drawn from xclim: Climate indices computations.
-
ccgcrv: The curve fitting code in the ccgcrv directory has been mildly modified — modified for improved code integration, i.e. the computational logic has not been changed — from the code made freely available by the NOAA Global Monitoring Laboratory. From their website, one can access the source code and read a description of its usage. Additional details regarding the curve fitting approach can be found in the following publications:- Thoning, K.W., P.P. Tans, and W.D. Komhyr, 1989, Atmospheric carbon dioxide at Mauna Loa Observatory, 2. Analysis of the NOAA/GMCC data, 1974 1985., J. Geophys. Res. ,94, 8549 8565. https://doi.org/10.1029/JD094iD06p08549
- Sweeney, C., Karion, A., Wolter, S., Newberger, T., Guenther, D., Higgs, J.A., Andrews, A.E., Lang, P.M., Neff, D., Dlugokencky, E., Miller, J.B., Montzka, S.A., Miller, B.R., Masarie, K.A., Biraud, S.C., Novelli, P.C., Crotwell, M., Crotwell, A.M., Thoning, K., Tans, P.P., 2015. Seasonal climatology of CO 2 across North America from aircraft measurements in the NOAA/ESRL Global Greenhouse Gas Reference Network. J. Geophys. Res. Atmos. 120, 5155–5190. https://doi.org/10.1002/2014JD022591
-
The Mauna Loa (MLO), American Samoa (SMO), South Pole (SPO), and Barrow Observatory (BRW) dataset files used in the tests directory was provided via the Obspack (GLOBALVIEWplus_v6.0_2020-09-11) by: C. D. Keeling, S. C. Piper, R. B. Bacastow, M. Wahlen, T. P. Whorf, M. Heimann, and H. A. Meijer, Exchanges of atmospheric CO2 and 13CO2 with the terrestrial biosphere and oceans from 1978 to 2000. I. Global aspects, SIO Reference Series, No. 01-06, Scripps Institution of Oceanography, San Diego, 88 pages, 2001.
- This work is made possible by the Pacific Northwest National Laboratory.
- Data were obtained from the Energy Exascale Earth System Model project, sponsored by the U.S.Department of Energy, Office of Science, Office of Biological and Environmental Research.
This is a work in progress. Bugs are expected.


