


Services on Demand
Journal
Article
 English (pdf)
 Article in xml format
 Automatic translation
Indicators
-
 Cited by SciELO
 -
 Access statistics
Related links
-
 Cited by Google
  Similars in
SciELO
Similars in
SciELO -
 Similars in Google
Share

 Permalink
Journal of the Chilean Chemical Society
On-line version ISSN 0717-9707
J. Chil. Chem. Soc. vol.58 no.4 Concepción Dec. 2013
http://dx.doi.org/10.4067/S0717-97072013000400067
GREEN SYNTHESIS AND CHARACTERIZATION OF GRAPHITE OXIDE BY ORTHOGONAL EXPERIMENT
SHUGE PENG*, XINJIE FAN, SHUANG LI, JUN ZHANG
Key Laboratory of Polymer and Nanomaterials, Henan University of Science and Technology, Luoyang, 471003, P.R. China. * e-mail: sgpeng@haust.edu.cn
ABSTRACT
Graphite oxide (GO) was prepared with graphite flakes, KMnO4, and a mixture of concentrated H2SO4/H3PO4 by an improved green synthesis method. To obtain fully oxidized GO, an orthogonal array design L9 was applied to select the optimum preparing conditions. The effects of the quantity of graphite, the quantity of KMnO4, reaction time, and temperature on the degree of oxidization of GO were evaluated by the orthogonal array design (OAD). The results show that the factors arranged in important order as the follows: reaction time, reaction temperature, the quantity of KMnO4, the quantity of graphite. Graphite oxide obtained at the optimal parameters by the improved method was characterized by UV-Vis, FT-IR, Raman spectrum, and XRD techniques, and compared with GO produced by the modified Hummers' method. The results indicate that the GO obtained by the improved green synthesis method has fewer defects in the basal plane and is more oxidized than the modified Hummers' method.
Key words: Graphite oxide, green synthesis, orthogonal array.
1. INTRODUCTION
Single-layer graphite, known as graphene, a new class of two-dimensional carbon nanostructure, due to their excellent electronic transport properties, extremely high mechanical stiffness, and exceptional thermal and electrical conductivity, has attracted considerable scientific interest in constructing a range of advanced materials for many potential applications such as nanoelectronics, sensors, batteries, supercapacitors, hydrogen storage, and nanocomposites [1-5]. Grapheme was first obtained through micromechanical cleavage of graphite of bulk graphite [6]. However, this method was less effective for large-scale manufacturing. Recent advancements in the production of grapheme involve chemical vapor deposition (CVD), epitaxial growth, and liquid phase exfoliation from graphite [7-9]. The latter chemical method is a practical approach to the scalable production of graphene materials. The primary challenging to achieve individual or few-layer graphene is overcoming the strong, attractive van der Waals forces. To date, chemical efforts at graphite exfoliation have been mainly focused on the intercalation, chemical modification, oxidation-reduction, and the use of stabilizers such as surfactants or polymer [10-20]. However, the most common technique for exfoliation and dispersion of graphene is to disperse the graphite oxide (GO) into water or other polar solvents [21-25]. The presence of the carboxyl, alcohols, and epoxides groups on the basal plane of GO reduce the interlayer forces and render them soluble in water. Due to the easily handle, the method is widely used to construct various nanocomposites [26-30].
Accordingly, the preparation of GO became a critical step in constructing graphene -based nanocomposites. In 1859, Brodie first reported the preparation of GO by adding a portion of potassium chlorate into a slurry of graphite in fuming nitric acid [31]. Based on the Brodie's method, Staudenmaier improved the procedure in 1898 by using concentrated sulfuric acid as well as fuming nitric acid and adding the chlorate in multiple aliquots over the course of the reaction [32]. The obtained GO by Staudenmaier was more oxidized than Brodie in a single reaction. Due to the potential risk of explosions, the method of GO preparation proposed by Brodie and Staudenmaier was not widely used. Until after more than 50 years, Hummers adopted a new kind of oxidizing agent to prepare GO in 1958 by adding KMnO4 and NaNO3 in concentrated H2SO4 [33]. The Hummers' method in GO preparation was safer in operation than that of Brodie and Staudenmaier and was most commonly used today. However, it should be noticed that all three of these procedures involve the generation of the toxic gas (es) NO2, N2O4, and/or ClO2; the latter also being explosive. With the appeal of environmental protection, a green and safer GO preparation method is demanded. Until very recently, a green synthesis method of GO was reported by Marcano et al. [34], who obtained GO by adding KMnO4 in a 9:1 mixture of concentrated H2SO4/H3PO4 to oxidize graphite. The advantages of the Marcano's method were its higher yield and no toxic gas evolution during preparation compared to the previously reported three methods. However, the post-processing of the method was time-consuming, which involved the repeating sifting; and the influence of the quantity of graphite, the quantity of KMnO4, reaction time, and temperature on GO preparation was not clear.
In the present work, we prepared GO by an improved green synthesis using KMnO4 and a 9:1 mixture of concentrated H2SO4/H3PO4 as oxidant, which was similar to the procedure described by Marcano et al. but with some modifications to simplify the post-processing by simple filtration. To obtain well-oxidized GO, an orthogonal array design (OAD) L9 was applied to optimize the preparing conditions of GO. The effects of the quantity of graphite, the quantity of KMnO4, reaction time, and temperature were evaluated by the OAD. Then the GO obtained at the optimum preparing conditions was evaluated by FT-IR, XRD, Raman and UV-Vis techniques. The results suggested that the improved green synthesis method was simpler than Marcano's and could be more attractive for large-scale production of GO than Hummers' method.
2. EXPERIMENTAL
2.1 Materials
The natural flake graphite (~325 mesh, ≥ 99.8% purity) used to prepare GO was purchased from Alfa Aesar. Concentrated sulfuric acid( 95-98% ), phosphoric acid(> 85%), hydrogen peroxide (≥30%), hydrochloric acid (36-38%), potassium permanganate, and barium chloride were purchased from Luoyang Hao Hua Chemical Reagent Co. Ltd. and used as received. Deionized water was distilled by water purification system.
2.2 Preparation of graphite oxide
2.2.1 Green preparation
The green synthesis of GO was prepared similar to the procedure described by Marcano et al. but with some modifications. In detail, graphite flakes and KMnO4 were added successively to a 9:1 mixture of concentrated H2SO4/H3PO4 (45:5 mL). The reaction was then heated to a certain temperature controlled by water bath and stirred for a certain time. After that, 250 mL of water was added. Shortly, 10 mL of 30% H2O2 was added to the mixture. The warm solution was then filtered and washed with 5% HCl aqueous solution until SO42- was removed completely. The filter cake was then dispersed in water by mechanical agitation. Then, the above mixture was centrifuged to collect the bottom produce and repeatedly washed with deionized water until the pH of the supernatant was neutral. Finally the material was dried at 60°C for 24 h and obtained a brown or black sample, which was called IGO.
2.2.2 Optimization of graphite oxide preparation
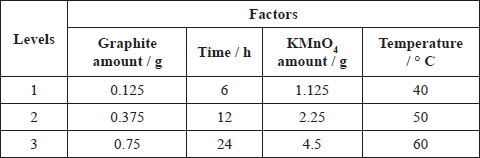
Graphite oxide was prepared by varying the quantity of graphite, the quantity of KMnO4, reaction time, and temperature. In this study, orthogonal experimental design method was used to analyze the influence degree of the quantity of graphite, the quantity of KMnO4, reaction time, and temperature on the structure of graphite oxide. Then the optimized preparation conditions were selected. The quantity of graphite, the quantity of KMnO4, reaction time, and temperature were determined as four experimental factors of orthogonal tests and each factor had three levels. Table 1 shows the experimental conditions for the preparation of the graphite oxide by the green synthesis. It was assumed that any two factors did not interact with each other. The orthogonal design table L9 (34), obtained by SPSS (Statistical Product and Service Solutions) software, was used for optimization the preparation conditions and test program is given in Table 2.
 |
 |
|
Note: the ratio of concentrated H2SO4 to H3PO4 was 9:1 (45 : 5 mL). |
2.2.3 Modified Hummers method
Graphite oxide was synthesized from the natural flake graphite according to a modified Hummers method. In detail, the 500 mL three-necked flask was placed in an ice bath, and the flake graphite (2.5 g), NaNO3 (1.25 g) and KMnO4 (7.5 g) were added slowly one by one to avoid sudden increase in temperature. Once mixed, the temperature of the mixture was kept to be below 15 °C by cooling and stirred for 3 h; successively, the mixture was stirred at 35 °C of water bath for 30 min. and then carefully diluted with 115 mL of deionized water to keep the temperature at 90 - 100 °C. When the temperature was below 85 °C, the flask was transferred to a 90 ± 5 °C of water bath and stirred for 60 min. After that, 175 mL of water was added. Shortly, 10 mL of 30% H2O2 was added to the mixture, turning the color of the mixture from dark brown to yellow. The warm solution was then filtered and washed with 5% HCl aqueous solution until SO42- was removed completely. The filter cake was then dispersed in water by mechanical agitation. Then, the above mixture was centrifuged to collect the bottom produce and repeatedly washed with deionezed water until the pH of the supernatant was neutral. Finally the material was dried at 60°C for 24 h and obtained a brown sample, which was called HGO.
2.3 Analysis of the Specimens
Fourier transform infrared spectroscopy (FT-IR) spectra between 4000 and 400 cm-1 were carried out with 4 cm-1 resolution on a Thermo Niocolet Fourier Transform Spectrum, using a KBr disk method. Powder X-ray diffraction (XRD) patterns were obtained with a Rigaku D/MAX-2200 diffraction using Ni-filtered Cu Kα radiation. Raman spectra were recorded using a micro-Raman spectroscopy (JY-HR800, the excitation wavelength at 514.5 nm). Ultraviolet-visible (UV-Vis) absorption spectra were measured on a Shimadzu UV-3101PC spectrophotometer.
3. RESULTS AND DISCUSSION
3.1 Optimization of preparation conditions
Since various parameters potentially affect the degree of oxidization of GO, the optimization of the experimental conditions is a critical step in the development of a green, safe , simple , and fully-oxidized GO preparation method. Based on the above considerations, the preparation parameters were optimized to obtain an efficient preparation of GO from natural flake graphite by the improved green preparation technology. According to the green preparation method of GO, these parameters including the quantity of graphite, the quantity of KMnO4, reaction time, and temperature are potentially the most important factors to influence the degree of oxidization of GO. In order to decrease test times, optimization of the suitable preparation conditions in the graphite oxide preparation can be carried out by using an experimental design. In the present study, all selected factors were examined by using an orthogonal [L9 (3)4] test design.
12.5 mg GO powder obtained from each test in the GO preparation by the green preparation method was accurately weighed, and was dispersed in 100 mL water to obtain a 0.125 g/L of GO dispersion. The dispersions with the same concentrations (except the sample of no.9, which concentration was 0.0625 g/L) were quantitatively analyzed by UV-Visible spectrophotometer and are presented in Figure. As could be seen from the Figure 1, two absorption bands around 227.5 nm and 292.5 nm appeared for all the samples except no.8; moreover, the intensity of these absorption bands showed increased gradually with the change of the preparation condition. Actually, the absorbance at the wavelength of 292.5 nm, a characteristic band of GO, was assigned to n—π* transitions of the carbonyl groups. The higher the intensity at 292.5 nm, the larger the degree of oxidation of GO. Therefore, the absorption band at 292.5 nm could be used as an indicator to estimate the degree of oxidation of GO. The test was carried out for three times.
 |
|
Figure 1. UV-Vis spectra of the different IGO prepared according to the L9 Orthogonal table. |
The results of the experiments are presented in Table 3 and the range analysis has been carried out on the basis of the evaluated values and the orthogonal experimental results to determine the optimal parameter combination. Thus, the K (total of the same level), k (average of the same level), and R (range) values are calculated and listed in Table 3. As could be seen from Table 3, the influences on the degree of oxidation of GO decreased in the order: reaction temperature > reaction time > the quantity of KMnO4 > the quantity of graphite according to the R values. The reaction time was found to be the most important determinant on the degree of oxidation of GO, and the quantity of graphite was the least important one. In other words, the optimum preparation conditions to obtain the maximum degree of oxidization of GO by the improved green synthesis method was that the reaction temperature was 40 ° C, the reaction time was 24 h, the quantity of KMnO4 was 2.25 g, and the quantity of graphite was 0.75 g, respectively.
 |
3.2 FT-IR spectra analysis
GO obtained at the optimal preparation condition by the green synthesis method was evaluated in comparison to modified Hummers' method. For clarity, the GO produced by the green synthesis and modified Hummers' method was named IGO and HGO, respectively.
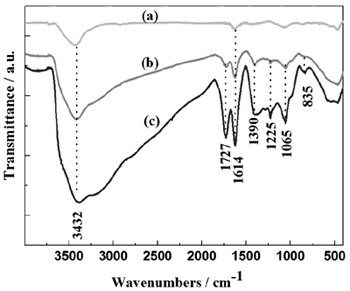
Fourier transform infrared spectroscopy (FT-IR) provides a powerful tool to determine the various oxygen-containing functional groups in the GO. Figure 2 shows the FT-IR absorption spectra of the graphite, IGO, and HGO in an equal concentration. In the spectrum of graphite, the absorption bands at 3432 cm-1 was known to be the O-H stretching vibrations; the peak located at 1614 cm-1 could be attributed to the skeletal vibration of C=C from unoxidized sp2 CC bonds. These bands were also found in IGO and HGO spectra. After the oxidation reaction, the FT-IR spectra of GO apparently changed compared to that of graphite. Apart from the O-H stretching vibrations and skeletal vibration, three new representative peaks arising from GO could be indexed at 1727 cm-1 , 1390 cm-1 , 1225 cm-1 , which corresponded to the stretching band of C=O in carboxylic acid moieties, C-OH, C-O-C, respectively. The FT-IR results indicated that oxygen-containing functional groups were introduced onto the surface of graphite by the green synthesis. Moreover, the absorption bands of the functional groups in IGO and HGO were essentially the same, indicating the similar structure for both samples. However, the intensity of the absorption bands in IGO was much higher than that in HGO, implying a higher fraction of well-oxidization in IGO. However, the delicate difference in FT-IR spectra was not observed by Marcano et al. [34].
 |
|
Figure 2. FT-IR spectra of the graphite (a), HGO (b), and IGO (c). |
3.3 XRD patterns analysis
The degree of oxidation of IGO and HGO was further investigated by powder X-ray diffraction (XRD). XRD patterns were sensitive to the interlaminar microenvironment, structure and oxidation state of layered materials. The changes observed in the interlayer spacing may be the indicative of the perturbation of the oxygen-containing functional groups bound to the graphite sheet. The XRD patterns of the graphite, IGO, and HGO are presented in Figure 3. The XRD pattern of the natural flake graphite exhibited peaks located at 26.5°, 44.3°, and 54.5° corresponding to planes (002), (101), and (004), respectively. The main peak (002) of both IGO and HGO was broader and lower in intensity than the natural flake graphite. Moreover, an apparent shift in the (002) peak position for the IGO and HGO illustrated larger interplanar d spacings. According to Bragg diffraction formula, the d spacings of IGO and HGO were 0.97 nm and 0.84 nm, respectively. Generally speaking, the interlayer spacing of the materials is proportional to the degree of oxidation. Therefore, it was reasonable to conclude that IGO was more oxidized than HGO, which was in accordance with that of FT-IR. Compared with the XRD pattern of IGO reported by Marcano et al. [34], the d spacing of our IGO prepared at the optimal preparation condition was slightly larger, indicating the larger oxidized degree in IGO.
 |
|
Figure 3. XRD patterns of the graphite (a), HGO (b), and IGO (c). |
3.4 Raman spectra analysis
Raman spectroscopy can provide qualitative information on the microstructure of carbon-based materials, which corresponds to the change of properties for graphite. The Raman spectra of graphite, IGO, and HGO are shown in Figure 4.
 |
|
Figure 4. Raman spectra of the graphite (a), IGO (b) and HGO (c). |
As shown in the Figure 4, the peaks around 1580 cm-1 (G-band) and 1350 cm-1 (D-band) were detected for the graphite, IGO, and HGO. The G-band around 1580 cm-1 was related to the vibration of sp2- bonded carbon atoms in a two-dimensional hexagonal lattice, such as in a graphitic layer. The D-band around 1350 cm-1 was associated with the vibration of disordered sp2-bonded carbon atoms [35]. These bands could be used to evaluate the extent of carbon-containing defects. The oxidization of the graphite equaled to increase the defects in the hexagonal graphitic layers. Therefore, the intensity of D-band was known to increase when GO was formed. It could be observed from Figure 4 that the intensity of D-band increased while that of the G-band decreased for the IGO and HGO, which undoubtedly conformed that oxygen-containing functional groups had been grafted on the surface of graphite by chemical oxidization [36].
The value of intensity ratio between the D- and G-bands (ID/IG) could be served as a measure of the microstructure of graphite sheets. Table 4 shows the relationship between ID/IG and samples. It could be seen that the value of ID/ IG increased greatly from graphite to GO, but slightly increased from HGO to IGO, which indicated a little alteration in the microstructure of HGO and IGO. The delicate difference of microstructure between HGO and IGO might result from the reservation of more aromatic rings in the basal planes of IGO than HGO, which was further proved by the UV-Visible absorption measurements. Marcano et al. concluded GO prepared by the green preparation method could retain more aromatic rings in the basal planes of IGO than HGO [34]. However, the delicate difference in Raman spectra could not be observed.
 |
3.5 UV-Vis spectra analysis
UV-Visible absorption (UV-Vis) bands were sensitive to the microenvironment, structure and oxidation state. Therefore, we performed UV-Vis absorption measurements on IGO and HGO to detect the delicate changes in the microstructure of sheets between HGO and IGO in the equal concentration (0.03 g/L). Generally, the degree of remaining conjugation in GO sheets could be determined by the λmax of UV-Vis spectrum. The more conjugated π—π* transitions, the less energy needs to be used for the electronic transition, which results in a higher λmax [37]. As shown in Figure 5, two absorption bands around 227.5 nm and 292.5 nm were observed for both the IGO and HGO. The peak located at 227.5 nm could be attributed to the conjugated π—π* transitions, and the shoulder centered at 292.5 nm was assigned to n—π* transitions of the carbonyl groups [38]. It was obviously that both IGO and HGO had a very similar λmax, which suggested that IGO and HGO were grossly similar in structure, as the Raman, IR, and XRD data indicated. However, IGO had a larger extinction coefficient than that of HGO, implying that the IGO had more aromatic rings or isolated aromatic domains retained. Consequently, the UV-Vis spectra confirmed that IGO retained more aromatic rings in the basal planes of IGO than that of HGO. The result was in accordance with that reported by Marcano et al. [34].
 |
|
Figure 5. UV-Vis spectra of the HGO (a) and IGO (b). |
4. CONCLUSIONS
In conclusions, a simple green preparation technique of IGO was proposed in this work, and IGO obtained by the improved green synthesis method showed significant advantages over the modified Hummers' method. The obtained GO was characterized by FT-IR, XRD, Raman, and UV-Vis techniques. The results suggested that the improved synthesis method could be advantageous for large-scale preparation of GO. The following conclusions could be drawn:
1. The optimal preparation conditions for the largest degree of oxidation of GO by the green synthesis method were determined by using an orthogonal [L9 (3)4] test design. And the optimum preparation conditions was that the reaction temperature was 40 ° C, the reaction time was 24 h, the quantity of KMnO4 was 2.25 g, and the quantity of graphite was 0.75 g, respectively.
2. IGO prepared at the optimal preparation conditions by the improved green synthesis method showed fewer defects in the basal plane and was more oxidized than HGO prepared by modified Hummers' method.
3. The improved green preparation simplified the postprocessing of IGO and showed larger oxidized degree than IGO prepared by Marcano et al..
ACKNOWLEDGEMENTS
This work was financially supported by National Natural Science Foundation of China (No. 21101058 and 21076063).
REFERENCES
1.- D. Chen, H. Feng and J. Li, Chem. Rev. 112, 6027, (2012).
2.- S. Bai and X. Shen, RSC Adv. 2, 64, (2012).
3.- S. Guo and S. Dong, Chem. Soc. Rev. 40, 2644, (2011).
4.- K. P. Loh, Q. Bao, P. K. Ang and J. Yang, J. Mater. Chem. 20, 2277, (2010).
5.- A. K. Geim and K. S. Novoselov, Nat. Mater. 6, 183, (2007).
6.- K. S. Novoselov, A. K. Geim, S. V. Morozov, D. Jiang, Y. Zhang, S. V. Dubonos, I. V. Grigorieva and A. A. Firsov, Science 306, 666, (2004).
7.- A.N. Obraztsov, Nat. Nanotechnol. 4, 212, (2009).
8.- C. Berger, Z. Song, X. Li, X. Wu, N. Brown, C. Naud, D. Mayou, T. Li, J. Hass, A. N. Marchenkov, E. H. Conrad, P. N. First and W. A. de Heer, Science 312, 1191, (2006).
9.- P. Blake, P.D. Brimicombe, R.R. Nair, T.J. Booth, D. Jiang, F. Schedin, L.A. Ponomarenko, S.V. Morozov, H.F. Glesson, E.W. Hill, A.K. Geim and K.S. Novoselov, Nano Lett. 8, 1704, (2008).
10.- C. Valles, C. Drummond, H. Saadaoui, C.A. Furtado, M. He, O. Roubeau, L. Ortolani, M. Monthioux and A. Penicaud, J. Am. Chem. Soc. 130, 15802, (2008).
11.- Y. Liang, D. Wu, X. Feng and K. Müllen, Adv. Mater. 21, 1679, (2009).
12.- J. Che, L. Shen and Y. Xiao, J. Mater. Chem. 20, 1722, (2010).
13.- X. Zhou and Z. Liu, Chem. Commun. 46, 2611, (2010).
14.- H. Yang, F. Li, C. Shan, D. Han, Q. Zhang, L. Niu and A. Ivaska, J. Mater. Chem. 19, 4632, (2009).
15.- Q. Su, S. Pang, V. Alijani, C. Li, X. Feng and K. Müllen, Adv. Mater. 21, 3191, (2009).
16.- S. De, P.J. King, M. Lotya A. O'Nell, E.M. Doherty, Y. Hernandez, G.S. Duesberg and J.N. Coleman, Small 6, 458, (2010).
17.- M. Lotya, Y. Hernandez, P. J. King, R. J. Smith, V. Nicolosi, L.S. Karlsson, F.M. Blighe, S. De, Z. M. Wang, I. T. McGovern, G. S. Duesberg and J. N. Coleman, J. Am.Chem. Soc. 131, 3611, (2009).
18.- M. Lotya, P. J. King, U. Khan, S. De and J. N. Coleman, ACS Nano 4, 3155, (2010).
19.- S. Das, A. S. Wajid, J. L. Shelburne, Y.-C. Liao and M. J. Green, Appl. Mater. Interfaces 3, 1844, (2011).
20.- J. Che, L. Shen and Y. Xiao, J. Mater. Chem. 20, 1722, (2010).
21.- W. S. Hummers and R. E. Offeman, J. Am. Chem. Soc. 80, 1339, (1958).
22.- S. Stankovich, D. A. Dikin, R. D. Piner, K. A. Kohlhaas, A. Kleinhammes, Y. Jia, Y. Wu, S. T. Nguyen and R. S. Ruoff, Carbon 45, 1558, (2007).
23.- X. Fan, W. Peng, Y. Li, X. Li, S. Wang, G. Zhang and F. Zhang. Adv. Mater. 20, 4490, (2008).
24.- S. Park, J. H. An, I.W. Jung, R. D. Piner, S. J. An, X. S. Li, A. Velamakanni and R. S. Ruoff, Nano. Lett. 9, 1593, (2009).
25.- D. R. Dreyer, S. Park, C. W. Bielawski and R. Ruoff, Chem. Soc. Rev. 39, 228, (2010).
26.- A. L. Higginbotham, J. R. Lomeda, A. B. Morgan and J. M. Tour, Appl. Mater. Interfaces 1, 2256, (2009).
27.- S. B. Yang, X. L. Feng, S. Ivanovici and K. Müllen, Angew. Chem., Int. Ed. 49, 8408, (2010).
28.- J. H. Shen, Y. H. Zhu, K. F. Zhou,X. L. Yang and C. Z. Li, J. Mater. Chem. 22, 545, (2012).
29.- D. Marquardt, C. Vollmer, R. Thomann, P. Steurer, R. Mülhaupt, E. Redel and C. Janiak, Carbon 49, 1326, (2011).
30.- Z. Liu, J. T. Robinson, X. Sun and H. Dai, J. Am. Chem. Soc. 130, 10876, (2008).
31.- B. C. Brodie, Philos. Trans. R. Soc. London 14, 249, (1859).
32.- L. Staudenmaier, Ber. Dtsch. Chem. Ges. 31, 1481, (1898).
33.- W. S. Hummers and R. E. Offeman, J. Am. Chem.Soc. 80, 1339, (1958).
34.- D. C. Marcano, D. V. Kosynkin, J. M. Berlin, A. Sinitskii, Z. Sun, A. Slesarev, L. B. Alemany, W. Lu and J. M. Tour, ACS Nano. 4, 4806, (2010).
35.- J. Qiu, G. Wang and C. Zhao, J. Nanopart. Res. 10, 659, (2008).
36.- M. Zhang, M. Yudasaka, A. Koshio and S. Iijima, Chem. Phys. Lett. 364, 420, (2002).
37.- Z.M. Wang, W. Wang, N. Coombs, N. Soheilnia and G. A. Ozin, ACS Nano 4, 7437, (2010).
38.- X. Gao, J. Jang and H. Nagase, J. Phys. Chem. C 114, 832, (2010).
(Received: March 5, 2013 - Accepted: April 18, 2013)

