Abstract
The performance of Li-O2 batteries is typically evaluated by specific capacity and cyclability in order to facilitate quantitative comparison in literature. The accuracy of such comparison is limited, however, due to the wide range of factors which control the reported specific capacities. These comparisons are not always fair as some factors, which can highly influence the obtained specific capacities, are often neglected. A rigorous and systematic study has been conducted in order to identify the isolated effect of diverse parameters on the performance of these promising batteries. The analysis of cells with different carbon contents reveals that the discharge reactions do not necessarily take place throughout the electrode mass, but instead occur preferentially in closest proximity to the oxygen gas-electrolyte interface. The effective activity of the cathode material is therefore reduced as distance from this interface increases. This work demonstrates that the lack of standardized measurement protocols hinders the rapid development of this technology due to the difficulties inherent in the direct comparison of cells with wide-ranging measurement conditions. In addition, it has been demonstrated that both the employed carbon loading and current rate critically affect cycling lifetime.
Export citation and abstract BibTeX RIS

This is an open access article distributed under the terms of the Creative Commons Attribution Non-Commercial No Derivatives 4.0 License (CC BY-NC-ND, http://creativecommons.org/licenses/by-nc-nd/4.0/), which permits non-commercial reuse, distribution, and reproduction in any medium, provided the original work is not changed in any way and is properly cited. For permission for commercial reuse, please email: oa@electrochem.org.
Lithium-oxygen (Li-O2) rechargeable batteries with organic electrolytes have recently received extraordinary attention due to their potential to provide high gravimetric energies (∼3500 Wh/kg based on the cell reaction, 2Li + O2 ↔ Li2O2; 2.96 V vs Li/Li+).1 Consequently, these batteries are considered one of the most promising candidates for high energy storage devices such as electric vehicles (EVs) or hybrid electric vehicles (HEVs), which have become of special interest due to the fossil fuel depletion and the demand of a cheaper, nontoxic and environmentally friendly energetic model. This technology is still however in its early stages and some challenges need to be overcome in order to make them commercially available.2–12 Although existing lithium-ion technology was initially adopted in order to start investigating these relatively new batteries, numerous problems reveal that this is not always suitable. For example, the carbonate based solvents, commonly used in Li-ion batteries,13 were not appropriate for Li-O2 batteries because of their susceptibility to nucleophilic attack by reduced O2− species.10,14–17
Li-O2 batteries usually consist of a lithium foil anode, a lithium salt dissolved in an organic solvent as electrolyte and a porous carbon-based cathode. During the discharge metallic lithium anode releases lithium ions (Li+) to the electrolyte, while electrons are transported to the cathode through an external circuit.
![Equation ([1])](https://content.cld.iop.org/journals/1945-7111/162/2/A3126/revision1/jes_162_2_A3126eqn1.jpg)
Meanwhile, oxygen molecules are reduced (oxygen reduction reaction, (ORR)) at the cathode.18
![Equation ([2])](https://content.cld.iop.org/journals/1945-7111/162/2/A3126/revision1/jes_162_2_A3126eqn2.jpg)
![Equation ([3])](https://content.cld.iop.org/journals/1945-7111/162/2/A3126/revision1/jes_162_2_A3126eqn3.jpg)
![Equation ([4])](https://content.cld.iop.org/journals/1945-7111/162/2/A3126/revision1/jes_162_2_A3126eqn4.jpg)
The global reaction taking place in the battery is:19,20
![Equation ([5])](https://content.cld.iop.org/journals/1945-7111/162/2/A3126/revision1/jes_162_2_A3126eqn5.jpg)
Solubility and diffusion rate of oxygen in the electrolyte play key roles in determining battery performance.21,22 Zhang et al. proposed a liquid-solid "two-phase reaction zone" where ORR occurs on the electrolyte-carbon interface.23 They claimed that the status of electrolyte-filling plays an essential role in the specific capacity and power capability in Li-O2 cells. The nanostructure of carbon also plays an important role in the performance of Li-O2 batteries. Several authors have reported an increase in the specific energy of these batteries with increasing carbon mesopore volume in the air electrode.24–26 In this sense, several approaches can be defined to improve oxygen diffusion across the electrode: (i) reduction of the electrode thickness in order to minimize the diffusion distance, and (ii) minimization of electrode pore overflow to allow the diffusion of oxygen.27 Local oxygen concentration was also found to be a limiting factor for ORR by Andrei et al.28 when they modeled, for the first time, the influence of oxygen diffusion and the distance from the O2/electrolyte interface. In addition, the type of carbon was also found to influence the electrochemical performance.29 They determined that some carbons have better mass transfer because of their moderate compatibility with the electrolyte and hardly blocked pore structure, achieving better use of the internal pores and the whole electrode volume. They also demonstrated that higher discharge capacities can be achieved by increasing oxygen partial pressure due to increased oxygen solubility in the electrolyte. The influence of the current density on the discharge capacity at different current densities (100–500 mA g−1), similar to the rate chosen for our experiments (90 mA g−1), was analyzed by Lu et al.,30 evidencing that oxygen solubility was not a limiting factor for a 20 μm thick electrode at low current density when DME was used as the electrolyte solvent. Finally, Nanda et al.31 reported neutron imaging and 3D computed tomography mapping of the discharge products and the air electrode. A non-uniform product distribution across the electrode thickness was shown with higher discharge product concentration in both edges of the air electrode. Recently Schied et al. highlighted the influence of the oxygen flooding mode on its homogeneity on the cathode profile.32
In this article, the specific capacities during discharge, with different carbon loadings, have been studied in order to compare the performance of different Li-O2 batteries. To date, no testing protocol has been established, making the comparison of results between different authors difficult. One of the main disagreements is related to the charge-discharge current density units, normally expressed as intensity per active mass (mA g−1) or intensity per electrode area (mA cm−2).33 In addition, the specific capacity is usually given by intensity and time per active material mass (mA h g−1), intensity and time per electrode area (mA h cm−2) or intensity and time (mA h). To calculate the capacity of the cathode, the carbon or catalyst/carbon loading are taken into account, assuming therefore that the reaction occurs on the entire electrode area. Several studies suggest that the active area of the electrode differs from its surface area which leads to underestimated values.34,35 In this work a rigorous and systematic study has been conducted in order to identify the isolated effect of diverse parameters on the performance of these promising batteries.
Experimental
The oxygen electrode consisted of carbon black (C-Nergy Super C-65) and PTFE (Sigma Aldrich) as the binder in a weight ratio of 90:10, with a surface area of 61 m2 g−1, as previously reported.36 Ethanol was used as the dispersing agent to form slurry that was kept under stirring overnight. The slurry was air-brushed over a stainless steel mesh (Alfa Aesar, 0.05 mm wire diameter), which works as current collector at the cathode side, and left drying at room temperature for a week in air. Finally, 10 mm diameter electrodes with carbon loadings between 0.20 and 1.32 mg were prepared and used in this study. Carbon loading was evaluated using a XP6 microbalance (Metler Toledo) with a resolution of ±1.0 μg.
Swagelok-type cells were used to perform the electrochemical measurements. Li-O2 cells were assembled with a lithium foil anode (10 mm in diameter), a glass fiber separator (Whatman), electrolyte (0.1M LiClO4 in DME, Sigma-Aldrich, 99.5%) and the oxygen electrode. A stainless steel mesh was used as the current collector. The cell assembly was carried out inside a glove box with Ar flux. For the electrochemical measurements, the cells were purged with dry O2 and pressurized to 1 atm. DME was distilled then further dried for several days over freshly activated molecular sieves (type 4Å) resulting in a final water content of < 10 ppm (determined using a Mettler-Toledo Karl Fischer titration apparatus). Prior to use, LiClO4 was dried with a Buchi oven by heating under vacuum at 120°C for 24 hours.
Electrochemical tests were conducted between 2 and 4.6 V at room temperature at 90 mA gcarbon−1 using a Biologic-sas VMP control potenciostat. The current density was systematically varied for the cyclability studies in order to analyze its influence on the battery performance. The specific testing conditions are detailed later in the cyclability section.
Discharge products were characterized by means of X-ray powder diffraction (XRD) using a Phillips PW1710 diffractometer with Cu Kα (k = 1.5418 Å) radiation. XRD pattern was recorded using a gastight sample holder to prevent reaction of Li2O2 with moisture and CO2. Diffractograms were recorded in the 20–60° 2θ range (0.02° step) and the obtained data were fitted using the FULLPROF program.37 The morphology of the electrodes and the reaction products were examined by scanning electron microscopy (SEM) using a SEM Quanta 200 FEG operated in low vacuum mode at an accelerating voltage of 20.0 kV. X-ray photoelectron spectroscopy (XPS) was performed in a SPECS (Berlin, Germany) system equipped with a Phoibos 150 1D-DLD analyzer and monochromatic Al Kα radiation (1486.6 eV). An initial analysis of the present elements was conducted at wide scan mode (step energy 1 eV, dwell time 0.1 s, pass energy 40 eV) and after that, high-resolution spectra of the found elements were acquired (step energy 0.1 eV, dwell time 0.1 s, pass energy 20 eV) with an electron take-off angle of 90°. The binding energy of the adventitious carbon (C1s) was set at 284.6 eV to correct sample charging. The spectra were fitted with the CasaXPS 2.3.16 software which models the Gauss-Lorentzian contributions after background subtraction (Shirley). The specific surface area (SSA) of the materials was measured by N2 adsorption-desorption isotherms at 77 K using a surface area analyzer (Micromeritics, ASAP 2020). Prior to the measurements, the C-65 commercial carbon and the C-65/PTFE (90:10) were degassed at 250°C for 3h and 130°C for 5h under vacuum (10−3 mbar), respectively. Brunauer-Emmett-Teller method (BET) was utilized to calculate the SSA, whereas mesopore size distributions were derived from the desorption branches of the isotherms based on the Barrett-Joyner-Halanda model (BJH).
Results and Discussion
Oxygen electrodes with varying carbon mass were prepared in order to compare their discharge performances in a Swagelok based Li-O2 cell. Table I summarizes the carbon loading for each sample, the applied current density and the first discharge specific capacity expressed in different units. The corresponding discharge profiles are shown in Figure 1. The onset potential is between 2.6 and 2.65 V and most of the discharge reactions take place between 2.68 and 2.5 V, similarly to those observed in the literature.5,38,39
Table I. Carbon mass loaded in each electrode, current density applied, and the respective specific capacity obtained after first discharge, expressed in different units.
| Sample | Carbon loaded [mg] | Current density [mA g−1] | Current density [mA cm−2] | Specific capacity [mA h g−1] | Specific capacity [mA h cm−2] | Specific capacity [mA h] |
|---|---|---|---|---|---|---|
| A | 0.45 | 90 | 0.0571 | 4822 | 2.75 | 2.16 |
| B | 0.96 | 90 | 0.1223 | 2751 | 3.36 | 2.64 |
| C | 1.01 | 90 | 0.1281 | 2587 | 3.31 | 2.60 |
| D | 1.11 | 90 | 0.1412 | 2363 | 3.34 | 2.62 |
| E | 1.32 | 90 | 0.1513 | 2101 | 3.53 | 2.77 |
| F | 0.71 | 135 | 0.1223 | 2991 | 2.80 | 2.20 |
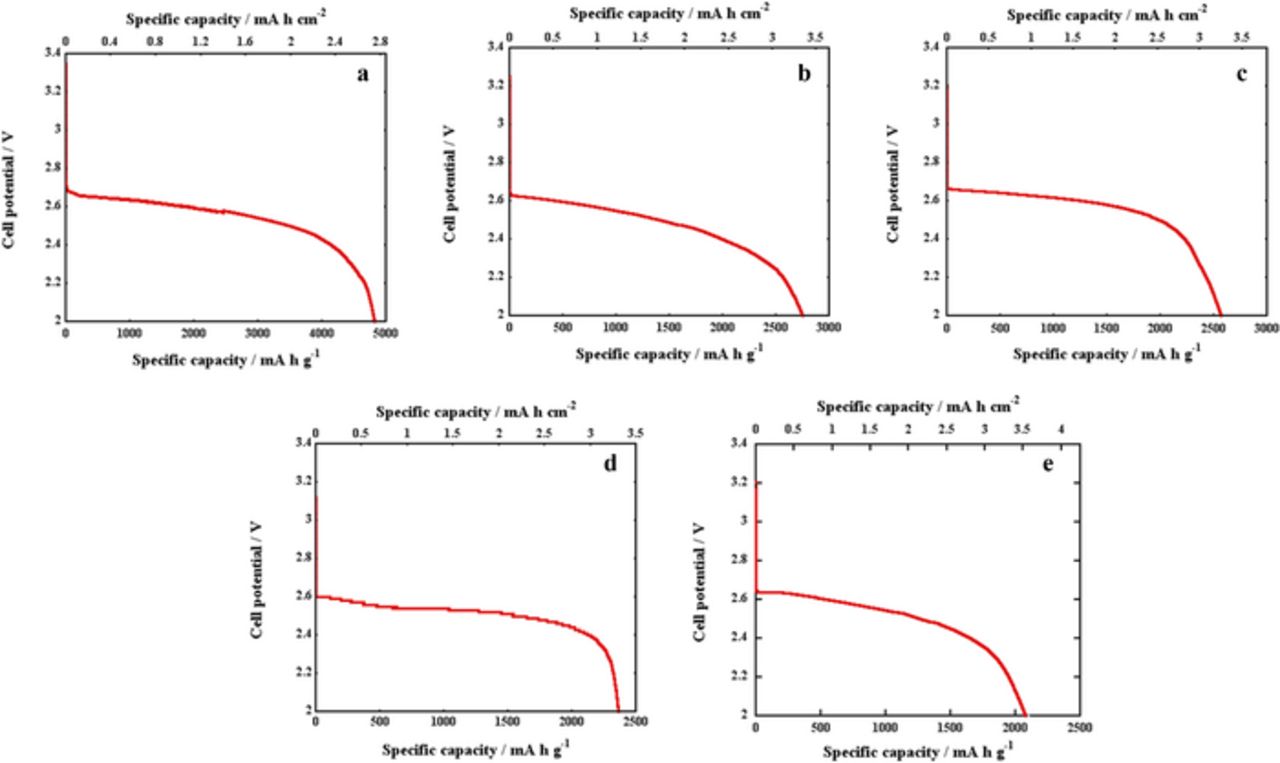
Figure 1. Voltage vs. specific capacity (mA h g−1 and mA h cm−2) of A, B, C, D and E electrodes discharged at 90 mA g−1.
When capacity is expressed in mA h g−1 sample A presents a better performance. As shown in Table I, specific capacity (mA h g−1) decreases as the mass of carbon increases. However, when current density is expressed in mA cm−2 and capacity in either mA h cm−2 or mA h units, the highest specific capacity is obtained for sample E, which corresponds to the highest carbon loading and current density.
Different specific capacities have been obtained for the electrodes. All electrodes were, however, cycled at the same intensity per carbon mass, suggesting that the entirety of the cathode material is not necessarily active. Furthermore, the fact that the thinner cathodes exhibit a higher specific capacity in mA h g−1 while the thicker electrodes present higher specific capacities in mA h cm−2 and mA h, evidences a difference on the ability toward ORR as the carbon amount increases. As previously mentioned, oxygen solubility is an important factor that influences the active electrode area in the discharge reaction. Figure 2a shows the schematic representation of the cathode before discharge. A significantly lower concentration of oxygen is observed at the electrode/separator interface due to limited oxygen mass transport to the reaction site in the liquid electrolyte present in the pores.23 Thus, oxygen concentration is higher at the O2/electrode interface and the concentration is reduced as the distance from this interface increases. Consequently, there are more oxygen molecules available for the ORR in the proximities of the O2/electrode interface. Therefore, discharge products are favorable formed in the proximities of the surface exposed to the stainless steel mesh compared to the surface exposed to the separator. The accumulation of discharge products at the O2/electrode interface leads to pore clogging (Figure 2b), resulting in the capacity fade observed in the final stages of the discharge profile shown in Figure 1.

Figure 2. Schematic representation of the oxygen electrode a) before discharge and b) after discharge.
In order to corroborate this point, an additional discharge (sample F in Table I) was performed. The current rate in mA cm−2 was the same as sample B (0.1223 mA cm−2), but with only half of the carbon mass, and consequently the current rate in mA g−1 significantly differs from sample B (90 vs. 135 mA g−1, respectively). A comparison of the discharge profiles is shown in Figure 3. The battery discharged at higher current density delivered lower specific capacity in mA h cm−2 units (Figure 3a). This trend, however, was inverted when specific capacity was expressed in mA h g−1. The reason lies in the fact that when the specific capacity of B is expressed in mA h g−1 non-active carbon mass is included in the capacity calculations, leading to an underestimation of its real capacity.

Figure 3. Voltage vs. specific capacity of B and F electrodes expressing the capacity in a) mA h cm−2 and b) mA h g−1.
A post-mortem analysis of the E electrode was conducted in order to prove this hypothesis. The choice of this electrode is due to its highest carbon loading among all the studied samples and, therefore, the effect of the oxygen solubility on the electrode/separator interface, due to the longer pathway of oxygen molecules to reach to this interface, should be more noticeable for this sample.
Figure 4a shows the XRD patterns (2θ = 20–60°) of the cathode after discharge and the protective polymer film used for the air-tight oxygen system. Strong reflections from the polymer film on the discharged electrode at 2θ = 21.7° and 26.7° make the characterization of the discharge products difficult. Consequently, Rietveld refinement was performed in a 2θ range between 30° and 60° in order to identify the discharge product structure (Figure 4b). Within this range, six distinct reflections (2θ = 32.92°, 34.99°, 47.31°, 48.83°, 58.78°, 58.83°) are found which correspond to the formation of hexagonal Li2O2 (JCPDS 74-0115). Additional reflections at 2θ ∼ 36.4°, 40.3° and 54.3° can be attributed to the polymer foil used in the air-tight system and, due to the absence of crystallographic information, have been excluded from the refinement. Furthermore, two reflections (2θ = 43.58°, 50.76°) from the stainless steel mesh were identified and taken into consideration. From the residual plot, a mismatch in the relative intensities of the Li2O2 reflections at lower diffraction angles becomes obvious, i.e. the first reflection at 2θ = 32.92° shows considerably lower intensity than expected. We attribute this observation to the electrode configuration in which the stainless steel mesh is located on top of the C-based electrode. As the measurement was conducted in Bragg-Brentano geometry, diffraction at lower angles was most likely influenced by the relative height of the materials. Thus, the stainless steel mesh acted as a physical barrier for part of the radiation diffracted by the Li2O2-phase leading to lower absolute intensities. At higher diffraction angles, this effect dissapears and a normal behavior of the intensities is observed. Hence, it can be concluded that Li2O2 is the main discharge product, and further evidence is provided in the following sections. It is also worth noting that no Li2CO3 side-reaction product was observed although it is widely accepted that the Li2O2 formed during the discharge process can subsequently react with the electrolyte leading to the formation of Li2CO3.39–41 In addition, it must be noted that the carbonate formation can be also associated to the instability of the carbon electrode.42 SEM was used to locate the discharge products.

Figure 4. a) XRD diffraction pattern of the protective polymer film and the discharged electrode; b) Fitted diffraction profile of the electrode showing observed (red line), calculated (black line) and difference (lower line) profiles (* corresponds to diffraction reflections of protective polymer film).
Discharge products accumulated in the O2-electrode interface are shown in Figure 5. Toroidal-shaped characteristic Li2O2 particles with a diameter of 2–3 μm are found. This type of discharge product has been widely described by several authors38,43–45 at low discharge rate currents. Recently Aetukuri et al.46 attributed this discharge product morphology to the presence of water in the electrolyte when DME solvent was used. Nevertheless, water content in the electrolyte was controlled to be less than 10 ppm by Karl Fisher measurements. In addition, toroidal-shaped discharge products observed by Aekuturi et al.46 can be described as aggregates of flat discs forming toroid-like structures which differ from those in Figure 5. No discharge products were observed on the electrode-separator interface which supports our hypothesis. As previously discussed, Lu et al.30 reported that an electrode with a 20 μm thickness was fully active, using DME as electrolyte solvent. Our results suggest that this does not happen when thicker electrodes are used. 3D computed tomography mapping of the lithium discharge products and air electrode reported by Nanda et al.31 show, however, that the discharge products appear at both the O2/electrode and electrode/separator interface. The authors attribute this phenomenon to the low discharge current density (5 μA cm−2). In our study, discharge products do not appear at the electrode/separator interface and the concentration is reduced as the distance from the O2/electrode interface increases, in good agreement with the simulations reported by Andrei et al.28 In order to definitely compare the activity toward ORR of these two surfaces by the accumulation of the discharge products XPS measurements were carried out. The results are shown in Figure 6.

Figure 5. SEM images of different toroid-shaped Li2O2 particles formed on the O2-electrode interface.

Figure 6. XPS data collected on the E discharged electrode surface exposed to a) the stainless steel mesh and b) the separator. Continuous lines denote the experimental data (blue), the different contributions of each spectrum (gray) and the background (black), while the open circles are referred to the attained fit.
Figure 6a shows the XPS spectrum at the O2/electrode interface. The presence of the Li2O2 discharge product detected by XRD was confirmed at the O2/electrode interface at ∼56 eV in the Li 1s spectra. The existence of Li2CO3 (at ∼290 eV in the C 1s spectra) in the interface was also found. On the other hand, in Figure 6b at the electrode/separator interface no discharge product (Li2O2) or side reaction (Li2CO3) products were detected, proving the inactivity of this surface. In summary, the XPS measurements confirm that the positive electrode shows different activity toward ORR in each surface, consistent with the SEM analysis. Thus, it can be concluded that the activity of the cathode toward ORR is reduced as the distance from the oxygen gas-electrolyte interface is increased.
Finally, the effect of carbon loading and current rate on the cyclability was evaluated. Electrodes loaded with 0.2 and 0.4 mg of carbon were cycled in the voltage window of 2–4.5 V with a fixed discharge capacity of 0.235 mA h cm−2 at a current rate of 0.045 mA cm−2 (Figure 7a). The battery loaded with higher carbon mass was able to perform 21 cycles before capacity fade while the battery loaded with 0.2 mg of carbon was only able to perform 11 cycles. This could be attributed to the blocking of the active area with increasing cycle numbers due to the non-reversibility of the side products. As previously discussed, the entire electrode is not active for ORR during the first discharge as the Li2O2 mainly forms at the oxygen/electrode interface where the oxygen concentration is higher,4 filling the pores of the carbon particles. The formed toroid-shaped products gradually block the oxygen diffusion paths into the interior of the cathode leading to incomplete utilization of the cathode pore volume. However, during charge the formation of insulator products (e.g. Li2CO3) could result in a partial pore blocking avoiding the restriction of the ORR to the top of the oxygen side of the electrode.47 The formation of Li2O2 even at the cathode/separator interface of the thicker electrodes can therefore occur (see Figure 8). Finally, the progressive accumulation of side products results in the capacity fade where thicker electrodes are able to deliver the selected specific capacity during higher number of cycles. In addition, batteries with similar carbon loadings (0.4 mg) were cycled at different current rates (0.045, 0.090 and 0.225 mA g−1) with a fixed discharge capacity of 0.235 mA h cm−2 (Figure 7b). It was confirmed that low current rates enhance the lifetime of the battery, as lifetime in the battery cycled at 0.045 mA cm−2 was over 4 times the battery cycled at 0.225 mA cm−2. This fact can be ascribed to two factors. First, higher discharge rates lead to larger gradient of the oxygen concentration across the carbon cathode, which restricts the reaction to the region close to the gas phase/cathode interface.4 Second, the difficulties for removing discharge products at higher current densities, as has been demonstrated by Adams et al.38 and Wang et al.,48 are expected to reinforce this decrease on the performance.

Figure 7. Comparison of the cycling performance of cells with a fixed discharge capacity of 0.235 mA h cm−2 in the voltage range of 2 and 4.5 V (a) with 0.2 (blue) and 0.4 (red) mg of carbon loaded on the oxygen electrode at a current rate of 0.045 mA cm−2 and (b) using electrodes of the same mass (0.4 mg) cycled at 0.225 (green), 0.090 (blue) and 0.045 (red) mA cm−2.
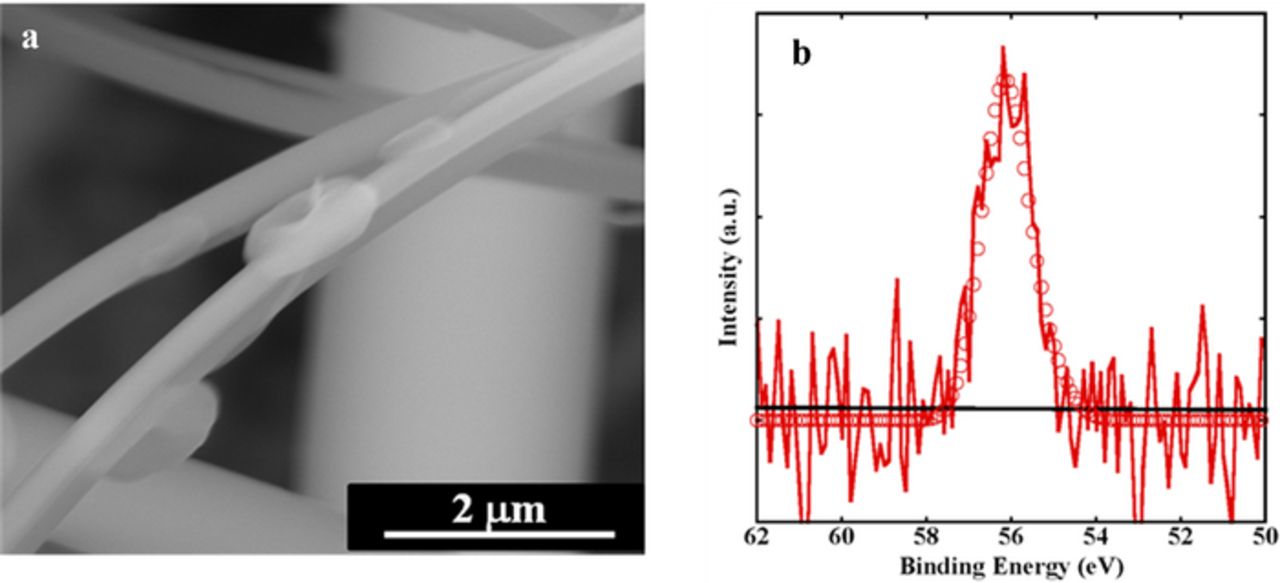
Figure 8. a) SEM images of the toroid-shaped Li2O2 particles formed on the separator-electrode interface after several cycles; b) Li 1s spectra of the separator-electrode interface after several cycles. Continuous lines denote the experimental data (red), and the background (black), while the open circles are referred to the attained fit.
Conclusions
It has been demonstrated by means of SEM and XPS that discharge reaction occurs mainly at the oxygen gas-electrolyte interface. The percentage of active area in the cathode material for ORR is reduced as the distance from the O2/electrode interface increases due to limited oxygen mass transport to the reaction site in the liquid electrolyte present in the pores. The specific capacity expressed in mA h g−1 is directly related to the mass loaded onto the cathode. In addition, ORR and discharge product accumulation has been demonstrated not to occur in the entire C-65 electrode area in a DME-based electrolyte at 90 mA g−1. Consequently, if expressed in mA h g−1, the capacity will be underestimated for thicker cathodes, as the reaction occurs to less extent in the rest of the cathode. Thus, reducing the cathode thickness to the most active area results in higher specific capacities expressed in mA h g−1. However, this cannot be considered as a better performance and comparison of our results with those reported in literature is not possible due to the lack of electrochemical and electrode data. ORR takes place throughout the cathode but to different extents as shown by the increase in capacity (mA h cm−2 or mA h) with carbon loading. Finally, it has been confirmed that the increase of the current rate and decrease of the carbon loading lead to earlier battery death.
This work demonstrates that even though specific capacity is an important parameter for real-world batteries that should not be the goal of fundamental materials research due to the wide variations observed in the same material with small differences in carbon loading and measurement conditions.
Acknowledgments
This work has been partially financed by the Ministerio de Educación y Ciencia under project MAT2010-19442 and MAT2013-41128-R and by the Eusko Jaurlaritza/Gobierno Vasco under projects IT-570-13, SAIOTEK (S-PE11UN064 and S-PE12UN140) and ETORTEK (ENERGIGUNE'12 - IE12–335). I. Landa-Medrano thanks the Universidad del País Vasco (UPV/EHU) for his predoctoral fellowship. R. Pinedo thanks the Universidad del País Vasco (UPV/EHU) for funding his research activities under the "Especialización de Personal Investigador del Vicerrectorado de Investigación de la UPV/EHU" programme. N. Ortiz-Vitoriano acknowledges a Marie Curie International Outgoing Fellowship within the EU Seventh Framework Programme for Research and Technological Development (2007–2013). The authors gratefully acknowledge Dr. Karthik Mani and Edurne Redondo for the BET measurements and Begoña Acebedo and Egoitz Martin for the SEM and XRD measurements, all of them from the CIC Energigune. In addition, authors thank Dr. María Belén Sánchez from SGIker of UPV/EHU for the XPS measurements.