
Abstract
Quantifying water implications of energy transitions is important for assessing long-term freshwater sustainability since large volumes of water are currently used throughout the energy sector. In this paper, we assess direct global energy sector water use and thermal water pollution across a broad range of energy system transformation pathways to assess water impacts of a 2 °C climate policy. A global integrated assessment model is equipped with the capabilities to account for the water impacts of technologies located throughout the energy supply chain. The model framework is applied across a broad range of 2 °C scenarios to highlight long-term water impact uncertainties over the 21st century. We find that water implications vary significantly across scenarios, and that adaptation in power plant cooling technology can considerably reduce global freshwater withdrawals and thermal pollution. Global freshwater consumption increases across all of the investigated 2 °C scenarios as a result of rapidly expanding electricity demand in developing regions and the prevalence of freshwater-cooled thermal power generation. Reducing energy demand emerges as a robust strategy for water conservation, and enables increased technological flexibility on the supply side to fulfill ambitious climate objectives. The results underscore the importance of an integrated approach when developing water, energy, and climate policy, especially in regions where rapid growth in both energy and water demands is anticipated.

Original content from this work may be used under the terms of the Creative Commons Attribution 3.0 licence. Any further distribution of this work must maintain attribution to the author(s) and the title of the work, journal citation and DOI.
1. Introduction
Access to water in the energy sector is crucial for resource extraction, fuel processing, and electric power generation (Mielke et al 2010, Macknick et al 2012a). The volume of water used directly in the energy sector is considerable, representing approximately 15% of global freshwater withdrawals in 2010 (Flörke et al 2013, IEA 2012). The scale of energy sector water demand exerts pressure on the global hydrological cycle (Döll et al 2012), and could cause allocation conflicts with the agricultural, manufacturing and domestic sectors in areas facing water shortages (Wimmer et al 2015). Future energy system transformations are thus important to consider when assessing the long-term sustainability of water resources.
Limiting global mean temperature change over pre-industrial levels to 2 °C will require a complete transformation of the global energy system (Riahi et al 2012, Kriegler et al 2014). Although the 2 °C temperature target is clearly framed, the specific characteristics of the required energy system transition may differ significantly (Riahi et al 2012, Kriegler et al 2014). As water impacts vary across energy technology options (Mielke et al 2010, Macknick et al 2012a), quantification of the associated water use uncertainties for a large range of energy transition scenarios is needed to accurately assess future risks to water resources.
The aim of this paper is to quantify direct energy sector water impacts globally across a broad range of energy system transformation pathways under a 2 °C climate policy. Previous analysis at both the regional and global-scale focused mainly on low-carbon electricity generation pathways (Macknick et al 2012b, Davies et al 2013, Kyle et al 2013, Webster et al 2013, Bouckaert et al 2014, Byers et al 2014, Cameron et al 2014). These studies highlight the sensitivity of water withdrawal and consumption to technology choice, and the potential benefits of deployment strategies that simultaneously reduce electricity sector water use and emissions. In this paper, we enhance a global integrated assessment model with the capabilities to track water withdrawal and consumption across the energy supply chain (extraction, fuel processing, electricity generation and heat production). Moreover, we perform a prospective analysis of thermal water pollution from thermoelectric power plants, which poses a threat to aquatic ecosystems (Chuang et al 2009, Stewart et al 2013), and to date, has not been assessed globally. We further quantify sensitivities arising from shifts in power sector cooling technologies and energy demands. The analysis provides important insight into how energy transitions consistent with a 2 °C climate policy influence regional and global water trends, and the associated uncertainties.
The paper proceeds as follows. In section 2 we describe the energy transformation pathways investigated and the methodology for identifying the water impacts (withdrawal, consumption and thermal pollution) of different energy technologies. Results from the scenario analysis are presented in section 3, which focus on global and regional outcomes obtained across the scenarios and water impact uncertainties due to model parameterization. A discussion of results and main conclusions are provided in section 4.
2. Methods
2.1. Energy system transformation pathways
We quantify the water impact of energy system transformation pathways developed in the global energy assessment (GEA) (Riahi et al 2012). The GEA pathways were designed to describe transformative changes toward a more sustainable future, and include a 2 °C climate policy. We chose the GEA scenarios for our analysis because the broad range of energy transitions covered by the scenario space provides an ideal platform to assess uncertainties in future water demand stemming from technology choices made in the energy sector.
Each GEA energy transformation pathway is defined by a unique combination of branching points summarized in figure 1. Three pathway groups are initially distinguished by level of energy demand: GEA-Efficiency, which emphasizes demand-side and efficiency improvements at a relatively low demand-level; GEA-Supply, which emphasizes supply side transformation at relatively high energy demand; and GEA-Mix, which emphasizes regional diversity at an intermediate level of energy demand. Further scenario branching points account for differences in the progression of the transportation system. Advanced transportation scenarios involve accelerated diffusion of electric and hydrogen vehicle technologies, while a conventional transport pathway entails continued use of liquid fuels. The pathway groups contain further scenarios that explore alternative transformations on the supply side. These scenarios restrict development of particular technology options to test the relative importance of technology availability in fulfilling the 2 °C climate policy objective.
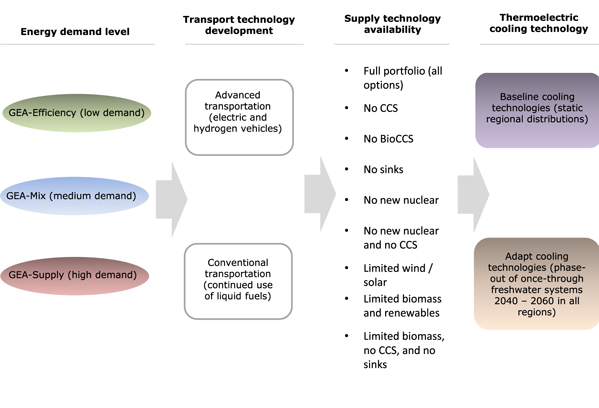
Figure 1. Scenario components of the 2 °C pathways considered. A single pathway is defined by combining one component from each column. A total of 41 scenarios are found to fulfill the 2 °C objective (Riahi et al 2012), resulting in 82 water impact scenarios. A reference case representing a situation where no climate policy is implemented (i.e., unconstrained emissions) is also analyzed, and corresponds with the GEA-Mix demand-level, conventional transport development, and full portfolio supply technology availability.
Download figure:
Standard image High-resolution imageThe GEA energy transformation pathways explored in the analysis are generated with the global integrated assessment model for energy supply systems and their general environmental (MESSAGE) impact: a linear systems-engineering optimization model that solves for the energy technology portfolio and land-based mitigation measures in 11 global regions over a planning horizon spanning the 21st century (supplementary information, section S1) (Strubegger et al 2004, Riahi et al 2007, 2012). MESSAGE is used in conjunction with model for greenhouse gas induced climate change (MAGICC) for calculating internally consistent scenarios for limiting 21st century global mean temperature change to 2 °C with a probability exceeding 50% (Wigley and Raper 2001, Rogelj et al 2013a). Some scenario branching points lead to infeasibility in terms of reaching a 2 °C temperature target, with a total of 41 scenarios found to fulfill the climate policy objective. This scenario space spans a much larger range than previous global assessments (Davies et al 2013, Kyle et al 2013), and thus the analysis here provides a more detailed view of potential water impact uncertainties arising from different energy transformation pathways.
2.2. Water impact assessment
We adapt the MESSAGE IAM framework to calculate the energy sector water impacts of the GEA transformation pathways. The majority of energy sector freshwater withdrawal occurs in the steam-cycle and cooling systems of thermoelectric generation (IEA 2012, Flörke et al 2013), and we assess water use by thermoelectric power plants included in the IAM as a function of the thermal conversion efficiency. The following equation is used to express water withdrawal or consumption intensity i (e.g., m3 kWh−1 net power output) as a function of heat-rate (how efficiently the plant converts heat to electricity), and cooling system type (Delgado and Herzog 2012):

where  represents the heat-rate (kWh heat/kWh net power output), α represents how efficiently the cooling technology utilizes water (m3 kWh−1 heat), β represents other heat outputs (heat content of electricity and other heat losses such as with flue gases; kWh heat/kWh net power output), and δ represents water requirements other than for cooling (m3 kWh−1 net power output). The parameter α varies across cooling technologies, and is calculated using a physically-based approach that relates the amount of water withdrawn or consumed to how the cooling system circulates water and the allowed increase in effluent temperature (Delgado and Herzog 2012). Once-through and closed-loop cooling technologies are distinguished in this context. Once-through cooling technology, as the name suggests, involve passing water through the cooling system once, and then returning the water to its source. Conversely, closed-loop systems re-circulate water that is withdrawn. The water source (fresh or saline) is further distinguished across technologies. We also consider air-cooled systems, which provide an opportunity to reduce energy system reliance on water.
This choice of model formulation enables consistent representation of water use across power plant types and incorporates water impacts of heat-rate improvements due to anticipated long-term technological change. Moreover, the approach enables analysis of thermal water pollution from once-through cooled thermal power plants by allowing quantification of the heat energy embodied in cooling system effluents. Specifically, we treat all heat energy remaining after electricity conversion and air emissions as thermal water pollution (i.e.,  for once-through systems). We parameterize the thermal power plant water impact model following the analysis in Delgado and Herzog (2012). The calculated water intensities are provided as online supplementary data, and were compared with literature estimates and good agreement was found across sources and technologies (supplementary information, figure S2.1). The calculated withdrawal and consumption intensities are multiplied by the optimized power plant activity in each model year to estimate the regional water demands. All cooling technology parameters other than the power plant heat-rate are fixed across the simulation horizon.
Two cooling technology scenarios are distinguished in which future shifts in cooling technology shares are exogenously defined (figure 1). The alternative cooling technology scenarios are used to demonstrate the potential sensitivity of the results to cooling technology assumptions, and to explore tradeoffs between climate and water sustainability objectives. In the first scenario, entitled ‘baseline cooling technologies’, the future cooling technology distribution for each generation technology is initially fixed across the simulation horizon and in each region based on the current global shares assessed by Davies et al (2013) (supplementary material, section S3). Although the distributions are fixed in each region for each technology, investment into alternative technology portfolios can change the distribution of cooling technologies in future years when aggregated to the regional-scale.
In the second scenario, entitled ‘adapt cooling technologies’, opportunities to address freshwater challenges in the energy sector through the adoption of alternative cooling technologies and water sources are examined. Specifically, once-through freshwater cooling systems are phased out over the 2040 to 2060 period and replaced with a combination of air and seawater cooling technologies. Closed-loop cooling technologies consume more water than once-through technologies (supplementary information, section S2), making a transition towards seawater and air-cooled technologies essential to improving consumption intensity; however, it is important to note that the consumption volume for closed-loop systems is about 1% of the withdrawal volume at equivalent once-through systems. The phase-out of once-through systems and shift towards air cooling and seawater technology is not meant to represent the optimal strategy. Instead, we use the transition towards air cooling to highlight potential efficiency tradeoffs (Turchi et al 2010, Zhai et al 2011). Moreover, we use the transition to seawater cooling technology to demonstrate the tradeoffs with marine thermal pollution. The policy is simulated by forcing the regional shares of once-through freshwater systems to zero along a linear trajectory, with 90% of the affected capacity transitioned to air-cooling and 10% to seawater cooling. The regional shares of closed-loop freshwater systems remain fixed for each technology over the simulation period. Less capacity is transitioned to seawater cooling because these systems thermally pollute the marine environment. The timeframe for the transition is selected because it aligns with the expected ramp-up in capacity investment resulting from retirements of existing and planned infrastructure. Average efficiency losses due to air-cooling are estimated for each technology (supplementary information section S3). Seawater cooling also potentially requires extra energy for water treatment and maintenance, although these effects are excluded due to lack of suitable data.
Water impacts of other energy technologies included in the analysis (non-thermal power plants and fuel processing/resource extraction technologies) are calculated with operational water coefficients. These parameters describe the average amount of water withdrawn or consumed per unit of technology output, and are estimated based on a comprehensive review of previous studies (supplementary information, section S2). The implemented coefficients are included as online Supplementary Data. Regional freshwater consumption and withdrawal from these technologies are then calculated by multiplying the corresponding water coefficient by the optimized technology activity in each model year. Literature estimates vary considerably due to a combination of technology vintages, local climate conditions, system configurations, and reporting methods (Macknick et al 2012a). We explore these uncertainties by conducting a sensitivity analysis across the range of reported values.
2.3. Limitations
Our analysis excludes differences in cooling technology costs, which are likely to impact the economics of climate change mitigation pathways (Webster et al 2013, Tidwell et al 2014). Constraints on the availability and quality of water resources (e.g., water temperature) pose risks to energy supply reliability and vary significantly across the macro-regions under study (van Vliet et al 2013), but are also excluded in the model. These characteristics are difficult to emulate in a global optimization model due to water constraints occurring at relatively small temporal and spatial scales (Sun et al 2015). Furthermore, our analysis does not include the potential irrigation water used for bioenergy feedstock cultivation (Gerbens-Leenes et al 2009). However, the bioenergy included in our assessment considers a number of different sustainability constraints that promote use of short-term woody crops grown in areas not requiring irrigation (Riahi et al 2007, van Vuuren et al 2009). The precipitation incorporated into the biomass could be significant (Gerbens-Leenes et al 2009), and increased land area needed to cultivate these crops could push other irrigated crops into areas requiring increased irrigation, but these effects occurring upstream from the energy sector are excluded.
3. Results
3.1. Influence of technological pathway on global water trends
Figure 2 depicts the global water withdrawal, consumption and thermal pollution associated with the two different cooling technology scenarios across a selected set of 2 °C energy transformation pathways (GEA-Mix), a reference scenario (no climate policy), and uncertainty ranges across all 2 °C scenarios tested. Despite increasing electricity demand, global water withdrawals remain relatively steady out to 2040 as a result of the improvements in withdrawal intensity that accompany a shift from steam- to combined-cycle fossil-based power generation (Davies et al 2013, Kyle et al 2013, Tidwell et al 2014). After 2040, withdrawals diverge substantially. In the ‘baseline cooling technologies’ scenario, we find that cases consistent with 2 °C result in end-of-century withdrawals changing between −10% and 611% relative to base year (2000) conditions (figure 2(A)). Once-through cooled thermal power generation remains the dominant source of water withdrawal across the mitigation scenarios due to the current prevalence of the technologies in regional shares. The proportional relationship derived between once-through withdrawals and thermal pollution means that similar trends for thermal pollution are obtained (increases between −54% and 638% relative to base year conditions). The wide range in results is a consequence of the large differences in withdrawal intensity observed across the low-carbon energy technologies (supplementary information, figure S2.1), and the various combinations of technologies commensurate with 2 °C. For example, nuclear, carbon capture and storage (CCS), and concentrating solar power (CSP) technologies are associated with very low carbon emissions, but can require significant water for cooling or processing. Conversely, low-carbon technologies such as wind and solar PV have very low water requirements.
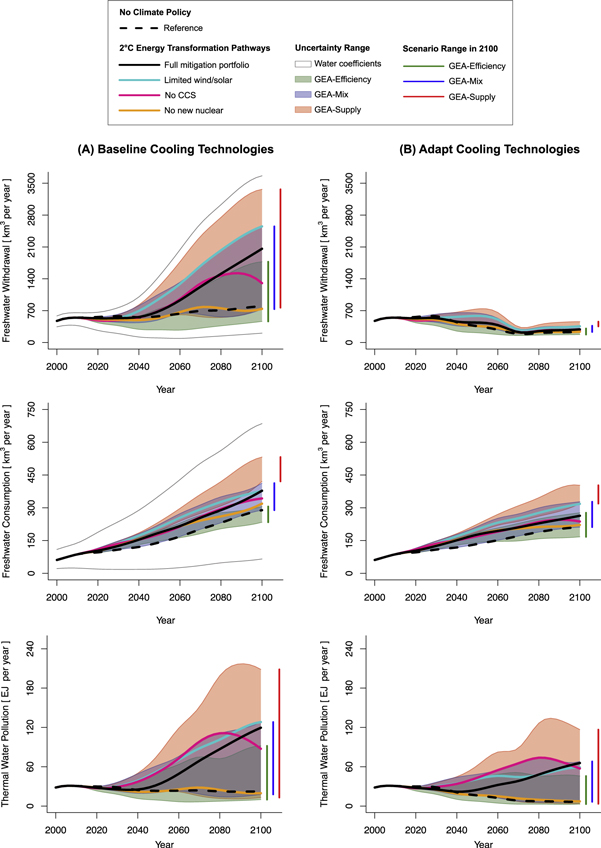
Figure 2. Global water impacts across the 2 °C and reference scenarios for the two thermal power plant cooling technology cases: (A) baseline cooling technologies; and (B) adapt cooling technologies. Individual scenario results are illustrated for a subset of climate change mitigation and reference scenarios with intermediate energy demand (GEA-Mix). The full range of water impacts associated with all technology scenarios are illustrated for each energy demand assumption (GEA-Efficiency, GEA-Mix, and GEA-Supply). The additional range resulting from the maximum and minimum reported water intensity coefficients are indicated by gray lines.
Download figure:
Standard image High-resolution imageIn the ‘adapt cooling technologies’ scenario (i.e., phase-out of once-through freshwater systems over the 2040 to 2060 period), freshwater withdrawals decrease across all scenarios after 2040 and much less uncertainty is observed (−3% to −63% of base year levels in 2100) (figure 2(B)). Thermal pollution is less affected than freshwater withdrawal (−89% to 312% of base year levels in 2100), as the capacity transferred to seawater cooling thermally pollutes the marine environment.
Different patterns are observed in the results for global water consumption, which show increasing requirements across all scenarios (215%–747% increase relative to the base-year). Freshwater consumption levels reduce slightly in the ‘adapt cooling technology’ scenario compared to the baseline case (146%–543% increase relative to base year levels) due to the increased use of air and seawater cooling. However, even in the adaptation scenarios, freshwater consumption continues to expand as closed-loop cooling systems continue to be used to meet the growing electricity demand. More broadly, the growth in freshwater consumption follows from the increasingly important role of electricity in climate change mitigation scenarios. Electrification of end-use is a common mitigation theme in the GEA scenarios, leading to increased global electricity demand (Riahi et al 2012). The prevalence of freshwater-cooled CCS, nuclear, and CSP, as well as hydropower across the different scenarios makes electricity more water consumption-intensive than conventional liquid and solid fuels at the final energy-level. This would suggest that although electrification is likely to improve energy intensity and enable access to low-cost, low-carbon energy technologies (Riahi et al 2012), there are concurrent increases in water consumption anticipated in the GEA scenarios. Less variability is observed across consumption scenarios as compared to withdrawal because the water consumption intensity varies less among the low-carbon electricity generation options prevalent in the GEA scenarios (i.e., CCS, CSP, nuclear and hydropower) (supplementary information, figure S2.1).
The majority of mitigation pathways are found to exceed the projected water demand (withdrawal and consumption) and thermal pollution under the reference scenario (no climate policy). The reference case uses less water due to expansion of combined-cycle natural gas power plants when climate constraints are excluded. Mitigation scenarios limiting expansion of nuclear and CCS technologies result in the lowest water impacts, but also some of the highest expected mitigation costs (Riahi et al 2012). Hydropower and CSP encompass most of the remaining consumption and thermal pollution in the scenarios involving limited CCS and nuclear. Evaporation associated with storing water in hydropower reservoirs constitutes the largest component of base year water consumption (59%), with expanding nuclear, CCS, and CSP generation dominating the increased global requirements projected in future years. Water consumed during the extraction and processing of coal and oil resources decreases significantly across the mitigation scenarios that limit CCS deployment. Freshwater consumed for natural gas extraction and processing expands to levels currently seen for coal resources by mid-century (reflecting a switch from coal to gas), and reduces thereafter to enable emission levels consistent with 2 °C. Extraction and processing water use represents a relatively small fraction of total sector demand (19% of total energy sector consumption in the base year), with the projected reductions having little impact on aggregate energy sector water use. Nevertheless, there are concomitant water quality benefits of reduced fossil fuel extraction that are excluded from this analysis and important to consider in future research.
Further depicted in figure 2 is the uncertainty range obtained from varying the technology-level water withdrawal and consumption coefficients estimated from the reviewed performance data (online supplementary data). For withdrawals, the uncertainty due to technology parameterization is found to be relatively minor in comparison to the range obtained across the GEA scenarios. In contrast, the uncertainties associated with water consumption coefficients are much larger. The consumption of hydropower generation is the main contributor to this uncertainty as it is difficult to accurately assess and attribute consumption to electricity production, especially for multi-purpose reservoirs where water is stored for different economic purposes.
3.2. Cumulative impacts of cooling technology adaptation
The ‘adapt cooling technologies’ scenario displays significant water benefits, but affects electricity production due to air-cooling efficiency losses. Cumulative impacts of the alternative cooling technology scenario for selected energy technology portfolios are depicted in figure 3. We find that transitioning towards increased air and sea water cooling would reduce the full portfolio cumulative freshwater withdrawal over the 2040 to 2100 period by 74%, thermal pollution by 41%, and freshwater consumption by 19%. Tradeoffs come in the form of increased cumulative global electricity production requirements of 3%. Similar results are obtained for the other selected scenarios. The limited wind/solar scenario displays the largest water benefit from transitioning to alternative cooling technologies due to the high-penetration of nuclear and CCS generation.
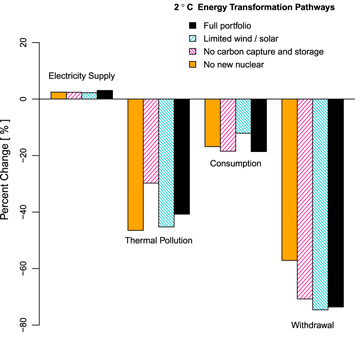
Figure 3. Cumulative impact of the ‘adapt cooling technologies’ scenario (i.e., phase-out of freshwater once-through systems) calculated from 2040 to 2100 across four of the representative technology portfolios. The percent change is calculated relative to the ‘baseline cooling technologies’ scenario (i.e., fixed cooling technology distribution for each power plant technology).
Download figure:
Standard image High-resolution image3.3. Influence of energy demand
Comparing the results for the ‘baseline cooling technologies’ scenario obtained across the different demand levels reveals that moving from the mid-demand (GEA-Mix) full mitigation portfolio to a low energy demand scenario (GEA-Efficiency) results in a 45% reduction in end-of-century withdrawals, 63% reduction in thermal pollution, and 28% reduction in consumption. Comparable reductions are obtained across the other technology scenarios, and suggest a critical role for end-use energy efficiency in global water conservation. Water inputs are required during the transformation of energy resources into useful services. As lower demands reduce the need for resource transformation, measures limiting energy demand growth (e.g., high-efficiency end-use appliances) are also an effective water conservation approach.
Water consumption is particularly responsive to the energy demand level, as depicted in figure 2. We explore the relationship between energy demand and water consumption by computing the water consumption intensity of the energy pathways, defined here as global water consumption divided by final energy demand (figure 4). The intensity of water consumption increases over the simulation period regardless of the demand level, with only minor differences observed across the demand levels. However, it is notable that the GEA-Efficiency scenarios display the largest range since low demand levels afford more flexibility in the supply side technologies used to mitigate climate change (Riahi et al 2012). The wide range in water consumption intensity results from both the scenario-specific technology restrictions and the variability in water consumption across the technology options.
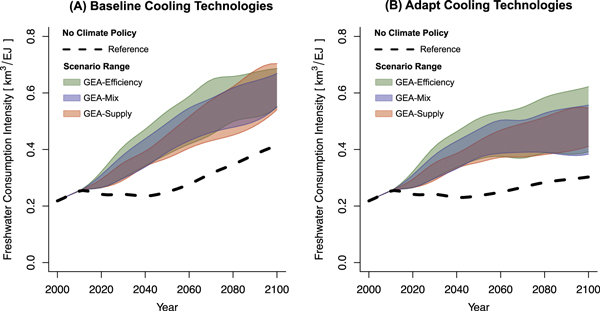
Figure 4. Water consumption intensity of the 2 °C and reference scenarios for the two thermoelectric cooling technology cases: (A) baseline cooling technologies; and (B) adapt cooling technologies. The consumption intensity is calculated as water consumption divided by final energy demand (in exajoules (EJ)).
Download figure:
Standard image High-resolution imageFigure 4 also indicates that the aggregate water consumption intensity continues to expand even in the ‘adapt cooling technologies’ scenarios since only once-through freshwater systems are converted to air and sea water cooling and thus closed-loop systems continue to expand. Since closed-loop systems consume more water than once-through technologies, relatively modest improvements to the aggregate consumption intensity are achieved. The reference scenario trajectory is also depicted, and remains noticeably lower than all mitigation scenarios tested. In the reference case, the transition towards combined-cycle power generation results in a more water-efficient system when compared to the mitigation scenarios that involve expansion of water consumption-intensive nuclear, CSP, and CCS technology.
3.4. Regional trends
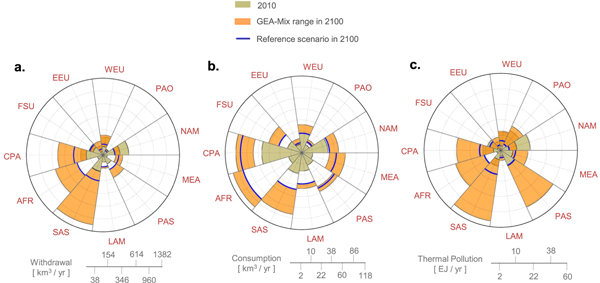
The integrated assessment framework computes energy sector water impacts across 11 macro-regions, and we explore the regional results in figure 5. Depicted are water withdrawal, consumption and thermal pollution results for 2010 and 2100 for the ‘baseline cooling technologies’ scenario. Energy sector water withdrawal is projected to decrease in the majority of advanced economies (EEU, FSU, NAM and WEU) as a result of: (1) anticipated stagnation in regional energy demand; and (2) the transition away from withdrawal-intensive thermal power generation technologies (e.g., once-through cooled coal generation) towards technologies with cooling system distributions that include a higher proportion of closed-loop systems (e.g., combined-cycle natural gas). Most developing economies (AFR, LAM, MEA, PAS, and SAS) see an increase in withdrawals due to the rapid increase in energy demands. Conversely, CPA and PAO achieve lower withdrawals because of the transition in these regions away from once-through cooled coal generation.
Figure 5. Regional results obtained for (a) withdrawal, (b) consumption and (c) thermal water pollution across the climate change mitigation pathways and reference scenario under the ‘baseline cooling technologies’ scenario. The depicted magnitudes are proportional to the area of each wedge. WEU = Western Europe; PAO = Pacific OECD; NAM = North America; MEA = Middle East and North Africa; PAS = Pacific Asia; LAM = Latin America; SAS = South Asia; AFR = Sub-Saharan Africa; CPA = Centrally Planned Asia; FSU = Former Soviet Union; and EEU = Eastern Europe. A full list of countries included in the macro-regions is provided in the supplementary information (section S1).
Download figure:
Standard image High-resolution image
Consumption levels increase in all regions due to a higher penetration of electrified end-uses, with increases most prevalent in developing economies because of rapidly increasing demands that accompany their anticipated economic advancement. Nuclear, CCS, and CSP technologies are the main contributors to increased water consumption and emerge as critical options for addressing the rapid demand growth in developing regions. In LAM, hydropower expansion is the primary source of increased consumption. Results for thermal pollution highlight regional cooling technology trends. Once-through cooling systems are common in PAO (seawater), SAS (freshwater) and MEA (seawater), which combined with the regional expansion of nuclear generation across a number of mitigation scenarios pose significantly increased risk of thermal pollution. Conversely, Latin America has the lowest thermal pollution due to the expansion of hydropower and solar photovoltaic (PV) technologies to meet its rapidly expanding electricity demand. The reduced thermal pollution in other advanced economies (FSU, EEU, WEU and NAM) follows from the reductions in withdrawals described previously.
4. Discussion and conclusions
In this paper, a global integrated assessment model was equipped with the capabilities to account for water impacts throughout the energy supply chain. The model was applied across a broad range of energy transformation pathways consistent with a 2 °C climate policy to quantify long-term water impact uncertainties over the 21st century. The results of this analysis show that the global water implications of energy transitions consistent with a 2 °C climate policy vary significantly due to the diverse technology combinations commensurate with a 2 °C emissions level and the wide range in water performance (withdrawal and consumption) observed at the technology-level. The quantified scenario uncertainties bridge a much larger range than that seen in previous integrated assessments (Davies et al 2013, Kyle et al 2013). The impacts of uncertainties regarding technology-specific water withdrawal coefficients are found to be relatively minor compared with the uncertainty across the range of 2 °C scenarios, while uncertainties associated with water consumption coefficients have a more significant impact on the uncertainties surrounding energy-related water consumption.
The integrated assessment framework was further applied to quantify, for the first time, global thermal water pollution from power plants. The prevalence of thermal power generation across the mitigation scenarios suggests that thermal pollution will pose greater risks to aquatic ecosystems in the future. However, scenarios that phase out once-through cooling systems and focus on reducing energy demand through improved end-use efficiency demonstrate significant potential for reducing thermal pollution impacts. An additional option that was not explored in this analysis is the deployment of cooling ponds, which allow effluent temperatures to decline before water is returned to the environment.
We also find that the majority of future energy-related water impacts under a 2 °C climate policy are anticipated to occur in the electricity sector of developing regions as a result of increasing electricity demand. Widespread deployment of nuclear generation and CCS technology to meet these requirements could result in a water-intensive low-carbon energy system that may contribute to localized water stress, exacerbate conflict among competing water users, and threaten the health of aquatic ecosystems through thermal pollution. Particularly important therefore is the development of integrated mitigation strategies that reduce both the carbon and water intensity of electricity generation in developing regions prone to surface and groundwater stress that will be exacerbated by increasing intersectoral competition and climate change (van Vliet et al 2013).
Our analysis suggests that strategies combining end-use energy efficiency (i.e., reducing energy demand) with a rapid scale-up of renewable electricity generation such as solar PV and wind can provide multiple co-benefits in terms of climate stabilization, reduced water demand and improved water quality. Previous work demonstrates an even broader range of sustainability objectives covered by similar energy transformation pathways, including increased energy security and reduced human health impacts from air pollution (McCollum et al 2013). A key difference between these objectives is that most 2 °C climate policies achieve improvements to energy security and air pollution, whereas many of the mitigation scenarios investigated here exacerbate water impacts.
Transitioning towards increased use of air-cooled technology for thermoelectric generation is found to reduce future water impact risks significantly. All 2 °C scenarios investigated in this paper achieve lower end-of-century withdrawals than current conditions when once-through freshwater cooling technologies are replaced with a combination of air and seawater cooling systems. We find relatively minimal impacts of this cooling technology transition on electricity supply efficiency. Yet, concerns surrounding the safety of air-cooled nuclear generation and incompatibilities with CCS technology could pose challenges to implementation (Zhai et al 2011, Webster et al 2013). Air cooling technologies are also more expensive, and increase the cost of mitigating emissions (Webster et al 2013). Restricting expansion of nuclear and CCS technologies based on anticipated water impacts is, however, risky and potentially costly in terms of climate stabilization (Rogelj et al 2013b).
Identifying locations that contain sufficient water resources to support development and understanding feedbacks between technology siting, water availability, and deployment costs will require an enhanced spatial representation of the energy sector in integrated assessment models. This type of integrated approach will prove critical when developing water, energy, and climate policy, especially in regions where rapid growth in both energy demand and water demands from other sectors are anticipated.
Acknowledgments
The research has been supported by the European Union’s Horizon 2020 Research and Innovation Programme under grant agreement No 642147 (CD-LINKS) as well as by the European Union Seventh Framework Programme FP7/2007–2013 under grant agreement n° 308329 (ADVANCE). Simon Parkinson was also supported by a post-graduate scholarship from the Natural Sciences and Engineering Research Council of Canada.