
Abstract
Absorption spectroscopy (AS) represents a reliable method for the characterization of cold atmospheric pressure plasma jets. The method's simplicity stands out in comparison to competing diagnostic techniques. AS is an in situ, non-invasive technique giving absolute densities, free of calibration procedures, which other diagnostics, such as laser-induced fluorescence or optical emission spectroscopy, have to rely on. Ground state densities can be determined without the knowledge of the influence of collisional quenching. Therefore, absolute densities determined by absorption spectroscopy can be taken as calibration for other methods. In this paper, fundamentals of absorption spectroscopy are presented as an entrance to the topic. In the second part of the manuscript, a review of AS performed on cold atmospheric pressure plasma jets, as they are used e.g. in the field of plasma medicine, is presented. The focus is set on special techniques overcoming not only the drawback of spectrally overlapping absorbing species, but also the line-of-sight densities that AS usually provides or the necessity of sufficiently long absorption lengths. Where references are not available for measurements on cold atmospheric pressure plasma jets, other plasma sources including low-pressure plasmas are taken as an example to give suggestions for possible approaches. The final part is a table summarizing examples of absorption spectroscopic measurements on cold atmospheric pressure plasma jets. With this, the paper provides a 'best practice' guideline and gives a compendium of works by groups performing absorption spectroscopy on cold atmospheric pressure plasma jets.
Export citation and abstract BibTeX RIS

Content from this work may be used under the terms of the Creative Commons Attribution 3.0 licence. Any further distribution of this work must maintain attribution to the author(s) and the title of the work, journal citation and DOI.
1. Introduction
Since the 1990s, cold non-equilibrium atmospheric pressure plasma jets [1–6] have emerged worldwide and sparked new application fields such as plasma medicine [7, 8], where the high reactivity at low gas temperature is crucial for interaction with sensitive biological systems. In plasma medicine, it is essential to diagnose species fluxes generated by plasma sources to identify relevant fundamental processes [9, 10]. Especially in plasma jets, which can access cavities and inactivate bacteria in for example hair root channels, these fluxes are difficult to obtain [11]. However, cold non-equilibrium plasmas pose a challenge for diagnostic techniques as many rely on equilibrium calculations and these plasmas have small dimensions and high density gradients in space and time [12]. While in gas phase chemistry, typically gas chromatography mass spectrometry is used [13], which exhibits the problem that, e.g. ozone reacts vividly in the column and disturbs the results, optical diagnostics have been a useful means to diagnose reactive species or plasma properties [12, 14–18]. Most commonly used techniques are optical emission spectroscopy and laser fluorescence based techniques [12, 14, 15, 19]. Only recently, absorption spectroscopy (AS) has been in the focus of the field as it has several advantages over other techniques. A hindrance for the application of AS, especially to characterize atmospheric pressure plasma jets (APP-jets) or, in short, atmospheric plasma jets, has to date been oflower sensitivity compared to several other techniques, as well as the line-of-sight averaged densities obtained from the measurements. Both drawbacks have been overcome by technical or methodical solutions, and improved light source and detector technology allow more and more sensitive measurement setups. With this development, the manifold advantages of AS come to light and this diagnostic method rapidly gains relevance for plasma jet diagnostics. The range of information on the environment of the species that can be deduced from spectra makes absorption spectroscopy a valuable tool for gaseous detection in plasmas. The main advantage of AS is its calibration-free nature providing absolute densities of the absorbing species without the problems of complete instrument calibration inherent to optical emission spectroscopy (OES) [20], laser-induced fluorescence (LIF) [21], or mass spectrometry (MS) techniques [22, 23]. In addition, the measurement of the absorption coefficient is based on the ratio of incident and transmitted intensities. Consequently, there is no need for measurements in absolute units of light intensities (Wm−2 sr−1 nm−1) as required in OES and LIF techniques. Furthermore, the direct determination of the absolute density of the ground state is a strong inherent advantage in comparison with OES, which is restricted to the measurement of electronically excited molecules. The main drawback of AS is that the obtained densities are usually line-of-sight averaged values. But due to the intrinsic properties of absorption spectroscopy described above, the technique has the following advantages over other diagnostic methods.
Firstly, absorption spectroscopy is simple and reliable. If spectral properties (line strength, oscillator strength, or absorption cross-section) are known, the absolute density is trivially determined by one equation: the Beer–Lambert law. For stable atoms and molecules, these properties are easily obtained by measurements in reference gas cells, where species densities (ideal gas law calculation) and absorption length (cell length measurement) are perfectly controlled. In uniform plasma environments, density precision below 1% is attainable for such species. For atomic and molecular radicals or metastable species, the precision is limited by the accuracy of the spectroscopic properties provided in the databases.
Secondly, absorption-based techniques provide in situ diagnostics for atmospheric plasmas. These techniques can offer direct knowledge on space- and time-resolved species densities and temperatures, except for cases where the low sensitivity imposes the necessity to study species concentrations by gas extraction followed by analysis in multipass cells. In particular, atomic or molecular radical or metastable species measurements require detection only inside the plasma due to the extremely short lifetime of these species compared to stable species.
Thirdly, absorption techniques are non-intrusive diagnostics. Even the perturbation induced in the plasma using laser sources can be easily controlled. Power saturation, which is the large pumping of the excited state by the absorption process [15], can be avoided using neutral filters or polarizing attenuators. As best practice, the used laser has to be progressively attenuated until the absorption coefficient remains constant while the laser intensity is further reduced.
In a comparison to other techniques, the advantages of AS become even clearer. Being able to directly determine ground state densities by absorption spectroscopy is advantageous compared to e.g. OES measurements, where excited states are probed. In the latter, a kinetic model is required to deduce the densities of molecules in ground electronic states from the measured densities of excited states. Furthermore, measured absorption data can be fitted in real-time using molecular parameters such as line strengths and pressure-broadening coefficients listed in for example the HITRAN database. No models or further analysis after the measurements is necessary. Not only ground state densities can be gained from absorption spectroscopy. In plasma diagnostics, for example, the gas temperature is an often-sought parameter. A large number of experiments provide temperature measurements from the ro-vibronic distribution of the electronic excited states using OES (see e.g. [24]). However, these are based on assumptions about pumping and loss mechanisms of the excited states, which mainly include excitation by direct electron impact and loss by spontaneous emission. In atmospheric pressure plasmas, mechanisms such as quenching often dominate the spontaneous emission while other pumping and loss mechanisms such as pulling and excitation transfer can provide a non-equilibrated Boltzmann distribution and therefore induce errors in the resulting temperatures from electronically excited states. Information on the rotational and vibrational temperatures can be deduced from the relative densities in the rotational and vibrational levels. Therefore, a very promising solution is the determination of the gas temperature from the rotational-vibrational population distribution in the electronic ground state by absorption techniques. Because the rotational energy separation is very small (energies of meV), few collisions by heavy particles are sufficient to establish the Boltzmann equilibrium over the rotational distribution in the molecular vibrational ground state. In addition, the characteristic time for rotational-translational relaxation is on the order of hundreds of picoseconds [25]. Reliable gas temperature (translational temperature) is therefore obtained from Boltzmann plots of the absorption data.
Often, a combination of different diagnostic techniques is advised. For example, ground state absolute density measurements are often performed by fluorescence techniques, mainly due to their very high sensitivity but with the drawback of the complex calibration of the measured signals [6]. If not compared to a fluorescent signal of a known number of molecules, this includes detector sensitivity, transmission of the optical system (fibres, filters, and spectrometers), the collection volume and the solid angle of the optics employed. In addition, for plasmas at atmospheric pressure, besides the radiative fluorescence de-excitation, collisional quenching is often an even larger competing de-excitation mechanism [6, 26]. Frequently, quenching rates are estimated from data measured at low pressures and extrapolated to atmospheric pressure [27]. Large errors are then associated to densities obtained by fluorescence as a result of the not well-known dependency of the quenching rates on the local density, nature and temperature of the colliders. A trustworthy solution is then the calibration of fluorescence signals (which includes both detectability and quenching) by absorption experiments [21, 28]. The absorption measurement is then used to convert the relative fluorescence signals into a sensitive space and time-resolved absolute density measurement.
The absorption and fluorescence techniques are then complementary, the first providing reliable absolute densities and the second providing spatial and temporal resolved measurements with higher sensitivity.
In the present review, the state of the art, best practice and applications of absorption spectroscopy from vacuum ultraviolet (VUV) to the mid infrared (MIR) spectral region are presented.
2. Absorption spectroscopy: what do you need to know?
In this chapter, a brief overview of the most important fundamental knowledge required to perform absorption spectroscopy is described. As this paper does not intend to be a textbook on absorption spectroscopy, for a more in-depth description of the basics of absorption spectroscopy the reader is referred to various books [26, 29–31] and papers [12, 15, 32, 33]. Throughout the review, fundamental equations have been listed according to the SI system. Equations explaining a mechanism are listed according to their original publication and the reference is given. It is very common in the field of spectroscopy to use CGS units. In view of the 'best practice' approach of the special issue cluster, the respective equations are given in the system used within the respective database and approaches typical for the spectroscopic research field.
2.1. Atomic and molecular absorption
Sensitive atomic and molecular absorption spectroscopy in atmospheric plasmas commonly uses permitted dipole transitions (single-photon absorption) between eigenstates in the outermost shell. From quantum mechanics, eigenstate energies are obtained as solutions of the stationary Schrodinger equation and they are a unique set of energies for atoms and molecules. Transition dipole selection rules (e.g. parity change) limit the number of allowed transitions leading to specific spectral absorption patterns for each species. For electronic transitions, these patterns are typically observed in the VUV to NIR spectral region, and, for rotational-vibrational absorption transitions, in the MIR spectral region.
The central wavelength λik of an absorption transition line from a lower energy state i to a higher energy state k is related to the photon energy ▵E by
where h is the Planck constant, c the speed of light, Ei and Ek are the eigenstate energies of the lower and the upper level, respectively. Wavelength calibrated absorption spectra and thus absolute absorption line or absorption band positions are determined by various techniques: Usually in the VUV to NIR spectral domains, calibrated spectrometers or wavemeters are employed, while in the MIR, Fabry–Pérot etalons and reference gas cells are used.
The unique set of transition wavelengths for each species is generally available in spectroscopic databases (see section 2.5). This allows the distinct identification of a particular species present in a plasma. Limited instrumental resolution and overlapping of multiple lines may hamper plasma species identification. This is relatively easily solved by the identification of several absorption lines of the same species. Note that a particular absorption transition in plasmas is observed only if there is a significant population density in the lower state. Consequently, absorption lines may be absent as a result of certain plasma conditions, e.g. the electron temperature. In such a case, a careful line identification procedure is required.
2.2. Beer–Lambert law
Absorption spectroscopy relies on the Beer–Lambert law, which describes the absorption of light by a sample. The Beer–Lambert law links the intensity attenuation of optical radiation through a homogeneous sample to the density N of species present in it

where I(λ) is the transmitted radiation, I0 the incident radiation, σ(λ) the wavelength dependent absorption cross-section, L the absorption path-length, and k(λ) the wavelength dependent absorption coefficient. The degree to which light is absorbed is thus quantified, and, from the magnitude of the absorbance, the density of absorbing species in a sample can be determined

Absorption features, however, are never strictly monochromatic and are generally spread over a range of wavelengths centred at λ0, resulting in the line profile of the transition. Several processes contribute to the increase of the width of the line profile, including the lifetimes and thermal motion of the species, the collisions between species, and the influence of electric and magnetic fields on the species behaviour. Hence, the integrated absorption coefficient over an absorption line, kλ, gives a more useful measure of the absorbance
where σint is the integrated cross-section and is defined as
As shown in the next section, by using the Beer–Lambert law, absolute densities of absorbing species in the plasma can be extracted directly from their spectral profiles. The spectral line positions usually provide species identification while line profiles are connected with the properties of the species in the plasma, for example their translational temperature (see section 2.4).
2.3. Population densities (ground and excited states)
2.3.1. Oscillator strength: atomic density.
The allowed dipole transitions from atomic ground states to excited states have typical energies in the VUV and UV range. When absorption spectroscopy is used to probe atomic densities in the electronic excited states (metastables, resonant levels, etc.), the corresponding transition wavelengths are usually in the VIS and NIR domain. In case of non-equilibrium atmospheric plasmas, excited electronic states of atoms are not in Boltzmann equilibrium with their ground states. Because the energy separation between electronic levels is large (eVs), the main pumping mechanisms are not the heavy particle collisions but electron kinetics, excitation transfer, and radiative processes. In this case, to relate excited state densities to electronic ground states, collisional-radiative models are required. However, the density of the lower state (which can be a ground state or an excited state) in the absorption process is easily determined by

where k(λ) is the absorption coefficient integrated over the entire absorption line, λik the resonance wavelength corresponding to the electronic transition i → k, f ik the oscillator strength (dimensionless), Ni and Nk the densities of the lower and upper states, ε0 the vacuum permeability, e and me the electron charge and mass, respectively. If the two levels are in Boltzmann equilibrium, then the relation between the absorption coefficient and the lower level density is given by

where kB is the Boltzmann constant, T the electronic temperature [K], and hν the energy of the absorbed photons [J] with ν = c/λ. The bracket term in the right side of equation (7) accounts for stimulated emission. In atmospheric pressure plasmas, the population of the upper state of most atoms is a very small fraction of the lower state, because of the large energy separation between levels. Therefore, the bracket term in equation (7) normally equals to one. For simplicity, the above expressions are using atomic oscillator strengths. This spectroscopic property can be found for instance in the NIST Atomic Spectra Database [34]. We recommend this database, because it includes the statistical weights of the two levels, so it is easy to apply. Notice that in equations (6) and (7) the absorption is described in wavelength space (as this is mainly being used for UV and VIS atomic transitions in literature). For practical purpose, equation (7) can be written as

where k(λ) is in cm−1, λ in cm, and Ni in cm−3, and the constant in the right side of the equation is also in cm units.
Atomic lines in atmospheric plasmas often exhibit Lorentzian profiles due to collisional broadening dominating the broadening mechanisms of the line profile. A practical expression in that case is
where k(λ0) is the peak absorption coefficient ( , the resonance wavelength), and ΔλL the full-width at half-maximum (FWHM) value of the line profile [cm−1]. Notice the expressions given above are for single line absorption; when line overlapping occurs, the contributions of different species (due to unresolved transitions of the same or of different atoms) need to be considered.
2.3.2. Line strength: molecular density.
Using MIR absorption spectroscopy, individual absorption lines of vibrational-rotational transitions in electronic ground state of molecules can be measured. Often used techniques are laser-based methods, e.g. tunable diode laser absorption spectroscopy (TDLAS) and quantum cascade laser absorption spectroscopy (QCLAS) or a broadband high-resolution apparatus, e.g. a high resolution Fourier transform infrared (FTIR) spectrometer. The integrated absorption coefficient k(ν) in wavenumber space (ν = 1/λ in cm−1) over an absorption line is related to the molecular species density by

where S(T) [cm2 cm−1 molecule−1] is the line strength (or the line intensity) of a specific transition at temperature T [K], and n [molecules cm−3] is the total density of the molecular species in all internal states of the molecule. We choose to give here the integral of the absorption coefficient in wavenumber space because MIR spectroscopy is commonly presented in wavenumber units. It should be noted that the line strength defined in this way is temperature dependent via the Boltzmann relation between n and Nv,J, the ro-vibronic level for which the absorption is measured. The information on the rotational and vibrational temperatures can be deduced from the relative densities in the rotational and vibrational levels. Assuming local thermodynamic equilibrium, the line strength of a particular rotational-vibrational transition is given by [35]
where v and J are the quantum numbers of the lower ('') and upper (') ro-vibronic levels,  [cm−1] the spectral line transition wavenumber,
  the statistical weight of the lower level,
  the energy of the lower level, Q(T) the total internal partition function, and
  the weighted transition-moment squared. The statistical weight and the total internal partition function include the electronic, vibration, rotation and nuclear spin terms (see for details [36, 37]). The term in the squared brackets accounts for stimulated emission. While for electronic transitions this term can be neglected (large ▵E), in the case of rotational–vibrational transitions probed in the electronic ground state an important population is present in the upper state. This occurs even in room temperature plasma environments. Therefore stimulated emission is often significant and needs to be considered. Most of the above molecular parameters can be found in the HITRAN database [38, 39].
While the theoretical calculation of the line strength is complex, its measurement is easily obtained for stable molecules. Experimentally, a reference cell is filled with a molecular gas at ambient temperature and controlled pressure. The gas density is calculated based on the ideal gas law. Knowing the length of the cell, the integrated absorption coefficient is then measured and the S(T) at room temperature is obtained using equation (10). For radicals, however, this procedure becomes very challenging. Due to their short lifetimes, a complex apparatus is needed to generate and maintain high radical densities, and calibration methods are then used to measure absolute radical population (e.g. [37]). Therefore, much less spectroscopic parameters of radical species are found in databases, strongly limiting absolute radical density measurements in plasmas nowadays.
2.3.3. Effective absorption cross-section: molecular density.
When using broadband absorption techniques (e.g. grey body lamps) or unresolved molecular spectral features are measured by laser absorption (e.g. absorption of large molecules or absorption with pre-dissociation of the electronic excited state), effective absorption cross-sections are needed for species density measurements. In these cases, often the rotational, vibrational molecular spectral features are unresolved, resulting in a structureless absorption spectrum. Consequently, densities are obtained not from a single line absorption but from unresolved molecular bands, which are spectrally convolved with the instrumental functions. Absolute concentrations can then be obtained if not a distinct point in the spectrum is analysed, but a carefully defined spectral range ▵ν, which is in fact additional averaging. This gives the following relation between the molecular density and the effective absorption cross-section, σeff (ν) [40],
In this way, the least error prone density determination is to not calculate the absorbance from the transmitted intensity I at ν, but to use the area (or integral) A ≈ I▵ν. In the calculation of σeff, the contribution of ▵ν cancels out in equation (12), i.e. σ(λ) is in cm2 units. The effective absorption cross-section can depend on temperature, pressure, and instrumental resolution. When very high-resolution absorption devices are used, instrumentally independent cross-sections are needed. Otherwise, cross-section data need to be convolved with the instrumental function employed in the plasma diagnostic experiment. Underestimated densities are obtained if instrumental functions are disregarded. Absorption cross-sections from UV to MIR for molecular species can be found for example in the HITRAN database [39].
2.3.4. Power saturation.
In case a high power light source such as a laser is used for the absorption measurements power saturation phenomena have to be avoided. Otherwise, the diagnostic is no longer non-intrusive. The absorption of radiation inherently reduces the population density in the lower state of the transition to which the laser frequency is tuned, and increases the density in the upper state. This modification of population densities should be such that the measured signal is still representative of the initial density of the lower state. At relatively high radiation powers (especially for lasers), this may be no longer the case. That no power saturation occurs can relatively simple be checked by repeating the absorption measurement for different radiation powers since the measured absorption percentage should be independent of the power. An overview on how to estimate the influence of power saturation on absorption measurements and on the determination of the saturation parameter S using a variety of techniques is discussed in [15].
2.4. Lineshape and broadening mechanisms
In absorption spectroscopy, line profile shapes can be gained from which properties of the plasma species can be derived. This is especially of interest where emission does not occur and emission spectroscopy or fluorescence spectroscopy are not alternative diagnostic methods. The area of the spectral profile yields the species density, while the spectral profile can be used to gain more insight into the mechanisms of line broadening. The lineshape of the spectral profile is determined by several factors dictated by the spectroscopic properties of the species studied as well as the experimental conditions such as the pressure and temperature of the gas sample and the existence of electric and magnetic fields. These factors can be divided into homogenous and non-homogeneous categories, i.e. contributions to the lineshape that affect every element present in the sample in an identical way, or contributions which arise from an average effect that is not identical to every element, respectively. Here, the relevant mechanisms behind the lineshape of the spectral profile will be briefly discussed. They include natural broadening, collisional broadening (resonance and van der Waals broadening), Doppler broadening, Stark broadening, instrumental broadening, and saturation broadening. For a more detailed description and mathematical expressions, we refer the reader to [14, 15, 24, 29, 30, 41].
2.4.1. Natural line broadening.
One example of a homogenous contribution to the lineshape is natural broadening, which arises from the natural lifetime, τ, of the upper state of the transition. From the Heisenberg uncertainty principle, τ ▵E ⩾ ħ, it can be seen that the consequence of a finite lifetime of the upper state is an uncertainty in the corresponding energy and, therefore, the state is described by a range of energies, ▵E. The resulting natural broadening effect has a Lorentzian lineshape, but this contribution to the width of the absorption lineshape is, however, very small, being normally negligible in comparison with other broadening contributions.
2.4.2. Collisional broadening.
Another example of homogeneous broadening of the lineshape is collisional broadening. When collisions in a gaseous sample containing atoms and/or molecules occur, this effectively reduces the natural lifetime of the transition and thus increases the uncertainty in the energy of the transition, i.e. there is a broadening of the lineshape. The extent of the lineshape broadening depends on the nature of the energy transfer during a collision, and of the natural lifetime of the transition compared to the frequency of collisions. As the pressure increases and the interval between collisional events reduces, the extent of broadening of the lineshape increases. The collisional broadening has two components: pressure-induced broadening, also known as van der Waals broadening, and resonance broadening. The former is due to collisions of the absorbing particle with neutral perturbers that do not share a resonant transition with the radiating particle. The latter is due to collisions with perturbing particles with similar energy levels as the absorbing particle, which introduces the possibility of an energy exchange process (when both particles are from the same species this is often termed self-broadening in literature). Collisional broadening leads to a Lorentzian lineshape, analytically described by
where ▵νL is the Lorentzian linewidth given as a full width half maximum (FWHM) value and ν0 is the resonance frequency, i.e. the line center of the absorption profile. The Lorentzian linewidth due to collisional broadening is often conveniently expressed as

with p being the operating buffer gas pressure [atm] and γ the pressure broadening coefficient dependent on the nature of the colliding species, generally given in half width half maximum (HWHM) [cm−1/atm] at Tref = 296 K and reference pressure pref = 1 atm. This parameter is transition dependent [35]. The broadening coefficient is often tabulated in literature in spectroscopic databases (see section 2.5). If the broadening coefficients are not tabulated in the literature, which is often the case for atoms, then they have to be calculated using the analytical expressions of resonance and van der Waals broadening as one can find in the book by Griem ([30], p 97 and 99). Resonance broadening occurs if either the lower (l) or the upper (u) state of the radiative transition under consideration is the upper level of a resonance transition, i.e. if the level is connected to the ground state (g) by an allowed dipole transition [31]. When including all three perturbing transitions, the resonance broadening can be expressed as [14]
Van der Waals broadening for radiator r colliding with perturber p is given by [14]

where Ep is the energy of the first excited state of the perturber connected with its ground sate by an allowed transition, Np the number density of the perturber, vrp the relative speed of the radiating atom and the perturber, and the matrix element  equals to
Here,  and
and  are the ionization energies of the hydrogen atom and of the radiating atom, respectively,
  the term energy of the upper state of the transition,
  its orbital quantum number, and z the number of effective charges (z = 1 for a neutral emitter, z = 2 for a singly ionized emitter, etc) [14]. In [14], the values of the HWHM contributions of the various broadening mechanisms to the line profile of the
  line at 486.132 nm are calculated for an air plasma with a few percent of hydrogen (see table 1).
Table 1. HMHM (in nm) for the  line at 486.132 nm. P is the pressure in atm, T the gas temperature in K, ne the electron number density in cm−3, and XH the mole fraction of hydrogen atoms [14].
| ▵λStark | ▵λresonance | ▵λvan der Waals | ▵λNatural | ▵λDoppler |
|---|---|---|---|---|
 |
 |
 |
 |
 |
Collisional broadening of the lineshape tends to dominate at atmospheric pressure and Doppler broadening, an example of inhomogeneous broadening, is negligible especially for cold plasmas. At higher temperatures, however, its contribution has to be taken into account, and from it the translational temperature of the species can be obtained.
To conclude this subsection, we would like to point out that even if the profile is pure Lorentzian, due to the Doppler broadening being very small, in principle a value for the temperature can still be obtained via the expression for the temperature and pressure correction of the pressure broadening coefficient. The pressure broadened coefficient γ (p,T) for a gas at pressure p [atm], temperature T [K], and partial pressure ps is given by the following expression [35]:
where n is the coefficient of temperature dependence of the pressure broadening coefficient. In the absence of other data, the coefficient of temperature dependence of the self-broadening coefficient is assumed to be equal to that of the pressure broadening coefficient. Alternatively, the classical value of 0.5 can be used by default.
2.4.3. Doppler broadening.
Doppler broadening results from the shift in the frequency of the absorbed radiation during a transition, and this shift is dependent on the relative velocity of the absorber with respect to the direction of propagation of the radiation. For an atom or molecule that absorbs at a resonant frequency of νres when stationary, the actual frequency at which the transition is observed is shifted to νa when the molecule travels with velocity, v, away from the radiation source and is given by
As a result of thermal motion, the molecules within the sample exhibit a Maxwellian distribution of their velocities along the propagation direction of the radiation, leading to a distribution of absorbed frequencies according to the direction of the particle's motion relative to the source. This inhomogeneous mechanism gives rise to the following normalized Gaussian lineshape
where ▵νDopp is the FWHM Gaussian linewidth for Doppler broadening with its dependence on temperature, T, given by

where m is the molecular mass and M the molecular weight. Additionally, as the equation above highlights, the FWHM Doppler contribution, ▵νDopp, is an increasing function of the resonant frequency, ν0, and thus ranges from tens of MHz in the mid-infrared, up to a few GHz in the UV. Such dependence results in different instrumental resolutions required for conducting Doppler-resolved studies in different regions of the electromagnetic spectrum.
2.4.4. Stark broadening.
The interaction of a molecule with the electric field caused by the free electrons in the sample can be thought of as many weak collisions with the electrons. This results in a lifetime shortening (like in collisional broadening) of the molecular state under consideration. When the contribution of electrons is much higher than that of ions, the Stark broadening is characterized by a Lorentzian profile, whose FWHM is directly related to the electron density. OES measurements on the Hβ-line are commonly used for the determination of electron densities ranging from 1014–1018 cm−3 [19]. However, absorption spectroscopy on this transition is not trivial. Alternatively, one could in principle use measurements on metastable argon or helium atoms. The Stark broadening, however, is generally much smaller than the Doppler and collisional broadening. Therefore, the contribution of Stark broadening to the line profile is hard to determine and is usually neglected [42]. Despite these problems, in [43], an estimation of the electron density was performed in an argon/oxygen micro structured electrode discharge up to a pressure of 400 mbar; although, this was not possible at higher pressures. For more detailed information, we refer the reader to a review on Stark broadening in this special issue cluster [41].
2.4.5. Instrumental and saturation broadenings.
When deducing properties of the plasma from the lineshape of a spectral absorption profile, one has to take into account the influence of the spectrometer or the laser on the lineshapes, i.e. instrumental broadening. Depending on the components of the spectrometer (laser), this instrumental broadening can have a Gaussian or a Lorentzian lineshape with FWHM linewidth ▵νinst. Preferably, the instrumental linewidth of the spectrometer is much smaller than or similar to the spectral width of the investigated atomic or molecular transition. When the instrumental linewidth is comparable or larger than the width of the spectral linewidth, large errors can be made when deconvoluting the spectra profile to obtain information on parameters such as temperature or other broadening mechanisms. This is generally less of an issue for atmospheric pressure plasmas due to larger collisional broadening of the studied spectral profiles compared to instrumental broadening. Another broadening effect appears in case of power saturation. Due to the optical coupling of the lower and the upper states by the radiation field, the homogeneous line width of the transition is broadened and becomes  [15], S being the saturation parameter. In this case, the absorption coefficient gets smaller in amplitude and larger in width.
2.4.6. Best practice on analysis of the absorption spectral profile.
After recording a spectral profile of a single transition of the species of interest, there are various ways to analyse the data to obtain absolute number densities. The most accurate values are obtained by using the integrated absorbance as defined in equation (4) or the area under the line profile of the fractional absorption (A(ν)) of any absorption spectral profile. The latter has to be sometimes used instead of the absorbance as discussed in detail in this section, and the integrated fractional absorption, W, is defined as:
Note that the integrated cross-section has to be known; how to obtain it is discussed in section 2.2. The density can also be obtained from the peak absorbance or fractional absorption of an isolated line if the peak absorption cross-section is known. The peak absorption cross-section can be obtained from the integrated cross-section by incorporating the lineshape function Φ( )
)

The lineshape function is normalised, so that its integral over wavenumber is one
In the case of a pure Gaussian lineshape function, Φ(ν) can be written as
In case of a pure Lorentzian lineshape function, Φ(ν) can be written as
For conditions where there are appreciable contributions from different mechanisms, the lineshape takes a form that is a convolution of the Gaussian and Lorentzian components, namely a Voigt lineshape that can be described by

where x and a are given by
In the case of multiple Gaussian profiles, the overall FWHM Gaussian linewidth is given by the square root of the combination in quadrature of components, for example

while the overall FWHM Lorentzian linewidth is given by the sum of each individual contribution. The best analytical approximation of the FWHM width of the Voigt profile, ▵νVoigt, with an accuracy of 0.02% is given by [44]

In case of a Voigt lineshape function, Φ(ν) can be written as [45]
In for example [46], it was shown that when the spectral line profile is much narrower than the spectral resolution of the spectrometer, using the peak fractional absorption can lead to an underestimation of the real density. Furthermore, it was demonstrated that for strongly absorbed lines, the area under the absorbance is not conservative, i.e. again the density is not correctly determined from the integrated absorbance. Therefore, in such a case, the area under the fractional absorption, W, has to be used to obtain the correct density, regardless of the instrumental function of the spectrometer. An example where the integrated fractional absorption has to be considered is given in [47], where a 310 nm light-emitting diode (LED) is used as a light source together with a very high resolution spectrometer to record the spectra (2.6 pm resolution). Despite this high resolution, the real linewidth is still much smaller. Therefore, to obtain the absorption spectrum of OH(X), the fractional absorption, A(ν), has to be determined, which is now defined as follows [47]
Therefore, four spectra have to be recorded: the background spectrum with LED and plasma off (Lbackground), the spectral emission of the LED without the plasma (LLED), the emission of the plasma without LED (Lplasma) and the transmitted light of the LED with the plasma on (Lplasma + LED). Integrating over the spectral line profile of the transition and using a modified equation (26), the OH(X) density in the ground state of a particular rotational state, Ni, can be determine as follows
where B is the Einstein coefficient for absorption. Note that the area under the spectral profile, W, is independent of the spectral line profile, and the experimental spectral profile without including the instrumental broadening has to be considered only in the exponential of the right-hand side.
2.5. Databases and tools
To obtain absolute species densities in plasmas using light absorption diagnostics, it is essential to know the spectroscopic properties of atoms and molecules. Firstly, data on energy levels together with selection rules provide spectral line positions observed in spectra. This is a key parameter for identification of species present in plasmas. Secondly, oscillator strengths, line strengths, absorption cross-sections and broadening coefficients are key properties for absolute densities and temperature measurements in plasmas. Nowadays, free-access spectroscopic databases contain these properties for most atoms and many molecules. Nonetheless, there is a lack of these properties for a large number of radical species. Furthermore, for atmospheric plasmas, accurate data on the pressure broadening coefficients of transitions is necessary to accurately be able to use fitting routines to obtain values for the densities and line broadening mechanisms. These values are also not always available in the literature. In particular for molecules, comparison of measured spectra with simulations is often necessary. The large number of possible transitions, the appearance of spectra that strongly depend on temperature, the pressure broadening, the instrumental function and the spectral overlapping make the species identification and the density as well as temperature measurements practically unfeasible without adequate simulation tools. Here, examples of databases and tools for absorption spectra simulations are given.
2.5.1. NIST atomic spectra database.
The NIST Atomic Spectra Database [34] of the National Institute of Standards and Technology (NIST) is particularly adequate if densities of atoms and atomic ions in ground and excited states (e.g. resonant, metastable) are to be probed by absorption spectroscopy. Energy levels and transitions are represented in a Grotrian diagram and the associated oscillator strengths are provided. This is useful for the choice of transition to use and detection sensitivity calculations. The NIST Atomic Spectra Database includes observed transitions of 99 elements and energy levels of 89 elements, with in total more than 90 000 energy levels and 180 000 lines. A key point for species density measurements in plasmas is the availability of 73 000 transitions for which oscillator strengths are given.
2.5.2. Specair tool.
Specair is a commercially available program for calculating emission or absorption spectra of radiation of air plasmas [48]. It calculates electronic molecular spectra (VUV-IR) based on a wide range of parameters, which include plasma column length, pressure, gas temperature, and rotational, vibrational and electronic temperatures. If instrumental functions are measured, they can be use as well as an input parameter in the spectral simulations. In table 2, a list of molecules with the available electronic transitions is presented. Absorption coefficients [cm−1] can be simulated by Specair for numerous plasma conditions. NO, CO and OH MIR rotational-vibrational transitions are also included together with atomic transitions of N, O and C.
Table 2. Molecules and electronic transitions available in Specair [48].
| Molecule/transition | X-X | A-X | B-X | C-X | D-X | B'-X | E-X | A-B | C-B | D-A |
|---|---|---|---|---|---|---|---|---|---|---|
| O2 | X | |||||||||
| NO | X | X | X | X | X | X | X | |||
| N2 | X | X | ||||||||
 |
X | |||||||||
| OH | X | X | X | |||||||
| NH | X | |||||||||
| CO | X | X | ||||||||
| C2 | X | |||||||||
| CN | X | X |
2.5.3. LIFBASE tool.
LIFBASE, available as freeware from SRI, is a program to chart the spectroscopy of diatomic molecules. In LIFBASE, absolute ro-vibrational emission and absorption coefficients are listed, with a variation of transition probabilities taking into account ro-vibrational wavefunctions and electronic transition moments. The program contains rotational radiative lifetimes and tabulated predissociation rates and frequencies for all ro-vibrational transitions. Spectral simulations of optical emission, absorption, excitation, laser-induced fluorescence, including thermal and non-thermal population distributions, and line broadening effects can be performed. The graphics interface allows an interactive change of simulation parameters. At present, the following molecules and electronic bands are covered [49] (see table 3):
Table 3. Molecules and electronic bands covered by LIFBASE [49].
| Molecule/transition | A-X | B-X | C-X | D-X |
|---|---|---|---|---|
| OH | X | |||
| OD | X | |||
| NO | X | X | X | X |
| CH | X | X | X | |
| CN | X | |||
| CF | X | X | ||
| SiH | X | |||
 |
X |
Especially for the evaluation and simulation of laser induced fluorescence spectra of OH and CH in flames, LASKIN, a simulation tool of time resolved LIF spectra, can be used [50].
2.5.4. HITRAN database.
HITRAN is an acronym for HIgh-resolution TRANsmission molecular absorption database [38, 39]. HITRAN is a compilation of spectroscopic parameters of molecules relevant for the prediction and simulation of the transmission and emission of light in the atmosphere including many trace constituents. Initially concentrating on the infrared spectral region, it also contains nowadays data in spectral regions beyond the infrared. The database is freely accessible through the HITRAN website run by the Harvard-Smithsonian Center for Astrophysics. For plasma spectroscopy, the traditional line-by-line spectroscopic parameters, such as the line strength, the Einstein-A coefficient and the pressure broadening coefficients required in fitting routines of spectra to obtain species densities are of most interest. Spectroscopic parameters of 47 molecules and their isotopologues are currently in the HITRAN database. Many of those are relevant for plasma spectroscopy such as H2O, CO2, O3, N2O, CO, NO, NO2, HNO3, and OH. A helpful tool for analysis of absorption spectra is the commercially available software Q-MACSoft-HT that visualizes the HITRAN database [51].
2.5.5. PNNL database.
Although the acronym 'PNNL database' is often used in the spectroscopic community, its full name is the PNNL Northwest-Infrared vapor phase infrared spectral library [52]. The database is freely accessible and contains information about infrared spectra of over 400 compounds. Although it does not contain information on the line-by-line spectroscopic parameters, the data give enough information to calculate effective absorption cross-sections.
2.5.6. The MPI-Mainz UV/VIS spectral atlas of gaseous molecules of atmospheric interest.
A further example for a cross section database is the MPI-Mainz UV/VIS Spectral Atlas [53, 54], which is a comprehensive collection of cross sections for gaseous molecules and radicals, primarily relevant to earth atmosphere research. These molecules often are the same that are relevant to atmospheric pressure plasma community. The database lists absorption cross-sections and photon yields for photochemical reactions. It is a collection of data sets from original publications. In addition, several spectra were obtained from databases of several research centers and via private communication. As of February 2015, the database contains 5722 cross section data files for 962 species, 151 quantum yield data files for 30 reactions, 1629 references, and 2536 graphical representations.
2.5.7. PGOPHER.
PGOPHER [55] is a software package to simulate rotational, vibrational and electronic spectra. It has been developed at the University of Bristol in the UK. With PGOPHER molecular spectra can be simulated from the basic spectroscopic parameters generally available in the literature to give line positions and line strengths. In this way, the lack of line-by-line spectroscopic parameters of radicals can be overcome as it has been reported in literature [56, 57].
2.6. Detection limit and sensitivity enhancement
Let us have a closer look at the Beer–Lambert law presented in section 2.2. The sensitivity achieved with an absorption spectroscopy technique can be characterized by the ratio of signal-to-noise (S/N). Signal (S) here corresponds to the measured fractional change of intensity through a sample, and noise, N, is the standard deviation of the baseline signal. In this case, it is evident that in order to increase the signal magnitude and thus the sensitivity of absorption spectroscopy, there are two relevant variables: the optical path length and the absorption cross-section. The path length may be increased, whether by a multipass cell or through the use of an optical cavity, as it is discussed in detail in section 2.6.1. The absorption cross-section, a measure of how strongly a molecule interacts with light, whilst not initially appearing to be mutable, is in fact variable. A given molecule absorbs at a wide range of wavelengths corresponding to transitions between different forms of energy levels (rotational, vibrational and electronic) with cross-sections varying by many orders of magnitude. However, in the process of choosing the right spectral region to use for absorption spectroscopy other factors come into play such as the availability of simple-to-use light sources and the possibility of multiple species absorbing at the same wavelength. Thus, it is important to choose the spectral region of your absorption measurement wisely (see section 2.6.2). Reducing the noise is another way to increase the signal-to-noise ratio. This can be achieved for example by using modulation techniques (see section 2.6.3).
2.6.1. Absorption length.
One main disadvantage of simple absorption techniques is that the absorption is measured with a line-of-sight approach. As a result, the determined density is a spatially averaged value over the absorption length. The same is true for the temperature or pressure obtained from the measured spectral profile. Related to that is the question: how accurate is the effective absorption path length known? The geometry of a plasma jet is generally very small (in µm to cm range). This severely limits the sensitivity of the method. In conventional linear absorption spectroscopy, an increase in absorption path length is often realized by folding the laser beam using multiple pass optics. Most commonly, two different types of multipass cells are used: White cell [58] and Herriott cell [59]. The multipass White cell consists of three independently movable mirrors (one field mirror and two objective mirrors) to adjust the multi-reflection pathway of the laser beam. This type of multipass cell has been used for example to perform MIR laser absorption spectroscopy of ozone in an atmospheric plasma jet [60]. The second type is the Heriott-type multipass cell, which relies on only two mirrors. It is more stable than the White cell but can only accept low aperture beams and requires large mirrors for long absorption path lengths. Herriott-type multiple-pass cells, however, are less prone to etalon formation than are White cells. Often an astigmatic Herriott-type multipass cell is used, for example in the case of tunable diode laser absorption spectroscopy to detect the NO production rate of an atmospheric plasma jet [61]. The absorption path length is generally below 100 m when a multipass cell is combined with a plasma jet. Furthermore, in the case of a plasma jet with its small geometry, the effluent has to be placed in the multipass cell and the concentration measured corresponds to the average concentration over the measuring volume, i.e. the entire volume of the multipass cell. This makes it harder to establish a direct correlation between the measured densities in the multipass cell and the production rate of species in the plasma jet. Despite these disadvantages, it has been shown that with this method very accurate concentration measurements of species generated by the plasma jet can be performed [60, 61]. In [60], complimentary OES measurements are used to determine the space-resolved distribution of the densities. Increasing the effective absorption length by employing high finesse optical cavities can provide increased sensitivities as kilometric path lengths can be achieved at inherently small base lengths in a small volume. For details on cavity ring down spectroscopy (CRDS) and cavity enhanced absorption spectroscopy (CEAS) techniques, see [62, 63] and references therein. This method is ideally suited for localized measurements in plasma jets. For more details, see the devoted contribution in this special issue cluster.
2.6.2. Choice of the spectral region.
As mentioned in the beginning of this section, it is important to choose the spectral region of the absorption measurement wisely. Firstly, a given molecule absorbs at a wide range of wavelengths corresponding to transitions between different forms of energy levels. Strong electronic transitions mainly occur in the UV and visible spectral range, while strong fundamental vibrational transitions are in the MIR spectral range (3–20 µm). In the NIR, many transitions in overtone and combination bands of molecules have their absorption wavelength, although these are generally weaker than in the UV or the MIR. As a consequence, the absorption cross-sections for the same molecule vary by many orders of magnitude over the whole spectral region. Furthermore, the absorption cross-section is temperature dependent. This means that the ideal transition to use to obtain the highest sensitivity changes with the temperature of the species in the plasma. In connection with this, the temperature of the species under investigation has to be known to ensure that the correct value for the absorption cross-section is used to determine the density from the measured absorption spectra. Another aspect that needs to be taken into account is that in the UV and NIR range, light sources are more readily available than in the MIR domain. This comes with the drawback that spectra are more congested in the UV and NIR spectral region compared to MIR. One of the main problems of working in the UV region is that many molecules have absorptions there in a small spectral window, meaning that at one specific wavelength multiple molecules can absorb light and overlap of molecular spectra easily occurs. This makes selectivity for the respective species under investigation more difficult. Absorption spectroscopy on atmospheric plasma jets has another aspect that needs to be considered when choosing the spectral region for the absorption spectroscopy experiments. Working at atmospheric conditions means that molecules present in the surrounding atmosphere are also detected at certain wavelengths, this is especially true for water and carbon dioxide. Due to their strong absorption cross-sections and their high abundance in the atmosphere, these species efficiently absorb NIR and MIR radiation. Therefore, they may disturb significantly the diagnostic of other species. For example, NO2 and water absorption spectra overlap in many spectral ranges. By using the very narrow spectral radiation of laser sources, a spectral region can be selected with high specificity, i.e. where the overlapping is negligible or well contained. Moreover, the 3–5 µm and 8–10 µm MIR regions are relatively free of atmospheric absorbers such as water vapour.
2.6.3. Light sources for absorption spectroscopy.
A key item of an absorption spectroscopy experiment that has a big influence on the choice of the spectral region is the availability and properties of light sources. Especially the introduction of new light sources applied to plasma spectroscopy has triggered the use of absorption spectroscopy for smaller and smaller absorption lengths at shorter and shorter integration times. Two separate developments were significant. The wavelength range extension of light emitting diodes (LEDs) to the UV spectral range [28, 64], and the development of new laser sources including novel broad band lasers with high time resolution [65], or the introduction of simple to use quantum cascade laser systems for the MIR spectral region [66]. The extension of the wavelength range of light sources and their increased stability has significantly improved absorption spectroscopy in the last decades. A few light sources are described briefly in the following—quantum cascade lasers are discussed in more detail in section 3.4.2. The use of VUV radiation grants the access to light atoms such as O, N or H, as their transitions from the ground state usually lie in the VUV spectral range [67]. In this spectral region, two-photon techniques such as TALIF allow diagnostics without the use of vacuum ultra violet radiation [6] at the significant drawback that calibration is intricate. The most common way to generate VUV radiation is by discharge lamps. Other means to generate VUV generation is by stimulated Raman Scattering. Here, Raman Anti-Stokes radiation is generated when energy is transferred from the scattering molecules to the scattered photons. This occurs only when excited states are present, which can transfer additional energy to the incident photon. Raman scattering of intensive laser light generates a multitude of Stokes transition resulting in many excited states. This technique has been used to generate VUV Laser radiation at and below Lyman α [68, 69]. Many other interesting light sources ranging from the extreme UV (EUV) to the UV have been reported in literature to study low pressure plasmas using absorption spectroscopy. A pulsed soft x-ray source was used to generate EUV light [70, 71] and VUV radiation was created with a deuterium lamp [72]. For resonance absorption, a high pressure N2 microdischarge hollow-cathode lamp [73], a dual-tube inductively coupled plasma light source [74] and via a surface wave excited discharge in Ar/O2 at 130 nm to measure O atoms [75] were used. In the UV spectral region, the commonly used Xe or D2 lamp sources [46, 64] are being increasingly replaced by UV LEDs [64, 72, 76]. The main reason behind this is that the former are unstable, leading to baseline fluctuations, reducing the sensitivity of the technique. Whereas LEDS have such a stable baseline that here, the baseline noise is the limiting factor (<10−4). LEDs are solid-state light sources which provide a very bright light point without intensity fluctuations when the LED is thermo-regulated and fed by a stabilized current source. They cover the spectral range 240 nm–1500 nm with power >200 μW. Each diode has typically a spectral width of about 15 nm [28, 64, 76]. To enhance the quality of the setup, a collimating optics as shown in figure 1 can be applied, which transforms the LED into a point source and with the help of a lens produces a collimated beam [77].
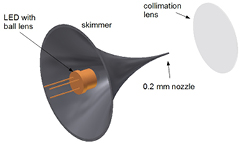
Figure 1. Skimmer and lens setup for collimation of a Broad band LED (©2013 Reprinted by permission of Wiley, Inc from [77]).
Download figure:
Standard image High-resolution imageAn interesting new light source presented recently is a broadband light source (200–1000 nm), which is actually a laser induced plasma light source (laser-driven light source, Energetiq Technology, Inc.) for broadband absorption spectroscopy. A novel absorption spectroscopy setup was presented which allowed 250 nm-wide spectra to be recorded with random noise and baseline stability better than 10−4 [78]. A further option is to use the emission of discharges, containing the same species as in the plasma under investigation, as light sources. One main issue in resonance absorption spectroscopy is the fact that the Beer–Lambert law (equation (4)) cannot be straightforwardly applied to determine the density of absorbing species. Let us consider the case where a lamp is used as the light source emitting radiation from transitions of the same atomic species under investigation in the plasma. Furthermore, both the emission from the lamp and the absorption in the plasma are assumed to have Gaussian profiles. The resultant transmitted spectral profile shows a dip in the centre of the profile which increases with increasing absorber density. Mitchell and Zemansky have published an extensive work on the theory behind resonance absorption spectroscopy and how to analyse the data [79]. Here, a brief formulism on how to determine the density for the considered case is given [80]. The emission spectral profile of the lamp is expressed by
and the absorption spectral profile by
The Doppler widths of the emission spectral profile  and the absorption spectral profile,
  , are calculated using equation (21) and it is assumed that

where f is the oscillator strength and Na the absorbing atoms density.
The intensity of the transmitted light through the plasma with absorption length L is expressed as
The absorption rate, AL, is described by
where  with Te being the temperature of the emitter and Ta of the absorbing medium. When f , L and α are known, the absorbing atoms density, Na, can be deduced from a measurement of AL. Note that the above relation only applies to a single line with Doppler line profiles. A modified Mitchell and Zemansky theory has been recently used for the study of atmospheric pressure plasmas [81, 82].
2.6.4. Improving signal-to-noise ratio.
As mentioned above, one possibility to increase the sensitivity of an absorption technique is noise reduction. The contributions to the signal baseline noise, which limit the minimum detectable absorption, have a variety of sources in an absorption spectroscopy experiment (e.g. electrical, mechanical, optical...). In every absorption experiment, the detector itself has a signal-independent intrinsic level of noise associated with the light-generated charge carriers within a photodetector. The major two are known as shot noise and white noise. The former is also called quantum noise, due to shot noise that arises from the discrete nature of detection events; in this case, the incidence of photons on the detector, and the fluctuations within these event occurrences. The latter is associated with the Johnson–Nyquist power noise arising from thermal perturbations of the electrons within the detection system [83]. As white noise is random, averaging can minimize its influence in the measurements. In practice, the sensitivity limits imposed by these sources of noise are typically of the order of absorptions within the 10−2–10−3 range (down to 10−5 levels may be achieved adopting a dual-balanced detection scheme), since other sources contribute to the overall noise level. Generally, these contributions fall under the category of 1/f noise or pink noise, so called because its contribution at dc can be orders of magnitude higher than in the high frequency (>kHz) regime. Its physical origins are still unclear, but may include thermal, mechanical, and acoustic fluctuations to which the experiment is exposed, as well as phase and amplitude noise associated with the laser itself. These noise levels are not necessarily the limiting factor in an experiment, and can be greatly reduced by moving detection to a higher frequency regime by using modulation techniques based on phase sensitive detection, as these noise levels tend to decrease with 1/ f [84]. But besides the detector noise sources, other contributions from a laser absorption based setup need to be considered. Noise sources outside the detection system can include, for example, power fluctuations in the laser, or etalons formed between reflective surfaces that can all introduce variations in the baseline that interfere with the absorption information. Moreover, this kind of noise sources is more difficult to control. If fractions of absorption on the order of 10−2–10−3 are typically measurable by direct absorption, using modulation techniques, fractions of absorption on the order of 10−5–10−6 are generally detectable [85, 86], with species detection limit in plasmas down to ppt range (see [86]). Very low species detection limits in plasma can be achieved by means of phase sensitive detection using modulation of laser intensity or wavelength, Stark or Zeeman effects, particle density (plasma) modulation. Except the laser modulation techniques, the other methods can change the plasma characteristics. Thus, they are inappropriate for plasma diagnostic if we wish a non-intrusive approach. Plasma modulation may be a solution for atmospheric pressure pulsed discharges and for species having short lifetimes. Here, the principle of laser wavelength modulation is described [84, 86, 87], above-mentioned techniques having a similar principle. The laser wavelength is modulated before being transmitted through the absorbing plasmas. For instance, in case of diode lasers, this is done by using a function generator (e.g. the internal function generator of a lock-in device) by applying a sine signal of small amplitude at a frequency in the kHz range on top of a low frequency laser tuning over the transition of interest, which slightly changes the current through the diode laser device. As a result, the wavelength of the laser is then modulated. A reference signal is given to a lock-in amplifier. The laser light transmitted through the plasma is then converted into a photocurrent by a photodiode and is analysed at the modulated frequency or at higher harmonics using a lock-in system. The lock-in amplifies the modulated absorption signal, multiplies it by the lock-in reference signal and integrates the product over a time much longer than the period of the modulation signal using a phase sensitive detector. Because of the orthogonality of the sinusoidal functions, the contribution of any signals that is not at the same frequency is attenuated to zero. Therefore, noise signals at any other frequency are cancelled out. The lock-in needs to lock the phase difference between the two signals and to adjust it to zero in order to maximize the absorption signal. If the laser wavelength is sinusoidally modulated at frequency ω, such that  , and is tuned over a weak absorption line (i.e.
  ), it can be shown by Taylor development that the absorption fraction is [88]:
For sufficiently small modulation amplitude, a << νL, the first terms in each squared bracket are much larger than the terms that follows. Thus, behind the lock-in amplifier, the signal amplitudes in first, second and third harmonics are proportional to first, second and third derivatives of the absorption coefficient, respectively. For plasma sensing, the even harmonics are of most interest, because they have non-zero values at the line center. For Lorentzian profiles (which are typical absorption coefficients in atmospheric pressures plasmas), higher harmonics give in principle smaller signals. If signals are normalized to the 2nd harmonic, then we have at line center a signal of 53% in 4-th harmonic, 36% in 6-th harmonic and 27% in 8-th harmonic, respectively [89]. However, even if the signal decreases in higher harmonics, if noise is dominated by etalon signals (or optical feedback) and not by absorption noise, then employing higher harmonics may be favourable [89–91]. The key instrument in the phase sensitive detection techniques is the lock-in amplifier. Nowadays, fast multichannel lock-in devices are commercially available with input bandwidth of up to 600 MHz, time constants down to 30 ns and dynamic reserve of 100 dB. The benefit inherent in transposing the detection band to an even higher (MHz) frequency regime is expected to further reduce the noise contribution, although this is not always found to be the case as an increase in the thermal noise, due to low power levels and high-bandwidth detectors, tends to become the limiting factor. These advanced characteristics are important, for instance, when using absorption with novel high repetition frequency lasers.
2.7. Techniques of spatial resolution
Absorption spectroscopy is in general a line-of-sight diagnostic technique. To achieve space-resolved densities [92] from the line-of-sight integrated densities, without inserting a probe into the plasma, several approaches are possible [93]. Tomography is the most precise method to achieve spatial resolution by multiple angle measurements although it requires very high experimental effort. It has been applied to turbulent flames, e.g. by Samoro et al [94]. With this technique, projections of the density profiles are taken at different angles. From these measurements, a reconstruction of the 2D-profile can be achieved. The advantage is that arbitrary profiles can be studied and no previous assumption on symmetries needs to be made. An estimate of the space resolved ground state density can be derived by the following tomographical approximation. From two transversal scans of the plasma, the local density in the section plane can be determined with trade-offs in accuracy via [95, 96]:
In [95, 96], a rectangular shaped jet was investigate regarding its ozone density distribution (see section 3.3.1).
Under the simplifying assumption that the profile is axisymmetric, several other techniques can be applied. Most commonly used techniques are firstly Abel inversion, secondly onion peeling and thirdly Fourier deconvolution. In onion peeling, the investigated plasma is sectioned into concentric rings. Firstly, the line-of-sight outer most regions representing the outer ring density is measured and subtracted from the remaining densities. Subsequently, the next ring is analysed. This process is repeated yielding the complete density distribution. Disadvantage of this method is that small errors at the outer edge accumulate to larger errors towards the centre. Probably the most commonly used method to gain density distributions from line-of-sight measurements is Abel inversion, which leads to a line-of-sight density as a function of radius [97, 98]. It has been applied in many different atmospheric pressure discharges for absorption spectroscopy. The Abel integral is given by:
with τ the optical depth, k the absorption coefficient at the position y, and r and z the radial and axial coordinates. R is the distance at which the absorber density has decreased to zero (see figure 2).
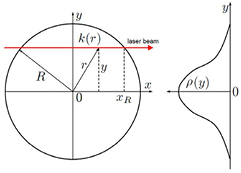
Figure 2. Illustration of the relation between spatial absorption coefficient distribution k(r) and line-of-sight optical depth τ(y) [99] (© IOP Publishing. Reproduced with permission. All rights reserved).
Download figure:
Standard image High-resolution imageAssuming that the gradient for τ is higher than 1/r, for an axisymmetric absorber distribution, the inverse Abel transform is given by equation (41b) and thus, from the optical depth τ, the absorption coefficient can be calculated (see e.g. [99]) as:
As the inversion process is highly sensitive to noise, usually the measured data is fitted using e.g. two Gaussian profiles and the derivative of the optical depth profile is performed on the fitted data. Abel inversion is a versatile tool, which has been applied in many studies of atmospheric plasma jets [60, 100, 101] e.g. in [18]. N2(A) Metastables were detected in cavity ring down spectroscopy (CRDS), in [99], metastable helium atoms are studied. If a used a fitting procedure of an analytical density profile to the Abel transformation is used, complex profiles can be analyzed [101]. A simplified version of Abel transformation is the line integration method [102, 103]. A direct spatial resolution can be achieved by performing two measurements simultaneously with two light beams crossing each other perpendicularly. One example for this is the double beam modulated linear absorption technique described by Moskowitz [104]. Here, a modulated pump laser beam of high intensity is used to saturate the transition and thus deplete the investigated state. A split beam of the same laser but with significantly less intensity is used as probe beam at an angle of 90°. By a pulsed modulation of the saturating beam, a modulated absorption of the probe beam can be detected yielding a signal proportional to the state density.
2.8. Techniques and limits of time resolution
Absorption techniques can probe time-resolved species densities and temperatures when plasmas exhibit temporal behaviour. This can be done in two ways, either using a pulsed light source while the detector is constantly recording, or using a dc light source while gating the detector. From the UV to MIR, commercially available lasers such as Nd:Yag, dye and semiconductor lasers, are commonly pulsed in the ns-time domain. At present, new ultrafast picosecond and femtosecond lasers with tuning possibilities in the UV to NIR range are available at repetition frequencies of tens of kHz (used mainly for LIF and CARS experiments). Concerning detection systems, fast response time detectors and high bandwidth amplifiers are needed. UV to NIR ICCD cameras are now available with gate widths below 0.5 ns. In MIR, photo-detectors with ns response time are also accessible. Even faster detectors such as streak cameras are commercially available. However, time-resolved absorption spectroscopy is often limited by the reduced sensitivity. Enhanced detection is done not by measurements of the fraction of absorption but by the induced fluorescence light. From a spectral point of view, time-resolved absorption measurements are performed in different ways. Lasers are tuned either very fast (much faster than the species characteristics time) over the entire absorption feature, which is then recorded with a given time-step (e.g. [105]), or by simultaneous or sequential measurements at two wavelengths, (first at the absorption peak and then off-resonance) or at several wavelength over the absorption profile (e.g. [106]). In the first case, broadening changes in time may be recorded, and, therefore, the method is more appropriate. If the plasma is periodically changing, then average techniques can be used to improve the signal-to-noise ratio. High frequency lasers are of interest for noise reduction in repetitive discharges, but also for a single plasma event with a time scale longer than the inverse of the laser pulse frequency
3. Absorption spectroscopy for jet-like atmospheric pressure plasmas
Chapter 3 introduces work performed to date on the topic of absorption spectroscopy on atmospheric plasmas. Here, cold atmospheric plasma jets applicable in the field of plasma medicine form the focus. The chapter is sectioned according to wavelength from VUV to MIR, and the main techniques are discussed and examples are given. Where necessary or helpful, other plasma sources including low pressure plasmas are covered to present special techniques or interesting approaches or highlight an experiment that could be also transferred to the diagnostics of plasma jets.
3.1. Typical setups of absorption spectroscopy
Absorption spectroscopy is one of the simplest techniques to measure absolute densities. A simple setup consists of a monochromatic light source, an absorber (the plasma jet) and a detector (see figure 3(a)). The setup can be made more versatile by using a broadband light source and a spectrograph (see figure 3(b)). With this setup, the probed transition can be selected and absorption profiles can be measured. From the absorption profile, absolute densities can be gained. Instead of the broadband light source, a tuneable light source can be used, reducing the need for a spectrograph (see figure 3(c)). When a laser is used as light source, the plasma background radiation can be reduced to a minimum by using the appropriate filters and the accuracy can be improved.
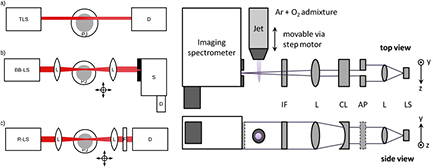
Figure 3. Left: (a) simple absorption setup: wavelength tunable light source (TLS), plasma jet (PJ) and detector (D); (b) broad band light source (BB-LS), focussing optics (L) and spectrograph (S) with detector (D); (c) resonant light source (R-LS), focusing optics (L) and filter (F); right: single measurement radial profile ozone absorption measurement setup: LS: UV-light source, L: lens, AP: aperture, CL: cylindrical lens, IF: interference filter [60] (© IOP Publishing. Reproduced with permission. All rights reserved).
Download figure:
Standard image High-resolution imageIn some studies, the investigated jet is placed inside an enclosed chamber to control the gas atmosphere surrounding the plasma jet. Here, it has to be considered that the flow conditions will most probably be different than in open-air operation. This can for example be done by comparing measurements in the chamber and in open atmosphere (see e.g. [95] for ozone absorption).
To use the advantage of measuring a complete radial profile of a plasma jet in a single measurement, an imaging detection system can be used. Combined with a spectrograph, both wavelength selection and parallel data recording can be achieved. Usually, the plasma is installed on a stepping motor stage to allow space-resolved, or for the case of the imaging optics axially resolved measurements. In radially symmetric cases, Abel inversion can be performed to gain space-resolved densities. If the precise wavelength of the light source is not known, such as, e.g. for tuneable diode laser spectroscopy (TDLAS), reference measurements have to be performed.
The typical apparatus used for measuring the spatial and temporal density of rare gas metastables by TDLAS is shown schematically in figure 4. To protect the diode from back-reflections an optical isolator is used. The laser beam is attenuated (to avoid saturation of the photodiodes (PD) and of the probed transition in the plasma) using neutral filters, and subsequently split into three branches by two beam splitters (BS). All three laser beams are detected by photo diodes and the signals are recorded with an oscilloscope. A shutter could be used to record separately the plasma emission and absorption signals. The first beam passes through an absorption cell filled with a reference gas (usually of the probed species) for spectral identification. The second beam passes through a Fabry–Perot interferometer. This branch allows to convert the relative spectra x-axis in wavelength units and to ensure the single-mode operation of the laser, i.e. that the frequency scanning is performed continuously without jumping between different modes of the laser resulting in frequency discontinuities. This jumping is called mode hopping. During the measurements of the spectral profiles, the laser frequency is scanned over a larger spectral range than that FWHM of the studied absorption line. In this way, a reference line profile is thus obtained and this branch is used to tune the laser frequency exactly to the maximum value of the absorption line profile corresponding to the central wavelength of the absorption line. The laser frequency can then be tuned precisely over the spectral profile of interest by varying the current and temperature of the laser diode. Finally, the third beam passes the plasma jet, and, from its fraction of absorption, the density of metastable atoms is obtained. For time-resolved measurements, the photodiode detector should have a fast time response (preferably ns) since the lifetimes of He and Ar metastable states are of few μs under typical experimental conditions. For probing the lowest metastable states of Ar, Si photodiodes and for He, InGaAs photodiodes are recommended.
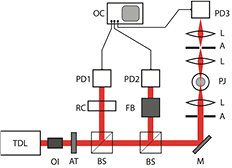
Figure 4. Typical setup used for TDLAS. TDL: Tuneable Diode Laser, OI: Optical Isolator, AT: Attenuator, BS: Beam Splitter, M: Mirror, A: Aperture, L: Lens, PJ: Plasma Jet, PD: Photo Detector (PD3: fast PD), RC: (low-pressure) Reference Cell, FB: Fabry–Perot interferometer, OC: Oscilloscope.
Download figure:
Standard image High-resolution imageFigures 5 and 6 show typical time-averaged absorption spectral profiles of the Ar (811.5 nm) and He (1083 nm) lines obtained from a planar RF (13.56 MHz) driven APP jet and a co-axial RF (1 MHz) driven APP jet, respectively. Other examples can be found in [107–111] for Ar and in [99, 107, 112–114] for He. Note that as the upper level 23P of the He 23S1 → 23P0,1,2 transition consists of 3 sub-levels with J = 0, 1, 2, the spectral absorption profile has three components. While at low pressure this fine structure can be easily seen (see figure 6(a) for the case of the low pressure reference discharge), at atmospheric pressure, the J = 1, 2 components are mixed and not distinguishable due to pressure broadening of the lines (see figure 6(b) for the case of the atmospheric plasma jet). However, the J = 0 component is still distinctly observable even at atmospheric pressure. In order to determine the absorption coefficient, all absorption spectral lines should be fitted with Voigt profiles. For the case of helium, the absorption spectral profile should be represented by the superposition of two Voigt profiles, each for one fine-structure component, with a separation of 2.3 GHz and an intensity ratio of 5 to 3, according to their statistical weights. The Gaussian component of the absorption profiles, resulting from Doppler broadening, can be calculated from the value of the gas temperature, determined separately. The Lorentzian component should be varied until the calculated absorption profile fits the measured line.
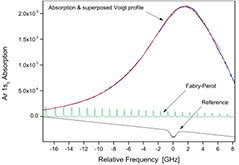
Figure 5. Pressure broadened absorption line profile of the Ar* 1s5 → 2p9 transition (blue). Also shown are the transmission peaks of the Fabry–Perot interferometer (green), the absorption signal from a low pressure reference discharge (black) and the Voigt fit on the profile (red). Measurements have been taken while operating a planar RF driven APPJ at 2 slm He flow with 5% Ar admixture and a power level slightly below the arcing threshold. The horizontal axis scale shows the frequency distance of the spectral features. From [107] (With kind permission from Springer Science and Business Media).
Download figure:
Standard image High-resolution image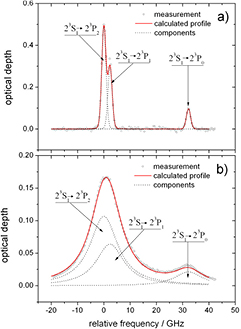
Figure 6. Time-averaged spectral absorption profile for (a) the low pressure He discharge lamp and (b) the kinpen Sci (atmospheric pressure, y0 = 0 mm, z0 = 0.1 mm). The solid curve is the superposition of the calculated absorption profiles for the three fine structure components (dashed lines). The zero point of the relative frequency axis refers to the peak position of the 23S1 → 23P2 component. From [99] (© IOP Publishing. Reproduced with permission. All rights reserved).
Download figure:
Standard image High-resolution imageAs information about the Lorentzian and Gaussian part of an absorption line is best distinguished by the wings of the absorption line, it is important to scan over the line to the point where the absorption is zero. As most diode laser mode hop free tuning range is smaller than the absorption of a broadened line at atmospheric pressure, most scans are taken with the line maximum not in the centre of the tuning range. A different approach has been proposed by Bösel et al [115–117]. Using intracavity acousto-optic modulators, the wavelength of a Littrow type diode laser system is tuned mode-hop-free. The external resonator modes and the grating selectivity are independently and electrically alterable by two AOMs. Thus, a tuning of the external resonator over up to 1900 GHz is possible [116]. A precise computer control of laser diode and AOMs allowed a single-mode tuning of the whole laser with a tuning range of 225 GHz in 250 s. Additionally, a fast tuning over 90 GHz in 190 μs and a repetition rate of 2.5 kHz were demonstrated. The application was shown at higher pressure in a Hydrogen discharge [118].
3.2. VUV absorption spectroscopy
A lot of species relevant for cold atmospheric plasma jets absorb in the VUV-spectral region. Especially, atomic species exhibit absorption features in that regime. However, VUV absorption spectroscopy at ambient conditions has the drawback that the VUV radiation is strongly absorbed due to the high absorption coefficients of humid air species in this spectral range. Plasma jets studied with VUV radiation are usually placed inside a vacuum vessel to control the ambient gas. Furthermore, light sources in this spectral range are scarce (see section 2.6.3). VUV absorption spectroscopy has been applied in monitoring and studying of depositing low-pressure plasmas (see e.g. [76]) and has been proven to be a suitable technique to diagnose the main reactive species in oxygen discharges [119]. Nevertheless, there are several examples, where atmospheric plasma jets are studied with VUV absorption spectroscopy, as described in the following.
3.2.1. Singlet delta oxygen: O2(a1▵g).
Being one of the most reactive species among the ROS, singlet delta oxygen (O2(a1▵g)), the first electronically excited low-energy state of O2, has attracted the attention of many scientists working in almost every field of natural sciences, from physics to medicine, through chemistry and biology. O2(a1▵g) most remarkable feature is its extremely long and unique radiative lifetime of more than 75 min in the gas phase [120]. O2(a1▵g) is very resistant against homogeneous and heterogeneous relaxation processes [120] and can thus transport its energy far away from its place of production. This energy donor is useful for a large spectrum of applications, including removal of air pollutants [121], degradation of synthetic polymers [122], combustion [123], laser excitation [124], and biomedicine [125]. However, O2(a1▵g) is difficult to produce efficiently and detect accurately. A topical review concerning the production of O2(a1▵g) in low-temperature plasmas in various types of electric discharges and its detection by a variety of different experimental methods can be found in [126]. Although challenging, there are many different approaches for detecting O2(a1▵g), taking advantage of its specific chemical, spectroscopic and magnetic properties (e.g. [119, 126]): infrared emission spectroscopy, vacuum absorption spectroscopy, calorimetry, electron paramagnetic resonance, photoionization, Raman spectroscopy, intracavity laser spectroscopy, ring-down spectroscopy, and cavity-enhanced absorption spectroscopy. Each of these techniques has its own advantages and disadvantages, in terms of simplicity, sensitivity, selectivity, reliability, accuracy, and cost. The presence of O2(a1▵g) can be detected by its infrared emission at 1.268 µm. This is commonly used for measuring O2(a1▵g) concentration. However, this emission is extremely weak, since the transition is strictly forbidden for electric dipole radiation, being only permitted for magnetic dipole radiation, with the Einstein coefficient being of the order of magnitude of 10−4 s−1, equivalent to a radiative lifetime of approximately 4500 s [127]. Nevertheless, Sousa et al have successfully developed a very simple and online method for the accurate determination of O2(a1▵g) absolute density, based on the infrared emission of O2(a1▵g) at 1.27 µm [128]. This method has been used to determine the O2(a1▵g) absolute concentration in the effluent of a single [129] or multiple micro-cathode sustained discharges (MCSD) [130], as well as in two pulsed kHz-driven APPJs with different geometries [131, 132], in the effluent of an ac MHz driven APPJ [133], and two geometrically different RF-driven APPJs [132, 133]. Even though this concentration measurement technique based on the infrared emission of O2(a1▵g) is simple to implement, it yields no spatial resolution and the measurements can only be performed in the effluent within a sampling detection cell and not in the main discharge region. Additionally, to obtain absolute concentrations from emission measurements, some prior assumptions concerning the spatial distribution of O2(a1▵g) in the sampling cell and estimations regarding the probability of a photon emitted within the detection cell reaching the detector have to be made.
A more accurate and reliable method for measuring the O2(a1▵g) absolute density is based on VUV absorption by O2(a1▵g) molecules. In fact, O2(a1▵g) largely contributes to the light absorption between 125 and 130 nm in the atmosphere, as well as in cold atmospheric plasmas [119]. At 128.5 nm, the absorption cross-section of O2(a1▵g), σa = 167 × 10−19 cm2, is 40 times larger than that of the ground state, O2(X3 ), σX = 4 × 10⁻¹⁹ cm2 [134]. The absolute density of O2(a1▵g) can thus easily be deduced using equation (12). As the contribution of O2(a1▵g) to light absorption is negligible for wavelengths above 130 nm but lower than 140 nm, the VUV absorption method can also provide the absolute density of the ground state molecules, O2(X3
 ) [135]. Hence, the O2(a1▵g) production yield can be directly measured by this method without any assumption about the value of the gas temperature. Figure 7 shows typical measured VUV transmission spectra. The difference between curves 2 and 3 is due to absorption by O2(a1▵g). For more details on these data see [128]. Furthermore, the VUV radiation at 144.1 nm and 148.7 nm [136], wavelengths for which the cross sections are well known, can also be used for absolute O2(a1▵g) density determination by VUV absorption spectroscopy. VUV absorption spectroscopy is thus a versatile technique well suited to detect singlet delta oxygen species.
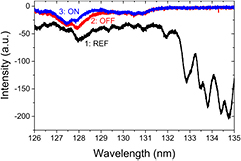
Figure 7. Typical VUV spectra: black curve 1: reference spectrum of a VUV H2 source [119] (no absorption); red curve 2: transmitted spectrum of an Ar/O2 mixture (9 slm of Ar with 1% of O2) at a total pressure of 145 mbar (plasma OFF); blue curve 3: transmitted spectrum while operating at the experimental conditions of curve 2 an array of 4 MCSDs [130] at an equal current per discharge of 5 mA. From [128] (© IOP Publishing. Reproduced with permission. All rights reserved).
Download figure:
Standard image High-resolution image3.2.2. O2-molecules.
For VUV absorption spectroscopy, very often plasmas are used to generate this radiation. Therefore, a majority of plasma VUV absorption measurements are resonant absorption spectroscopy measurements. The energy of the VUV photons is high, so that the non-invasiveness claimed for the technique cannot always be guaranteed, since pre-ionization by VUV photons can influence the breakdown of discharges, as shown in the case of surface spark discharges [137]. In [138], resonant absorption of VUV radiation was used to detect oxygen (see also [139]), nitrogen and hydrogen atoms. Quantification of absorption cross-sections is relatively easy by comparing the results to titration experiments, for example, of oxygen atoms with NO [67]. Titration as an alternative to absorption spectroscopy has also been applied to atmospheric plasma jets [140, 141]. Moravej et al used a titration method in combination with infrared absorption to measure the atomic oxygen density in an rf plasma jet [141]. O-atoms were titrated with NO and the resulting NO2 was determined in an absorption cell by IR-absorption spectroscopy.
VUV radiation generated by plasma jets can reach long distances from the plasma jet nozzle. In a planar APPJ, VUV radiation was detected up to 10 cm distance from the nozzle while operated in ambient conditions [6]. It could be shown that this VUV radiation contributes significantly to the atomic oxygen generation in the jet effluent [95]. As a result, absorption by atmospheric oxygen could be observed in spectra at even greater distances [142]. The absorption of jet generated argon excimer radiation was utilized in [135] to determine the molecular oxygen diffusing from the surrounding air in the effluent of an argon plasma jet. Figure 8 shows the excimer continuum of the discharge measured end-on at 4 mm and at 10 mm distance to the spectrometer window. The absorption by this oxygen diffusing into the jet effluent can be clearly seen at 10 mm distance. The solid line is the fitted background used to calculate the absorption. With the help of a novel analytical approximation solution of the convection-diffusion-equation for near field fluid jets [143], molecular oxygen on axis absolute densities were evaluated.
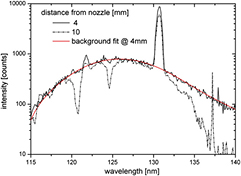
Figure 8. Argon excimer emission from a kinpen with absorption features originating from molecular oxygen [135] (© IOP Publishing. Reproduced with permission. All rights reserved).
Download figure:
Standard image High-resolution image3.2.3. O and N atoms.
For light atoms, the transitions of the ground state to the first excited state are of high energy and require VUV photons. While lasers can be employed as VUV source, e.g. by Anti-stokes Raman scattering [69], often, these photons are generated by discharges using the same type of gas as the studied plasma. These discharges emit resonant photons for the desired transition. As shown above, photons from the studied discharge itself can be used. This self absorption usually also resonant can be used to detect e.g. metastable argon ions [144]. A thorough scientific work comparing resonant self-absorption with laser absorption on argon metastables is presented in [145]. Resonant absorption has been used for detection of oxygen (ground state and metastable) or nitrogen atoms in low-pressure plasmas (see e.g. [73, 75, 146]). Iseki et al also used an enclosed vessel at controlled conditions (argon atmosphere) and studied the ground state atomic oxygen densities with resonant absorption spectroscopy. The oxygen density correlated to the D-value of spore inactivation at D-values around 10 [147]. Jia et al deduced the absorption length for the O-densities measured by VUV absorption from TALIF measurements [148]. The oxygen densities measured with the same setup by Takeda et al [149] were in the order of 1014 to 1015 cm3. These are the expected values for argon discharges with molecular admixture as determined by TALIF measurements [135, 150].
Recently an unusual approach to determine absolute atomic densities in an atmospheric plasma jet was performed using the continuum synchrotron radiation at the VUV beam-line at the SOLEIL synchrotron facility [151]. With an all-reflective Fourier-Transform spectrometer, and the beam-line, a λ/Δλ of 106 could be achieved at an instrumental resolution of 0.87 cm−1. This resolution is high enough to resolve the atomic oxygen triplet (see figure 9).
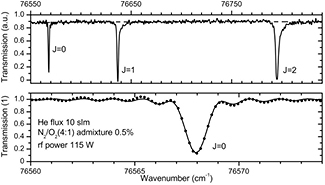
Figure 9. Resolved atomic oxygen triplet measured in a jet like setup by VUV continuum synchrotron radiation absorption. In this setup the plasma source had to be adapted to be operated in ultrahigh vacuum conditions required for the synchrotron beam-line. Reprinted with permission from [151]. Copyright 2013 AIP Publishing LLC.
Download figure:
Standard image High-resolution imageTo conclude, VUV absorption spectroscopy offers the possibility to diagnose a variety of different reactive species generated by atmospheric plasma jets. Even light atoms can be absolutely characterized without intricate calibration procedures. The high absorption of VUV radiation in ambient conditions, however, make measurement setups complex and sometimes requires the operation of the plasma jets in an artificial environment, which makes it difficult to transfer the results to real in situ situations.
3.3. UV absorption spectroscopy
In the UV-spectral range, many molecular species have high absorption cross-sections—usually several orders of magnitude higher than in the infrared spectral range. This makes UV absorption spectroscopy a relatively sensitive method for species detection. However, the spectral overlap between the species is drastic and measures have to be taken to avoid misinterpretation or over-estimation of species densities. Figure 10 shows absorption cross-sections for 6 different species relevant in many applications of cold plasma jets. The data was taken from [53] and citations within the database. These are namely [152–154] for ozone [155, 156], for N2O5 [157, 158], for H2O2 [159], for NO3 [160], for NO2, and [161] for HONO.
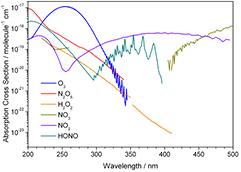
Figure 10. Absorption cross-sections of dominant species in humid air plasmas (Data taken from [53, 54].
Download figure:
Standard image High-resolution imageIn [162], the authors studied a broad gap DBD discharge for inactivation of microbes. For their absorption spectroscopic measurements, they took advantage of the fact that throughout the spectrum from 200 to 800 nm the domination in the absorption cross-section varies from species to species. In a similar figure to figure 10, the authors have pointed out that there are regions where UV absorption by certain species dominates that of the others. For example, while at 256 nm ozone absorbs one order of magnitude higher than other UV absorbing species, at 400 nm the absorption cross-section is several orders of magnitude higher for NO2 than for other species. A deconvolution of the broadband absorption spectrum across all expected molecules yields total densities of a wide range of species. Observing the large overlap in figure 10, it is clear that this method has its limits and ultimately the advantage of high selectivity in the MIR spectral range has to be preferred (see chapter 3.4).
3.3.1. Ozone (O3).
One of the most studied species absorbing in the UV spectral range is ozone due to its large absorption cross-section around 250 nm and its dominant abundance in cold atmospheric oxygen containing plasmas. For example, with a deuterium lamp and a photomultiplier, a wire to plate streamer discharge was diagnosed for ozone in atmosphere surroundings [163]. Cold plasma jets have been studied by UV absorption spectroscopy almost since their first appearances in the late 1990s (see, e.g. [164, 165]). In [166], not only ozone but also O2F was diagnosed in a parallel plate jet (APPJ) used for etching tantalum with CF4 admixtures. Most easily, Hg lamps are used because of the dominant emission line at 254 nm at the central absorption wavelength of the Hartley bands. Since ozone has a long lifetime at ambient conditions, in [167], the ozone generation of a micro cathode sustained discharge sampled to an absorption cell 30 cm from the effluent was studied. The light source was a deuterium lamp and the absorption length was 50 cm. Due to the long absorption length, an accurate measurement of the absorbance profile was achieved (see figure 11).
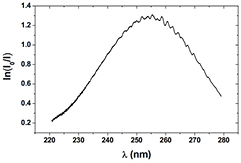
Figure 11. Evolution of the absorbance versus the wavelength in the range 220–270 nm. MCSD in a He/O2 mixture, 1% of O2 admixture from [167]. With kind permission of The European Physical Journal (EPJ).
Download figure:
Standard image High-resolution imageDensities of O3 in the range of 1012–1016 cm−3 were measured and the limit of detection was 1.0 × 1012 cm−3. The measured densities varied less than 10% over the time period of several months between measurements. Cross-sections for the ozone measurements were taken from [168]. In [169, 170], the distribution of ozone was measured in a pulsed corona discharge array. The 100 ns pulsed discharge was ignited in a 13 mm point to plane gap in dry air. The spatial resolution was 40 µm and the time resolution appeared to be better than 100 μs using a gated ICCD. As light source, a 2D expanded rectangular laser beam of a KrF Laser with low enough beam power density was used to avoid power saturation. An average over 10 discharge pulses was performed. With its high spatial, temporal and density resolution, this setup seems to be well suited for plasma jet diagnostics. In [96], the ozone density in a planar APPJ operated in helium was determined by a tomographic approach (see section 2.7). Figure 12 shows the ozone density in the effluent of a wide gap APPJ operated in helium with small oxygen admixtures. The density is derived from two transversal scans of the optical depth profile. Although artefacts of the simplified spatial resolution approach can be seen (see, e.g. z = 6 cm at x-position of 2.5 cm), the profile shows very important information such as the higher ozone production at the jets edges. Also the effluent shape can be seen and the spreading of the effluent, which is due to turbulence development in ambient air and is not present if the jet is blowing into a helium atmosphere [95].
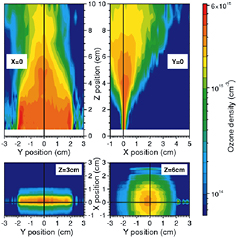
Figure 12. Ozone density in an Atmospheric Pressure Plasma Jet measured by UV absorption with an Hg-Lamp (©2007 Reprinted by permission of Wiley, Inc from [96].
Download figure:
Standard image High-resolution imageIn [60], an ozone density map of a MHz RF plasma jet (kinpen) was measured. By using an imaging spectrograph, a radial optical density profile was obtained in a single measurement. The density profile was derived by Abel-inversion. Here, the ozone density was not measured in the visible part of the plasma effluent, because the temperature profile deflected the beam. While this effect can be used for a temperature determination [101, 171], it changes the amount of light hitting the detector and thus influences the absorption measurements. However, to account for the problem of spectral overlap and variety of possible species produced, for a verification of the measurements, further studies were required. Therefore, in [100], a plasma jet was studied in different surrounding gas environments and the absorption was measured spectrally resolved with a spectrally selected light source to reduce photochemistry. The results from a comparison to the theoretical ozone absorption (see figure 13) revealed that the absorption signal was mainly originating from ozone.
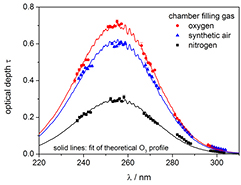
Figure 13. Ozone absorption in an artificial ambient surrounding (oxygen, synthetic air, nitrogen) compared to literature values [100] (© IOP Publishing. Reproduced with permission. All rights reserved).
Download figure:
Standard image High-resolution imageIn [172], a detailed ozone map of an argon/oxygen jet was measured (see figure 14). The interesting fact is that until a distance of about 8 mm from the jet nozzle, the absorption profile exhibits a central dip, which is difficult to evaluate by Abel inversion. The authors used a fitting procedure of an analytical ozone profile to the Abel transformation according to [173], and included temperature corrections from Raleigh scattering.
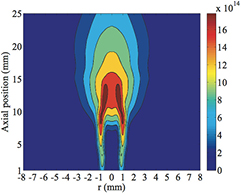
Figure 14. Ozone density map on an argon RF plasma jet [172] (© IOP Publishing. Reproduced with permission. All rights reserved).
Download figure:
Standard image High-resolution imageIn [174], ozone is determined in the effluent of a μAPPJ [27, 96] in combination with O-atom density measurements by TALIF spectroscopy. Especially the synergistic effects of O, O3, and UV photons in polymer etching of a target are revealed in the study. Several investigations have tested UV absorption measurements of ozone to other diagnostic techniques—namely infrared absorption [60, 175] or molecular beam mass spectrometry [176]. Ozone is a suitable species to diagnose in cold plasma jets, not only because it is rather simple to measure it, but also because it gives an approximation for the order of magnitude of atomic oxygen production, which is the main source of ozone as others loss mechanisms are usually negligible [177, 178]. Furthermore, ozone plays a key role in plasma medicine and was initially thought to cure lung conditions when inhaled [11]. Studies have shown that in bacterial inactivation the bacterial log reduction correlates to the ozone production [179, 180]. Chapter VIII of [181] presents a collection of studies on the bactericidal mechanisms of ozone, as it has been used for water purification since the 1850s. Because the role of ozone in plasma medicine is still not clear due to its low solubility in watery liquids [182, 183] and its difficult detection in liquids, in addition to bacterial inactivation [184], many further studies on ozone initiated biological effects are and have to be performed, such as e.g. in lipid peroxidation [185], or in plasmid DNA interaction [186, 187]. Due to a multitude of reactive oxygen and nitrogen species in jet effluents including, e.g. O(1D)N2 excimer [186], a direct link is, however, intricate to make. As ozone is usually dominant in cold atmospheric plasma jets, UV absorption spectroscopy has proven very efficient in detecting this species under the conditions present in these jets. Due to the high absorption cross-section, sensitivity is high and spatially resolved maps can be measured and taken as reference for other measurements as for example for IR absorption spectroscopy.
3.3.2. Hydroxyl radical (OH).
A molecule, which is of high relevance for medicine, is the hydroxyl radical, OH. Due to its high reactivity, it quickly forms new compounds and strongly interacts with biomolecules [181]. It is for example known to induce membrane lipid peroxidation [188, 189], which can explain plasma induced liposome modification as a model for plasma-membrane interaction [190]. It may also be responsible for lipid-A inactivation [185]. Furthermore, it plays a role in the innate immune system and the oxidative burst from macrophages [191, 192]. Not only due to its high reactivity, it is, however, much more difficult to detect by absorption spectroscopy than ozone. OH is readily used in emission spectroscopy [193] for the determination of the temperature of plasma species [24, 194] or as an indicator for humidity influences [175]. There are several works that detect OH in cold atmospheric plasma jets by LIF spectroscopy (see, e.g. [195–201]) inspired by the combustion community, or use planar LIF on OH as a marker for the flow pattern of plasma jet effluents [202, 203]. In [170], LIF was used for OH in conjunction with laser absorption for ozone measurements. LIF measurements, however, require a method for absolute calibration, when absolute densities are required. If measured relatively, still processes such as the relevance of OH generation for H2O2 generation can be deduced [183]. A further drawback of LIF studies of OH is that quenching of the excited states introduces significant uncertainties on the measurements [12], and that the laser profile needs to be known, as it can distort the spectra used to determine OH densities [21]. Studies to detect OH via absorption spectroscopy are more rare, which can be attributed to the low absorption cross-section in the UV spectral range [204]. Therefore, OH has been detected by absorption either in a cavity ring down setup [205], or in plasmas with a long absorption length such as in [47] for an RF discharge similar to the planar APPJ [6]. OH has been determined by time resolved resonant absorption spectroscopy [206] or in combustion flames in conjunction with absorption temperature measurements [207]. Especially the commercial availability of new UV LEDs may provide better access to low density species by UV absorption spectroscopy. In [28, 162], a UV LED was used as a light source for broad band absorption spectroscopy on the OH radical. In this work, the absorption measurements served as a way to calibrate LIF measurements. For sensitivity, a key parameter is the LED radiance that can be guided to the detector. Suggestions to enhance this radiance were to use a more powerful LED, improve the collimation or use a larger CCD chip. Thus, the time resolution could be improved, or the sensitivity by decreasing the spectral bandwidth. In [77], the technique was improved by implementing a collimator system as shown in section 3.1 and the overall accuracy was raised.
An interesting example on why to use absorption spectroscopy can be found in a highly accurate single pass absorption measurement that has been performed in [201] on a filamentary RF argon plasma jet. Here, also a comparison of LIF and UV absorption measurements has been made (see figure 15). Differences are attributed to the LIF uncertainties and can be partially explained by the filamentary character of the discharge in a turbulent channel [202].
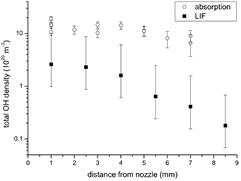
Figure 15. Comparison of LIF and UV-absorption on the OH radical determined in an RF plasma jet [201] (© IOP Publishing. Reproduced with permission. All rights reserved).
Download figure:
Standard image High-resolution imageWhile several groups are presently following cavity ring down approaches, single pass absorption has shown to yield accurate results.
A more exotic method to study OH has been applied to atmospheric plasmas in [208], where the so-called hook method is used to study the hydroxyl radical. The hook method consists in observing an interference structure of an absorbed and a reference beam in the shape of a hook occurring over a frequency variation. While the sensitivity of the method is not excellent and inferior to other techniques, it can be performed in single shot measurements.
In conclusion, UV spectroscopy is a simple and versatile tool for many species relevant in atmospheric plasma jets. A great variety of reactive species can be characterized. The drawback is the overlapping of spectral bands of different species, sometimes requiring a deconvolution or simulation procedure to interpret the signals. UV spectroscopy can be utilized to calibrate other more sensitive measurement techniques such as LIF spectroscopy. With the development of new light sources, which are more stable, collimated and point like, the technique gains in relevance, even for small scaled plasma sources.
3.4. Visible to NIR spectroscopy
The visible to near infrared (NIR) spectral region is dominantly used for studies of metastable species, as these are most prominent in this spectral region. However, in [162], the UV broadband absorption on a DB discharge was extended to the visible spectral region up to 800 nm in order to deconvolute the overlapping spectral features in the UV. In [209], a red LED was used to study NOx trace gases in cavity enhanced absorption spectroscopy. Several Metastable spoecies have their transitions in the visible to NIR spectral region. Metastable formation by atmospheric pressure plasmas has been studied e.g. for argon, helium and nitrogen metastables. N2(A) metastables have been presumed to transport energy and initiate reaction chemistry in biologically relevant liquids [210]. N2(A) densities have been studied by emission spectroscopy [211]. Time-resolved N2(A) metastable densities were measured by the CRDS absorption technique using a ns-pulsed dye laser around 770 nm wavelengths (see figure 16). Noteworthy is the limit of detection down to 1 ppm for only 0.5 mm plasma length and the 50 ns time-resolution. Plasmas were produced by nanosecond repetitively pulsed discharges in nitrogen and air at atmospheric pressure [212].
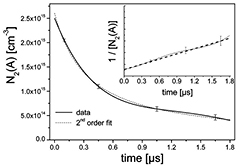
Figure 16. Time evolution of N2(A) metastable density measured by CRDS technique in nitrogen post-discharge generated by nanosecond repetitively high-voltage pulses. The inset shows a linear behavior of the reciprocal density indicating the pooling as the main loss process. (Reprinted with permission from [212]. Copyright (2010) American Chemical Society).
Download figure:
Standard image High-resolution imageIn [18], N2(A) metastables were produced by an NRP discharge in atmospheric pressure nitrogen and were also measured by the CRDS absorption technique. Lateral measurements were realized by placing and translating the discharge at the cavity center. Space-resolved absorption coefficients were obtained after Abel-inversion (see figure 17).
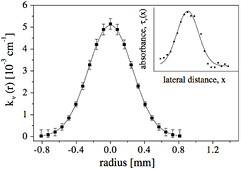
Figure 17. Radial profile of N2(A) absorption coeficient obtained after Abel inversion of CRDS lateral absorbance measurements in a nitrogen nanosecond repetitively pulsed discharge. The inset shows the lateral absorbance distribution [18] (© IOP Publishing. Reproduced with permission. All rights reserved).
Download figure:
Standard image High-resolution imageHovever, due to easier breakdown, most APP jets use argon or helium as main carrier gases. Due to their long lifetimes, argon and helium metastable states are often the most abundant energy carrying atoms in rare gas plasmas. Given their high potential energies (⩾11.5 eV for Ar,⩾19.8 eV for He), they are also an important reservoir of energy. Thus, they play a major role in plasma ionization, sustainment and excitation mechanisms. Stepwise ionization through these states is known to be a significant ionization process in low electron temperature high-pressure rare gas plasmas, as it is the case for APP jets. Rare gas metastable atoms are also an indicator of the presence of high energetic electrons, able to induce direct electron impact ionization and excitation. Furthermore, these species are very chemically active, having energies sufficient for the initiation of different chemical reactions. Therefore, the determination of the spatial-temporal absolute density distribution of argon and helium metastables is of high relevance to better understand the plasma physics and chemistry taking place in APPJs, a requirement for developing new applications and reliable process control.
Especially the density of metastable states of argon and helium has been studied in different APP jets [99, 107–114, 213–215]. As per definition, in a tuneable diode laser absorption spectroscopy (TDLAS) system, the light source is a tunable diode laser (TDL). Tuneable diode lasers typically have tuning ranges of a few GHz. Because the linewidth of the laser is negligible compared to the width of the absorption line (in particular at atmospheric pressure), not only the absolute density of the absorbing atoms (ground- or excited-state species) can be determined, but also the absorption profile can be recorded by scanning the laser frequency (achieved by changing either the temperature or the current of the TDL) across the absorption line profile without applying a deconvolution procedure, allowing to measure temperature, pressure, velocity and mass flux in the plasma volume (see section 2.4). Furthermore, the high spectral brightness of the laser and collimation over long distances allow distinguishing the laser radiation from the plasma background radiation as the latter decreases quadratically while the laser radiation remains constant with the distance. Another advantage of TDLAS is its high sensitivity and high temporal resolution. For instance, TDLAS allows the measurement of the concentration of trace gases below ppb if modulation techniques are employed. To resume, TDLAS is a reliable, relatively inexpensive, absorption spectroscopic technique providing the spectroscopic advantages of laser diagnostics in a compact, transportable and easy-to-implement system. In the following, TDLAS detection in the VIS to NIR spectral region of argon or helium metastables generated by APP jets is reviewed.
3.4.1. Argon metastables (visible).
The density of the lowest argon metastable state atoms Ar(3P2), which have an energy of 11.5 eV, has been measured by TDLAS (4s3P2 → 4p3D3 transition of Ar at around 811.5 nm) in different APPJs: co-axial sinusoidal low frequency (40 kHz) driven [111], co-axial pulsed low frequency (22 KHz) driven [109], co-axial sinusoidal RF (1 MHz) driven [108], co-axial sinusoidal RF (13.56 MHz) driven [110] and planar sinusoidal RF (13.56 MHz) driven [107]. When operated in co-axial geometries, the Ar APP jets are characterized by the propagation of a fast ionization wave through the surrounding ambient air, producing a great variety of reactive species. In [111], Bussiahn et al reported a good correlation between the propagation of the ionization wave and the generation of Ar(3P2) metastable atoms in the effluent of a co-axial sinusoidal low frequency (40 kHz) driven plasma jet. A similar behaviour of the spatio-temporal evolution of the relative densities of Ar(3P2) metastables and of the intensity of the plasma emission in the visible spectral range was observed. Additionally, almost identical propagation velocities were also determined for the ionization waves (5–20 km s−1) and the production zone of Ar(3P2) metastable atoms (8–25 km s−1). However, the observed spatio-temporal distribution of Ar(3P2) metastables is much broader than that of the plasma emission due to the longer lifetimes of the metastables compared to the radiating species. Interestingly, the highest Ar(3P2) metastables relative densities were measured in front of the nozzle. Co-axial argon jets in ambient conditions usually are filamentary and the ionization propagation pathway is defined by the impurities, which change due to the flow conditions [203]. Time-resolved optical emission measurements, using fast ICCD cameras, show that, even when appearing homogeneous to the naked eye, Ar plasma jets have usually a streamer-like character and a strong filamentary structure [108–111, 216]. The diameters of the single filaments have been estimated to few hundreds of µm. Even if TDLAS can be applied at very short absorption lengths, with the absorption being measured very accurately, a precise calculation of absolute metastable densities in measurements on single filaments is often unattainable. This is due to the fact that the spectral absorption profile is usually not constant both in time and space because of the strong fluctuating and inhomogeneous spatio-temporal character of the filaments, and the temporal resolution of current TDLAS setups (of few ns) is not high enough. Furthermore, the random filament position and thickness result in varying absorption lengths from one excitation cycle to another, as a coincidence of the fixed position of the laser beam and of the plasma filament position is a random event. In such inhomogeneous conditions, Abel inversion yields spurious results. Nevertheless, in [109] and [110], absolute densities of Ar(3P2) metastables are determined using different approaches. In [109], Schröter et al studied a filamentary co-axial pulsed 22 KHz driven plasma jet, operated at atmospheric pressure in a quartz tube. A scan of the laser wavelength over the absorption profile allowed to obtain absolute values. Inside the filaments, Ar(3P2) metastable densities of several 1014 cm−3 were determined. The estimation of the absorption length was performed by CCD imaging, which is less accurate than other methods, as the plasma emission is not necessarily related to the presence of Ar(3P2) metastables, neither are they necessarily homogenously distributed. The temporal evolution of the Ar(3P2) metastable density was found to have a reverse trend compared to the discharge current, the highest rise when the voltage is at its maximum value, and maxima correlated to minima of N2 photoemission. Additionally, maxima of the Ar(3P2) metastables density correlate with maxima of the diameter of plasma filament, which in [109] varies in time. Therefore, whenever the laser beam is equal or broader than the plasma filament, the absorption of Ar(3P2) metastables is underestimated, while whenever the laser beam diameter is lower than the diameter of the plasma channel, the measured Ar(3P2) metastable density is more reliable. In [110], space- and time-resolved measurements of Ar(3P2) metastable atoms produced in a co-axial sinusoidal 13.56 MHz driven plasma jet are presented. The jet has an inner capillary, which can be used to add precursor for thin film deposition to the plasma zone similar to the one used in [217]. In the latter jet, a stable filament position can be achieved inside the capillary tube [218]. In [110], it was observed that the plasma extends up to 2 mm from the exit nozzle and, even if it appears homogeneous to the naked eye, it has a strong filamentary structure. Single filaments with a diameter of about 125 µm and metastable densities of few 1013 cm−3 were determined. Spectral absorption profiles were accumulated time-averaged over 500 pulse cycles, and the wavelength position of the maximum of the profile was used for space and time resolved measurements. However, as the spectral absorption profile is not expected to be constant in space and time, it is difficult to evaluate the precision of the calculation of Ar(3P2) metastable absolute densities from time-averaged absorption data. Niermann et al observed a shift of the central position to longer wavelength by 3.3 GHz, which they attributed to Stark effects due to the high electron densities in the filament [110]. While the temporal evolution of each cycle is highly chaotic, averaging the signals resulted in stable signals, as it is shown in figure 18. The randomness of the signal is attributed to the following: whenever a filament crosses the laser beam, a strong absorption peak is obtained, while outside the filament, the absorption is more than one order of magnitude lower. As the first filament is, due to triggering, fixed in time, the average exhibits a stronger absorption signal at the beginning of the 170 μs recording window. A frequency analysis showed that the characteristic frequency of the filaments crossing the laser beam is around 1 MHz.
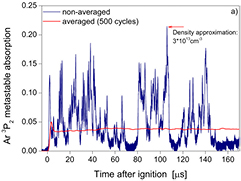
Figure 18. Non-averaged (blue) and averaged (red) time-resolved measurement of Ar(3P2) metastables in the first 160 μs after the ignition of a co-axial sinusoidal 13.56 MHz driven argon jet, taken on the jet axis, about 200 µm in front of the nozzle. From [110] (© IOP Publishing. Reproduced with permission. All rights reserved).
Download figure:
Standard image High-resolution imageIn order to determine the Ar(3P2) metastable absolute densities, the full-width at half-maximum of the measured absorption profiles taken from 2D maps of the line-integrated averaged absorption (shown in figure 19 top) was assumed as absorption length. Thus, the calculated Ar(3P2) metastable absolute densities are not the real densities found inside the filaments but rather time-averaged densities for a certain position in the plasma jet's effluent. The spatial absorption profiles have, on average, a symmetrical shape and extend up to 2 mm from the jet nozzle. As these 2D maps represent the probability of finding a plasma filament at a given position (averaging over 500 cycles), the star-shaped excitation profile in the effluent observed in figure 19 (top) can be easily explained by the bent course of the filaments that was determined by imaging [110]. Figure 19 (bottom) shows time-averaged absolute Ar(3P2) metastable densities on the central axis from the nozzle of the jet. Due to the curved trajectory of the filaments, the time-averaged absolute Ar(3P2) metastable density on the axis decreases first up to a distance of about 200 µm, it then increases up to a distance of around 400 µm, and it decreases again and continuously for longer distances from the jet's nozzle.
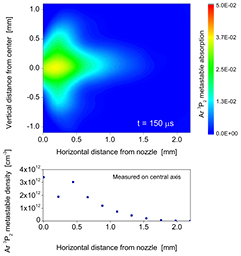
Figure 19. Top: averaged steady-state absorption map of the Ar(3P2) metastable distribution, measured 150 μs after the ignition of a co-axial sinusoidal 13.56 MHz driven argon jet behind the nozzle. Bottom: steady-state density distribution on the central axis. From [110] (© IOP Publishing. Reproduced with permission. All rights reserved).
Download figure:
Standard image High-resolution imageThe temporal expansion of the plasma filaments coupled to the measurement of the dependence on the distance to the nozzle of the temporal Ar(3P2) metastable absorption profile allowed Niermann et al to correlate the production of Ar(3P2) metastable with the passage of an ionization wave.
Important for plasma medicine investigations is the interaction of the plasma jets with targets. In [110], the metastable were studied with and without a target in front of the plasma jet. While an electrically floating target does not affect the Ar(3P2) metastable density distribution, a grounded target significantly changes the characteristics of the plasma jet. The plasma becomes more stable and is not any longer fully governed by the filamentary character observed in the free effluent. Close to the target's surface, the discharge spreads over a diameter of more than 3 mm. High Ar(3P2) metastable densities can be maintained over the whole plasma column between the nozzle and the target, and on the target's surface. Under grounded target conditions the plasma column can even be extended over a distance of about 3 mm.
Finally, in [107] the spatial distribution of the absolute density of Ar(3P2) metastable atoms in the plasma volume of a planar sinusoidal RF (13.56 MHz) driven helium plasma jet with up to 10% argon admixture was measured for various discharge conditions. In order to obtain absolute values for the Ar(3P2) metastable density, the spectral absorption profile was recorded and analysed, enabling the determination of the pressure broadening and the peak intensities. Ar(3P2) metastable concentrations spanning from 109 to few 1011 cm−3 were measured in the plasma volume, while no metastables were detected in the effluent region behind the electrodes, even at higher power conditions. The density profiles between the electrodes reflected the plasma excitation distributions in the plasma volume, highlighting the sheath structure. It was observed that the Ar(3P2) metastable densities depend strongly on the argon admixture to the helium feed gas. At 4% argon fraction, the Ar(3P2) metastable density reaches its maximum and then it decreases for higher Ar admixture. Furthermore, a significant influence of air impurities on the Ar(3P2) metastable density was determined. A study of the dependence of the metastable density on the power found a linear correlation of increasing argon metastable density with increasing applied power.
3.4.2. He metastables (NIR).
TDLAS has been used to measure the density of the lowest helium metastable state atoms He(23S1), which have an energy of 19.8 eV, by probing the 23S1 → 23P0,1,2 transition of He at around 1083 nm, in different APP jets: planar sinusoidal RF (13.56 MHz) driven [107, 114, 214, 215], bipolar pulsed low frequency (5 KHz) driven [113], co-axial positive pulsed low frequency (20 KHz) driven [112, 213], co-axial sinusoidal RF (1 MHz) driven [99]. Contrary to the operation in argon, the helium APP jets are diffuse, even in co-axial geometries, in which they are, as for the case of argon, characterized by the propagation through the surrounding ambient air of a fast ionization wave, producing a lot of reactive species. In [107, 114, 214, 215], the role of air impurities and minority admixtures of argon and O2 on the He(23S1) metastable density produced in a similar planar sinusoidal RF (13.56 MHz) driven APP jet was studied. Niermann et al found that ambient air intrusion through the front nozzle significantly quenched the He(23S1) metastable density [107, 214, 215] resulting in an increase in density with gas flow, due to the reduced impurities density. Less impurities not only reduce metastable quenching by Penning ionization, but it also reduces electron energy loss to vibrational and rotational excitation of impurities. Another source of air impurities contaminating the feed gas is the gas supply system. For proper determination of the metastable density, the best is to work with stainless steel gas tubing, which should be conveniently and equally purged before each TDLAS measurements to remove excess impurities, especially humidity [175]. In [107], the influence of up to 5% Ar admixture was also studied. A strong decrease of the He(23S1) metastable density with increasing Ar admixture was observed. Niermann et al explained this with the lower excitation threshold of 11.55 eV for Ar(3P2) metastables compared to 19.82 eV for He(23S1) metastables. In [114], it was found that the He(23S1) metastable density decreases exponentially with increasing O2 admixture, attributed to metastable quenching by Penning ionization with O2, or due to a decrease of the electron temperature resulting from inelastic electron-impact collisions with O2 and perhaps O3 (produced by the plasma). In [114], the experimental results were compared with a numerical simulation of the plasma, allowing the identification of the main formation mechanisms of He(23S1) metastable atoms, and the analysis of their pronounced spatio-temporal dynamics. However, it was concluded that on this APP jet the He(23S1) metastable atoms are not an important energy carrying species into the jet effluent and therefore will not play a direct role in remote surface treatments using this planar RF-driven APPJ. The absence of He(23S1) metastable atoms in the effluent region behind the electrodes was also experimentally observed by Niermann et al [107]. The He(23S1) metastable density increases slightly over-linearly with increasing RF power [107]. Finally, the density profiles of He(23S1) metastable atoms in the volume between the electrodes observed in [107, 214, 215] revealed the sheath structure, reflecting the plasma excitation distribution which is determined by the electron density and temperature distribution in the discharge volume. In [214], the spatial profiles were obtained for various electrode gap distances, showing the transition from a normal glow plasma to a pure sheath discharge. While [107, 114, 214, 215] found He(23S1) metastable densities up to few 1011 cm−3 in a planar sinusoidal RF (13.56 MHz) driven APP jet, Douat et al measured much higher He(23S1) metastable densities, up to some 1013 cm−3 (2 orders of magnitude higher) [112, 213] in a co-axial positive pulsed low frequency (20 KHz) driven APP jet. Thanks to the cylindrical symmetry of this plasma jet, the radial distributions were deduced using Abel transforms, and the temporal evolution of the spatial distribution of He(23S1) metastable atoms was investigated (see figure 20). It was observed that as the plasma jet propagates, the He(23S1) metastable density radial distribution evolves from a ring shape, observed near the exit of the dielectric tube, to a conical form centered on-axis. On the same jet setup, a similar evolution of the spatio-temporal distribution was also observed for the electron density [219] as well as for the plasma emission [112]. In particular, the spatio-temporal evolution of the radial distribution of the first negative system of N2 is similar to that of the He(23S1) metastable atoms, indicating that  is mainly populated through Penning ionization of N2 by He(23S1). As shown in figure 20, the spatio-temporal distribution of the He(23S1) metastable density depends on the applied voltage, with higher He(23S1) metastable densities being obtained for higher applied voltages. By measuring the characteristic decay time of the metastable atoms, Douat et al determined that a region of the plasma jet that appears pink to the naked eye and is rich in He(23S1) metastable atoms corresponds to a plasma volume where the value of the decay time is constant and approximately equal to 5 μs. Given that according to [42, 220] the theoretical lifetime of He(23S1) metastable in pure helium is expected to be 5.8 μs, the He gas in this pink cone is only faintly contaminated.
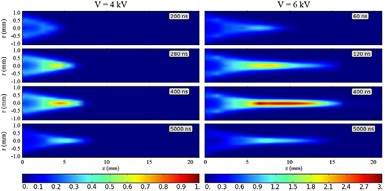
Figure 20. Snapshots illustrating the temporal evolution of the spatial distributions of the He(23S1) metastable states produced during the propagation of a co-axial positive pulsed 20 KHz driven helium plasma jet into ambient air. The density unit indicated by the color bar is 1013 cm−3. (© 2014 IEEE. Reprinted, with permission, from [213]).
Download figure:
Standard image High-resolution imageIn [99], the impact of different oxygen/nitrogen shielding gas mixtures on the He(23S1) metastable density generated by a co-axial sinusoidal RF (1 MHz) driven APPJ is discussed. Spatio-temporal as well as radial profiles, determined by means of Abel inversion technique, of He(23S1) metastable atoms are presented (see figure 21). The surrounding atmosphere of the plasma jet was varied from pure oxygen to pure nitrogen with a gas shielding device [221]. This technique allows to tune the plasma for a targeted biological effect [222]. Similarly to the above-mentioned co-axial APPJ, He(23S1) metastable densities up to few 1013 cm−3 were obtained, however at different distributions and shorter plume length. Concerning the different shielding gas compositions, the highest He(23S1) metastable density was found for the absence of shielding gas, in which the volume where He(23S1) metastable atoms are detected is also the greatest. Logically, a similar spatial density profile was obtained when shielding the plasma jet with artificial air (20% O2 + 80% N2). For pure O2 shielding, the plasma volume rich on He(23S1) metastable atoms is much smaller. For small O2 fractions on the gas shielding (5% O2 + 95% N2), the He(23S1) metastable density decreases significantly but the spatial profile remains almost similar to that of artificial air (not clearly seen in this figure). Indeed, the lower the O2 amount on the gas shielding, the lower the He(23S1) metastable density. When no O2 is present in the shielding gas (pure N2 shielding), no He(23S1) metastables can be measured at all. Most interestingly, even when N2 was replaced by Ar, a similar behavior was observed (not shown in this figure). In [223], Schmidt-Bleker et al attributed this behaviour to a focusing of the electric field by negative oxygen species. The electric field generated by the anions contributes to a focusing of the electrons towards the center of the helium channel, thereby promoting the propagation of the ionization wave during the negative phase. In this way, anions can be generated at distances of a few mm from the jet nozzle. These anions can then provide the seed electrons for the counter-propagating streamer observed during the next positive phase [223]. From the decay times of He(23S1) metastables (in the range of 2.3 μs ± 0.1 μs), and from diffusion analysis, it was concluded that feed gas impurities, especially water molecules, are more likely responsible for the determined high quenching rate. Thus, again, for the measurement of He(23S1) metastable atoms density, the use of stainless steel tubes for the gas supply system is recommended. The evaluation of the temporal evolution of the He(23S1) metastable density revealed that the metastables atoms are only produced in the positive phase of the applied voltage. The He(23S1) metastable density never drops to zero during a voltage period, as the decay time of He(23S1) is larger than the period of the voltage signal, and it is, thus, significant for the reactive species generation in the plasma jet.
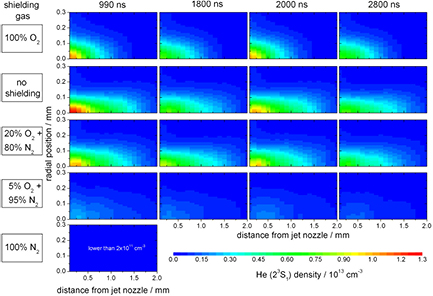
Figure 21. Spatio-temporal He(23S1) metastable density measured in a co-axial sinusoidal RF (1 MHz) driven He plasma jet. From [99] (© IOP Publishing. Reproduced with permission. All rights reserved).
Download figure:
Standard image High-resolution imageIt can be concluded that argon metastable measurements are particularly challenging, due to the filamentary nature of the discharge. Good time and space resolution can be gained depending on the type of detector used. Due to the stochastik nature of the filament position, averaging and Abel inversion are intricate and sometimes impossible. In helium, the measurement is somewhat simpler as the discharges typically are homogeneous and averaging or Abel inversion procedures can be applied. Important are impurities, as they have a strong influence on the measured densities. Good care has to be taken to have a pure environment and feed gas tubings. Analysing metastable species can yield important insights into the discharge mechanisms, which makes Visible and NIR TDLAS an important measurement technique for atmospheric plasma jets.
3.5. MIR absorption spectroscopy
Absorption spectroscopy in the infrared has the advantage that required photon energies lie in the order of 0.1 eV for the MIR, the spectral range from 2 to 30 µm. This means that even high power light sources do not disturb the plasma. Furthermore, in the MIR, ro-vibrational bands of a large variety of hetero nuclear and thus infrared active molecules are present [38]. Although the absorption cross-sections of these transitions are usually orders of magnitude smaller than for transitions in the UV spectral range, they are typically two orders of magnitude larger than in the near-infrared. The high selectivity of molecular spectra in the MIR with their relatively strong absorption cross-sections makes this spectral region ideally suited to study the composition of reactive atmospheric plasmas. IR spectroscopy has been used in atmospheric diagnostics for decades [224, 225]. Both broadband non-coherent light sources and lasers are used for spectroscopy in the MIR as described in the following.
3.5.1. FTIR absorption spectroscopy.
Spectroscopic setups with continuous light sources and dispersive spectrometers or Michelson spectrometers such as FTIR spectrometers can be used to detect infrared active molecules. In FTIR spectrometers, the spectral resolution can be up to 0.001 cm−1 for a (?) given integration time and long Michelson mirror pathway, although typical laboratory FTIRs have spectral resolutions around 0.1 cm−1. Spatial resolution is harder to achieve than for UV or visible light absorption setups. But, nevertheless, recently, an FTIR absorption spectroscopic setup, that achieves a 2 mm lateral resolution, has been applied in low pressure [226]. Collimating optics were placed inside the FTIR sampling chamber, the IR beam was guided through the 50 mm long plasma chamber and a retro reflector was placed at the other side of the plasma. Gas phase analysis with a FTIR spectrometer is known, e.g. from NOx removal in exhaust gas with DBD discharges [227], plasma driven catalysis for VOCs removal [228], or hydrocarbon assisted NO oxidation in diesel exhausts from ships [229]. While FTIR absorption spectroscopy is better known for its application in low-pressure reactive plasmas for process monitoring, it has been used more and more at atmospheric pressure to study the reactive species generation in discharges. In [230], an FTIR gas analyser was used on a DBD for mechanism studies on the deactivation of Escheria Coli. The identification of fundamental mechanisms through peroxynitride formation in a DBD treated liquid was supported by identification of HNO3 and ONOOH in the gas phase [230]. In [227], a DBD operated with dry gas was studied and the NOx reaction chemistry was observed simultaneously for several species. In [231], a DBD is studied with an in situ FTIR setup. Here, the reaction chemistry is studied in the diffusion-dominated zone between discharge and treated surface. The absorption length is 50 mm. In [232], the CF2 concentration in a depositing argon/fluorocarbon DBD was studied. In [191], the NO and O3 density in the plasma was studied both with FTIR and UV-absorption spectroscopy. For the UV absorption measurements, cross-sections from [233] were taken. The difference between UV and FTIR measurements were relatively large with a factor of 2, which was attributed to erroneous FTIR measurements rather than UV absorption spectroscopy. The work shows the correlation of power input into the gas volume and NO/O3 ratio. Longer treatment times or higher power density result in higher gas volume temperature yielding a reduction of ozone and an increase in NO derived species.
FTIR spectroscopy has also been applied to jet diagnostics. While Moravej used IR absorption to indirectly measure atomic oxygen by titration [141], Pipa et al [234] performed a first study directly on the RF atmospheric plasma jet generated species with FTIR absorption. The studied plasma source was similar to the kinpen. Production rates of molecules NO, NO2, N2O, HNO2/3 as well as CO and CO2 (from impurities or wall reactions) have been detected (see figure 22). Spectral data were taken from a compilation of HxNyOz spectroscopic experiments in a review [235], and for the case of HNO2 from the ATMOS [236] database as well as HITRAN [39] and the commercially available QASoft database [237].
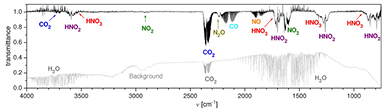
Figure 22. Broadband multipass FTIR absorption spectrum of an argon atmospheric plasma jet with air admixture (© 2009 IEEE. Reprinted, with permission, from [234]).
Download figure:
Standard image High-resolution imageThe combination of multipass absorption for high sensitivity with plasma kinetics simulation is a promising approach [231]. In atmospheric plasmas, this has been applied in [238] to gain further insight into reactive species production. Here, a kinpen was placed inside a collecting vessel from which the gas was sampled into the multipass cell (see figure 23 right). With a time dependent weighting function, resulting from flow dynamics calculations, residence times were estimated and the reaction dynamics was calculated [238]. The same setup was used to study the mechanisms of hydrogen peroxide formation by adding humidity to the feed gas of the kinpen [175, 239]. It was found that cell viability correlates under the studied conditions with H2O2 production rate. If H2O2 is held constant, other effects dominate the cell activity inhibition [10, 222]. A comparison of feed gas effects to ambient effects reveals that core plasma effects dominate the hydrogen peroxide production (see figure 23) [239, 240].
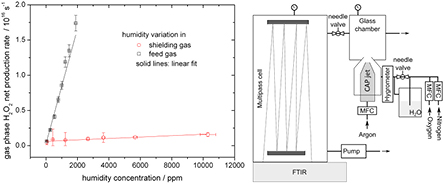
Figure 23. Development of H2O2 as a function of humidity admixture to the feed gas or ambient of an argon RF plasma jet (left) [240]. Setup of the FTIR measurements and the sampling chamber (right) [238] (© IOP Publishing. Reproduced with permission. All rights reserved).
Download figure:
Standard image High-resolution imageIn [238], a parameter variation of the surrounding gas of the plasma jet served as an input for a simple chemical kinetics model. This was possible as the core plasma conditions remained constant, while the reactive species composition was varied and the long living species composition was varied. This was detected in the multipass cell, and, from the chemical kinetics model, valuable insights into the reactive species generation could be gained so that the development of, e.g. ozone and NO2, could be fitted with only one fitting parameter (see figure 24).
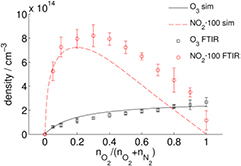
Figure 24. Density of ozone and nitrogen dioxide upon oxygen to nitrogen shielding gas variation [238] (© IOP Publishing. Reproduced with permission. All rights reserved).
Download figure:
Standard image High-resolution imageTo summarize, FTIR is a versatile technique detecting various species in parallel and having the advantage to make a specific identification of individual absorbing species possible. The disadvantage of low sensitivity can be overcome by sampling the plasma generated reactive species in a multipass cell and combining the measurements with modelling. From this, valuable insights into reactive species pathways can be gained.
3.5.2. MIR-LAS.
Over the last two decades, mid-infrared laser absorption spectroscopy (MIR-LAS) in the molecular fingerprint region from 3 to 20 µm has evolved into a powerful and versatile diagnostic technique for in situ plasma studies. Laser based spectrometers operating in the MIR enable access to strong fundamental vibrational bands of many compounds with absorption cross-sections that are typically two orders of magnitude larger than in the near-infrared. MIR-LAS provides a means of determining the absolute concentrations of the ground states of stable and transient molecular species at time resolutions below a microsecond, which is of particular importance for the investigation of reaction kinetics and dynamics. Especially for irreproducible plasmas, absorption laser systems were developed allowing for time-resolved absorption profile measurements. In [37], the methyl radical was measured in low-pressure microwave plasmas using a MIR lead salt diode laser with a resolution of 1 ms. Entire line profile scans were performed, therefore all broadening changes in time could be taken into account.
Information about gas temperature and population densities can also be derived from MIR-LAS measurements. Apart from well-known FTIR spectroscopy, also laser based diagnostics have been applied in this spectral region due to the development of new light sources [241]. Continuous wave (cw) tunable lead salt diode lasers have been the most popular devices for tunable diode laser absorption spectroscopy (TDLAS) in this region, because they offer relatively high spectral intensity, narrow bandwidth (10−3–10−4 cm−1), and continuous tunability (typically 10s of cm−1) over an absorption profile. However, output powers tend to be fairly low (sub-mW), and, more importantly, these lasers have the drawback that they require cryogenic cooling. A recent review on the application of lead salt TDLAS to plasma diagnostics can be found in [242].
As far as we know only two papers have been reported by Pipa et al on the application of TDLAS with lead salt lasers in the mid infrared to study the gas phase of a kinpen like atmospheric plasma jet, both related to the production rate of NO molecules [243, 244]. The higher sensitivity and better signal-to-noise ratio of TDLAS measurements allowed a more accurate and detailed quantitative analysis of NO production compared to previous reported FTIR absorption spectroscopy on the same jet [234]. In both, the measurements were performed with the transportable two laser beam infrared (TOBI) system [245] and the kinpen was mounted in an astigmatic Herriot multipass cell (100 m optical path in 3 l volume). It was demonstrated that TDLAS is capable to provide reliable measurements even under unfavourable conditions present in APPJs, namely its small dimension, short absorption length, unfavourable jet geometry, high gas flow conditions, etc. Furthermore, the absolute concentration measurements agreed very well with results from OES measurements in the UV region of the spectrum [243, 244].
An alternative to direct MIR sources is the production of radiation via nonlinear optical processes utilizing widely available room temperature laser sources in the near-infrared (NIR). These lasers have the same advantageous features as the lead salt diode lasers but without the necessity of cryogenic operation, which makes their use much simpler. Besides, because of their importance to telecommunications, they are based on mature technology. In difference frequency generation (DFG), the NIR lasers are mixed in a nonlinear crystal to produce a beam in the MIR with optical qualities directly related to those of the source lasers. Primarily, periodically poled lithium niobate (PPLN) has been used either in a DFG or optical parametric oscillator (OPO) arrangement to generate radiation in the MIR [246]. Recently, the practicality of a compact solid-state laser based DFG system has been demonstrated as a tool for probing low pressure hydrocarbon based plasmas [247].
Developments in material engineering led to the introduction of the quantum cascade laser (QCL) by Faist et al in 1994; a narrow band, relatively high powered, semiconductor based laser, producing radiation in the MIR [248]. Radiation is generated in aligned biased multi quantum wells in a semiconductor layer stack. Furthermore, as the energy levels within the wells are determined by quantum confinement, the energy of the lasing transition is determined entirely by the thickness of the layers and there is no need to use exotic materials with specially designed band gaps. As a result, the emission wavelength of the laser can be tailored over a wide wavelength range throughout the infrared molecular fingerprint region and beyond (3 to 300 µm). Nowadays, commercially available thermoelectrically cooled semiconductor cw QCLs operating near room temperature have become standard technology with only water assisted Peltier cooling. Furthermore, distributed feedback (DFB) QCLs provide (i) continuous mode-hop free wavelength tuning, (ii) increasingly high output powers up to hundreds of mW, and (iii) narrow linewidth radiation. These features make them an attractive and competitive radiation source for infrared laser spectroscopy in comparison with lead salt diodes and radiation generated via difference frequency mixing.
Consequently, pulsed and cw DFB-QCLs are rapidly becoming the radiation source of choice for working in the MIR for wavelengths longer than 3.4 µm, and inter-band cascade lasers (ICLs) for shorter wavelengths. The tunability of commercially available DFB-QCLs is typically limited to a few cm−1. For more information on the developments and applications of DFB-QCLs, we refer the reader to various review articles and the references therein [66, 249–253]. In contrast to DFB-QCLs, external-cavity quantum cascade lasers (EC-QCLs) have tuning ranges of up to 200 cm−1, which, when combined with their high output power of up to 350 mW and narrow linewidths, open up new possibilities in high resolution absorption spectroscopy including multicomponent detection encompassing molecules with broader absorption structures. For more details on the developments and applications of EC-QCLs, we refer the reader to various articles [254–258] and the references therein. All these developments have stimulated very significant improvements in QCLAS for plasma diagnostic purposes [66, 252].
Since kinetic processes are inherent to plasmas ignited in molecular gases, high time-resolution on subsecond timescales with high sensitivity is frequently desired for fundamental studies as well as for process monitoring in applied research and industry. Pulsed DFB-QCLs can be operated at high repetition rates (kHz) in the so-called intrapulse operation mode, allowing the study of fast kinetic processes. This is because a complete absorption spectrum may be obtained during a single current pulse of tens up to hundreds of nanoseconds. In this intrapulse mode, the QCL laser is scanned through the Doppler width of a transition on a time scale that is much faster than the relaxation processes in low-pressure gases, resulting in the occurrence of the so-called rapid passage effect. Although this effect distorts the lineshape of the transition profiles and thus leads to lower quantitative accuracy, still accurate densities and rotational temperatures of species in low-pressure plasmas can be obtained [243, 250–253]. Indeed, here is one of the few effects that do not disturb measurements at atmospheric pressure, which means that this relatively simple method is ideal to study fast kinetic processes in atmospheric plasma jets.
To enable multi-component detection with high time-resolution, a compact and transportable three channel QCL system, TRIPLE Q, has been developed. In the TRIPLE Q spectrometer, the radiation of three independently controlled QCLs is combined. This setup was used for time-resolved studies of multiple molecular components in a low pressure discharge tube [259]. All three QCLs are operated in the intrapulse mode with typical pulse lengths of the order of 100 to 200 ns. Using a multiplexed detection arrangement, N2O, NO and NO2 were measured with a (total) time resolution of better than 1 μs. How a pulsed QCL can provide a simple method for probing the kinetics of transient species has been reported for CF3 [57].
While QCL absorption spectroscopy (QCLAS) has been in use for the monitoring and diagnosis of molecular plasmas in research and industrial environments [56, 66, 252, 260–265], species generated by atmospheric pressure plasmas have only recently been studied with this method [60, 240, 266]. Reuter at al [60] used QCLAS to investigate the ozone production rate in a MHz argon atmospheric plasma jet. For these measurements, a commercial absorption spectrometer (Q-MACS, neoplas control GmbH) has been used, with a specification of the spectral resolution of 0.004 cm−1, which offers a higher resolution than a more commonly used FTIR spectrometer. A total absorption length of 16.8 m was achieved by placing the plasma jet in a multipass White cell at atmospheric pressure and in ambient air, to allow the plasma jet to be operated under the same conditions as in open air. It yielded high sensitivity results of the spatially averaged ozone concentration of the jet with high accuracy. The results were in excellent agreement with UV-absorption spectroscopy in the Hartley band to determine the space-resolved distribution of the ozone concentration in the jet effluent (see figure 25) [60].
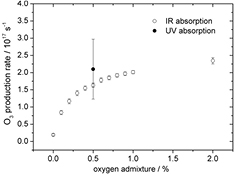
Figure 25. Comparison of UV and MIR absorption measurements on ozone [60] (© IOP Publishing. Reproduced with permission. All rights reserved).
Download figure:
Standard image High-resolution imageThe same setup was later on used to study the influence of ambient and feed gas humidity on ozone generation by the plasma [240]. Iseni et al investigated the NO2 production dynamics for a RF argon plasma jet (kinpen) operating at ambient conditions using QCLAS [266]. Again the plasma jet was placed inside a multipass White cell with open gas flow. In a recent paper, the absolute net production rates of O3 and NO2 species have been measured with QCLAS for an atmospheric plasma jet operating in Ar with different admixture fractions of nitrogen and oxygen with a dry air gas curtain surrounding the device [267]. The experimental data were compared to the production rates of these reactive molecules calculated with a 0D semi-empirical reaction kinetics model. A very good qualitative and even quantitative agreement between the calculated and measured data has been demonstrated (see figure 26).
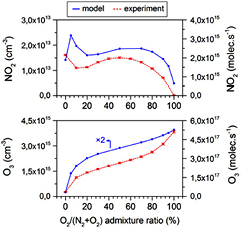
Figure 26. NO2 and O3 densities in a multipass measurement chamber obtained by QCLAS and calculated data from a RF-jet model in different O2/(O2 + N2) ratios. From [267].
Download figure:
Standard image High-resolution image
Furthermore, it was shown that such a combination of experimental and theoretical investigations can be used to acquire important insight in the reaction kinetics in all regions of the plasma jet, even in areas that are not accessible by optical diagnostics [267]. All these examples show that QCLAS opens up the way for advanced monitoring and controlling of the production rates of relevant reactive molecules in plasma jets.
4. Comparison of different experiments
In the following table, above described examples on jet diagnostics are listed according to the studied species. The light source used, the plasma source studied and the experimental parameters, such as the absorption length, the time resolution, the density measured and the error or the detection limit are indicated. With this table, a quick overview is given for the possibilities of absorption spectroscopy on cold atmospheric plasma jets.
| Species | Light source | Plasma source | Absorption length | Time resolution | Density measured | Lower detection limit | Error | Technique | Ref. |
|---|---|---|---|---|---|---|---|---|---|
| OH | DBD | DBD | 20 cm | ⩾ 200 ns | 10% | Resonant Absorption | [206] | ||
| OH | UV LED | Jet | 0.4 mm | None | 1015 cm−3 | ⩽ 8 * 1020 m−3 | 50 100% | [21, 201] | |
| OH | UV LED | DBD | (2.6 ± 0.65) × 1013 cm−3 | 50% | [28] | ||||
| OH | UV LED | RF Glow Discharge | 10 cm | None | 0.6–4 1014 cm−3 | [47] | |||
| OH | UV LED | Plasma jet | 0.4 mm | 200–400 ns | (1.5 ± 0.3) × 1016 cm−3 | BB-UV absorption | [21] | ||
| O3 | D2-Lamp | RF Jet | 1–2 mm FWHM | 0.1–1.5 × 1016 cm−3 | UV absorption (imaging Spectrograph) & wavelength selected D2 Lamp | [100] | |||
| O3 | FTIR Hg-Lamp | RF-Jet | 19.2 m | Production rate 0.5–4 × 10¹⁷ s−1 | FTIR & UV absorption | [175] | |||
| O3 | KrF Excimer Laser | Needle Plate Corona | 1.2 mm | 20 μs | 1–10 × 1015 cm−3 | [169, 170] | |||
| O3 | D2 Lamp | RF Jet | 4–9 mm (UV) | 6.5 × 1015 cm−3 | UV absorption | [60] | |||
| QCLAS | |||||||||
| O3 | Hg-Lamp | μAPPJ | 1–4 mm FWHM | relative | UV-absorption | [174] | |||
| O3 | Hg-Lamp | APPJ | 10 cm | 1–6 × 1015 cm−3 | UV-absorption | [164, 165] | |||
| O3 | FTIR | Surface DBD | 50 mm | 30 s–3 min | 1000–6000 ppm | Factor of 2 difference | FTIR & UV absorption | [191] | |
| Hg-Lamp | |||||||||
| O3 | D2-Lamp | MCSD | 8–50 cm | None | 1012–1016 cm−3 | 1.0 × 1012 cm−3 | 0.1% | UV absorption | [128, 130, 167] |
| O3 | QCL | RF Jet | 16.8 m (MIIR) | 10 min | (8–93) × 1013 cm−3 | 300 ppb | 4% | QCLAS | [60] |
| O3 | HG Lamp | RF APPJ | 3 mm–40 mm | 0.03–6 × 1015 cm−3 | UV Absorption | [96] | |||
| O3 | Ar/HG Lamp | DBD | 26 mm | 10–4000 ppm | UV Absorption | [179] | |||
| O(3P) | MHCD | Ar-Jet | 6.5 mm | 1015 cm−3 | VUV resonant absorption | [147] | |||
| O(3P) | MHCD | Ar-Jet | 6.5 mm | 1–10 × 1014 cm−3 | VUV resonant absorption | [149] | |||
| N2(A) | YAG dye | ns pulsed plasma | 0.6 mm | 50 ns | 1.0 × 10¹⁴–2.5 × 1015 cm−3 | 1 ppm | 40% | CRDS | [211] |
| H2O2 | FTIR | RF Jet | 19.2 m | Production rate 0.1–2 × 10¹⁶ s−1 | FTIR Multipass | [240] | |||
| H2O2 | FTIR | RF -Jet | 19.2 m | 1–5 ppm | FTIR Multipass | [183] | |||
| H2O2 | FTIR | RF -Jet | 19.2 m | Production rate 0.1–2 × 10¹⁶ s−1 | FTIR Multipass | ||||
| O3, N2O4, NO2, N2O5, NO3 | D2 Halogen Lamp | DBD | 2.4 cm | 15–90 s | 10–5000 ppm | UV-VIS w. deconvolution & Modell | [162] | ||
| NH3 | FTIR | DBD | 5 cm × 2 mm | 200 ppm | FTIR Absorption | [226] | |||
| NO2, O3 | FTIR | RF Jet | 19.2 m | 2 × 1012 cm−3 | FTIR Multipass | [238] | |||
| 1–10 × 1014 cm−3 | |||||||||
| NO2 | Lead-salt diode laser | RF Jet | 100 m | 5–150 ppm | 10% | TDLAS | [244] | ||
| NO2 | QCL | RF Jet | 19.2 m | 10 min | 350–1000 ppb | 20 ppb | 80 ppb | QCLAS | [266] |
| NO | Lead-salt diode laser | RF Jet | 100 m | 0.1–200 ppm | 10% | TDLAS | [244] | ||
| O2 | Ar Excimer | RF-Jet | 4–10 mm | 1–5 min | Up to 1017 cm−3 | 10% | Self absorption | [135] | |
| NO, CO | QCL | Nanosecond repetitively pulsed discharge | 2 m | 1–10 s | 1–240 ppm, 8–1000 ppm | 1 ppm | 10% | QCLAS | [265] |
| O2(a1▵g) | Microwave hydrogen plasma | MCSD | 50 cm | none | 1013–1016 cm−3 | VUV absorption | [128] | ||
| Ar(3P2) | TDL (811.5 nm) | Co-axial RF jet | 125 µm | 40 ns | 1011–1013 cm−3 | TDLAS | [110] | ||
| Ar(3P2) | TDL (811.5 nm) | Co-axial pulsed kHz jet | 200–350 µm | < 1 μs | 1013–1014 cm−3 | TDLAS | [109] | ||
| Ar(3P2) | TDL (811.5 nm) | Planar RF jet | 1 mm | 109–1011 cm−3 | TDLAS | [107] | |||
| Ar(3P2) | TDL (811.5 nm) | Coaxial DBD Jet | 100 ns | Relative | TDLAS | [111] | |||
| Ar(3P2) | TDL (811.5 nm) | Co-axial RF jet | 3 ns | 1010–1011 cm−3 | TDLAS | [108] | |||
| He(23S1) | TDL (1083 nm) | Planar RF jet | 1 mm | 109–1011 cm−3 | TDLAS | [107, 214, 215] | |||
| He(23S1) | TDL (1083 nm) | Planar RF jet | 30 mm | 109–1010 cm−3 | 1.0 × 109 cm−3 | TDLAS | [114] | ||
| He(23S1) | TDL (1083 nm) | Bipolar pulsed kHz jet | 109–1011 cm−3 | TDLAS | [113] | ||||
| He(23S1) | TDL (1083 nm) | Co-axial pulsed kHz jet | 3 ns | 1011–1013 cm−3 | TDLAS | [112, 213] | |||
| He(23S1) | TDL (1083 nm) | Co-axial RF jet | 3 ns | 1011–1013 cm−3 | 2.0 × 1011 cm−3 | TDLAS | [99] |
5. Summary and conclusion
Cold atmospheric plasma jets are at the focus of the attention due to exciting applications such as plasma medicine. For a fundamental study of plasma induced processes—e.g. in the interaction with biological systems—a detailed analysis of particle fluxes is mandatory. Several diagnostic techniques can yield this information at considerable technical and data analysis effort. One diagnostic technique that has to rely less on technical and analytical power is absorption spectroscopy. Due to its simplicity and reliability AS poses a diagnostic method that is suited excellently for absolute diagnostics of atmospheric pressure plasmas including atmospheric plasma jets. In this review, the fundamental aspects of atomic and molecular absorption, the application of Beer–Lambert Law, and how to derive population densities have been described. Special focus was set on lineshape and broadening mechanisms as these can yield valuable information on the studied species.
This review on absorption spectroscopy of atmospheric plasma jets in the special issue cluster 'Best practices for atmospheric pressure plasma diagnostics' presents a best practice approach and introduces databases and tools as well as techniques for spatial and time resolution and for sensitivity enhancement.
The present status of atmospheric plasma jet absorption spectroscopy is described in an extensive example section. Additionally to absorption spectroscopy on jet-like atmospheric pressure plasmas, other special techniques are introduced that have been used on non-jet-like or low pressure plasmas but are also excellently suitable for plasma jet diagnostics. Absorption spectroscopy was presented from VUV to MIR spectral range. The review closed with a tabulated list of the presented measurement examples sorted by the species studied.
For a deep understanding of reactive species generation and transport mechanisms that is required for present and future plasma applications, not only knowledge about species fluxes, requiring the determination of particle densities and velocities, but also radiative fluxes, local fluid temperatures, internal energies and energy branching ratios need to be determined. This enormous task can only be handled, if a combination of different complementary techniques providing special and temporal information is applied together with absorption spectroscopy determining absolute species densities. The aim is to be able to perform simultaneous highly space and time resolved measurements necessary for highly dynamic atmospheric plasma jets in turbulent gas flow situations.
Present studies have shown that a sensitivity enhancement is possible by implementation of heterodyne detection, cavity based methods and multi pass approaches. The increase in detector sensitivity combined with more stable and better to focus light sources and fast acquisition technology will allow to study lower species concentrations in smaller atmospheric plasma jets.
In summary, absorption spectroscopy has found its way into cold atmospheric plasma jet diagnostics and will help to understand complex interaction mechanisms for a broad range of novel applications.
Acknowledgment
The authors thank COST MP1101 for establishing this special issue cluster. Acknowledgment also goes to K-D Weltmann for support and discussion.