Abstract
The desire to improve and decentralize diagnostic platforms to facilitate highly precise and personalized medicine has motivated the development of a large number of electrochemical sensing technologies. Such a development has been facilitated by electrochemistry's unparalleled ability to achieve highly specific molecular measurements in complex biological fluids, without the need for expensive instrumentation. However, for decades, progress in the field had been constrained to systems that depended on the chemical reactivity of the analyte, obstructing the generalizability of such platforms beyond redox- or enzymatically active clinical targets. Thus, the pursuit of alternative, more general strategies, coupled to the timely technological advances in DNA sequencing, led to the development of DNA-based electrochemical sensors. The analytical value of these arises from the structural customizability of DNA and its ability to bind analytes ranging from ions and small molecules to whole proteins and cells. This versatility extends to interrogation methods, as DNA-based sensors work through a variety of detection schemes that can be probed via many electroanalytical techniques. As a reference for those experienced in the field, and to guide the unexperienced scientist, here we review the specific advantages of the electroanalytical methods most commonly used for the interrogation of DNA-based sensors.
Export citation and abstract BibTeX RIS

This is an open access article distributed under the terms of the Creative Commons Attribution 4.0 License (CC BY, http://creativecommons.org/licenses/by/4.0/), which permits unrestricted reuse of the work in any medium, provided the original work is properly cited.
Electrochemical biosensors are powerful analytical tools that combine the specificity of biomolecular recognition with the low detection limits achievable via electroanalytical methods.1 These devices, which convert a biorecognition event into an electric signal,2 can support both discrete and continuous measurements in even the most complex and clinically relevant biological environments such as, for example, whole human blood.3–5 Moreover, electrochemical biosensors can be readily microfabricated to be portable,6 low-cost,7 convenient,8 and easy to integrate with the existing infrastructure of cloud-based mobile electronic devices.9 This fabrication versatility is evidenced by the many electrochemical biosensors successfully implemented in food control,10 environmental safety,11 energy harvesting,12 and human health monitoring.13 Thus, electrochemical biosensors truly offer the opportunity to achieve versatile molecular measurements at the point-of-need.14
The large diversity of biophysical interfaces and detection approaches employed in electrochemical biosensors allows for their classification in many ways. One functional approach, based on the nature of the biorecognition event, divides them into two distinct groups:15 biocatalytic sensors (Fig. 1A), which electrochemically monitor the reactivity of the analyte with a biorecognition element (e.g., enzymes16,17 or bacteria18,19); and non-reactive, affinity-based sensors, which rely on the specific binding of the analyte with a biorecognition receptor (e.g., antibodies (Fig. 1B)20,21 or nucleic acids (Figs. 1C, 1D)22,23). While the development of enzyme-based sensors precedes all others and successfully created a commercial market for electrochemical biosensors,14 affinity-based sensors emerged as a complementary technology offering the possibility to sense targets for which enzymatic or direct electrochemical detection were not possible.

Figure 1. Electrochemical biosensors rely on biomolecular receptors to achieve highly specific detection of targets in complex media. They can be classified as biocatalytic sensors (A), where solvated redox reporters shuttle electrons from the active site of an enzyme to the electrode surface; or as affinity-based sensors (B-D). Affinity-based sensors can rely on the use of antibodies (B) or DNA molecules (C,D) as the biorecognition element. For the latter, when the reporter is covalently attached to the biomolecular receptor, the target is detected via binding-induced changes in the electron transfer rate between the reporter and the electrode surface. The signal of such sensors, however, is limited by the finite number of molecular receptors that can occupy the electrode surface. To overcome this limitation and achieve lower detection limits, some affinity-based sensors are modified with an amplifying element (B,C); e.g., an enzyme or an inorganic catalyst such as Ru(NH3)63−, which is electrochemically regenerated by a solvated reporter to amplify currents. (E) The number of publications related to DNA sensors in general has increased to the same numbers per year as works focused on biocatalytic sensors. Here, for example, we show data extracted from SCOPUS using the search terms "DNA/RNA/Nucleic acid sensor", "Enzym* sensor", and "Immunosensor/antibody sensor". (F) The same trend is not quite seen for electrochemical DNA-based sensors. We argue that this discrepancy arises due to a combination of factors including the complexity and great diversity of detection schemes and interrogation methods, and a lack of understanding of the measurement advantages that each interrogation method offers. The data shown here were extracted from SCOPUS using the terms "DNA/RNA/Nucleic acid electrochemical sensor", "Enzym* electrochemical sensor", and "Immunosensor/antibody electrochemical sensor".
Nucleic acids offer unique features that make them ideal biorecognition elements for affinity-based sensors. Specifically, unlike antibodies, nucleic acids are easy to produce via solid phase synthesis24 and are less sensitive to temperature fluctuations.25,26 They can bind to a large variety of molecular targets, ranging from ions27,28 and small molecules29,30 to whole proteins31,32 and cells,33,34 and offer the possibility to do so in a reversible manner. Moreover, they can be easily engineered to adopt specific folded conformations,35,36 which can be exploited to maximize sensor signaling. These features have naturally directed the focus of biosensor research efforts to DNA-based platforms, to almost the same level of scientific production as enzymatic sensors (Fig. 1E). We note that, while the number of reports on DNA sensors in general has increased at a pace similar to that of enzyme-based sensors (Fig. 1E), works on electrochemical DNA-based sensors have not achieved the same publication rate (Fig. 1F). This discrepancy presumably arises because of the diversity and complexity of detection schemes employed in such sensors, the many electrochemical methods used to interrogate them, and a lack of understanding of the measurement advantages that each interrogation technique offers. Thus, there is a need to review specific advantages that each family of electrochemical methods offers to the interrogation of DNA-based sensors.
Architectural considerations regarding sensor design and fabrication have been discussed at great length for the various existing DNA-based approaches by prior publications,22,37–41 and are not the focus of this review. Moreover, comprehensive analytical descriptions of equations pertaining to electrochemical methods, including method theory, and sensor-relevant parameters have also been published.42 Instead, we identified a need to critically discuss the value that different electrochemical methods bring to the interrogation of DNA-based sensors. Specifically, we discuss here methods that measure the current output of the sensor upon application of an electrical voltage; namely amperometry, linear and pulsed voltammetry, alternating current (AC) methods and electrochemical impedance in the context of convenience of signaling output, time resolution, and relevant system parameters measured. This review is not exhaustive and primarily focuses on recent developments in interrogation approaches. Our goal is to provide a practical reference to aid in the selection of methods and technique parameters that give optimal sensor readouts.
The Anatomy of DNA-Based Sensors
The anatomy of DNA-based biosensors varies depending on the mechanism of detection but generally contains three common elements: 1) an electrode-blocking self-assembled monolayer (SAM) used to prevent the occurrence of undesired electrochemical reactions and to confer biocompatibility to the bioelectronic interface; 2) a SAM functionalized with biomolecular receptors; and 3) a redox reporter sensitive to analyte-binding events (Fig. 2). The redox reporter can be added to the bulk solution after target binding22,38,43 (Fig. 1C) or covalently-attached to the receptors37,44 (Figs. 1D, 2). While the former approach is only useful for ex-situ, single-point detection, the latter supports reagentless, reversible, and continuous electrochemical sensing. However, the addition of redox reporters or mediators to the bulk solution enables electrocatalytic amplification of the signal,43 which can be exploited to decrease detection limits and improve measurement signal-to-noise ratios. Thus, the architecture of these DNA-based sensors is tightly connected to their detection mechanism, the analyte to be measured, the matrix where the analyte is present, and the time and spatial resolutions required by the sensing application.
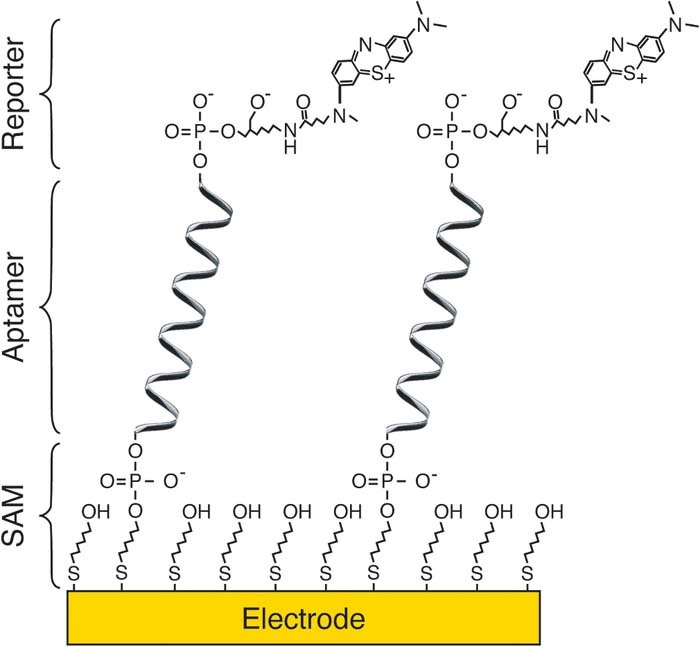
Figure 2. The general anatomy of affinity-based sensors. Although sensor architecture varies depending on detection scheme, the majority of affinity-based electrochemical sensors share three common elements: a mixed self-assembled monolayer (SAM) containing electrode-passivating chemistry (here illustrated with 6-mercaptohexanol molecules) and a tether for the biomolecular receptor, and a redox reporter, either attached to the receptor (here illustrated with a derivative of methylene blue) or solvated. The example architecture shown here specifically corresponds to an electrochemical, aptamer-based sensor.
DNA-based electrochemical sensors produce a similar signal output for a variety of detection schemes. For example, nucleic acids (e.g., miRNA or circulating-tumor DNA) are usually detected by measuring changes in electron transfer rate occurring upon hybridization with redox reporter-modified receptor strands23,38 (Fig. 1D). Similarly, small molecule targets are detected by measuring changes in electron transfer rate due to binding-induced structure switching of receptor strands.37 Both detection schemes have gained increased scientific attention in the last two decades, in part because of the ease with which nucleic acid receptors can be selected and synthesized.45–48 Also, unlike biocatalytic sensors, DNA-based detection does not depend on the specific chemical reactivity of the analyte and, thus, offers a unique approach to achieving the general sensing of a great variety of important clinically relevant molecules that cannot be otherwise detected biocatalytically.
Shape of the Calibration Curve and Limits of Detection
Because the main objective of electrochemical DNA-based sensors is to detect and quantify specific targets in relevant samples, any newly developed sensor must be calibrated, preferably at the point of manufacture,49 by constructing dose-response curves. The shape of those curves should be independent of the interrogation method used but, in contrast, is highly dependent on sensor architecture. Thus, we thought it important to briefly discuss the physics of target-receptor binding involved in DNA-based sensing.
The interface of DNA-based sensors can be approximately described as consisting of two states: one with free and one with target-bound receptors.50–52 By making the assumption that only one binding site is available at each receptor, the electrochemical response of these sensors must necessarily behave following the physics of single-site binding.53,54 That is, the relative fraction of target-bound receptors is modeled by the Langmuir adsorption isotherm:55
![Equation ([1])](https://content.cld.iop.org/journals/1945-7111/167/3/037529/revision1/d0001.gif)
where θ represents the target-bound fraction, T is the concentration of the target, and KD the dissociation constant of the receptor. This adsorption model (Fig. 3A) assumes that (1) all probes on the surface have the same binding affinity for the target; (2) the DNA probes do not interact with each other; and (3) the extent of target binding is limited to a single monolayer. Many DNA-based sensors produce signals that can be modeled using Eq. 1. However, in cases of extremely high target affinity, DNA-based sensors can produce linear responses (Fig. 3B) that become limited by the number of receptors present on the surface of the sensor.56 Furthermore, in cases where the receptor offers multiple target-binding sites, and such binding sites interact with one another, the system is better represented by a modification of Eq. 1 called the Hill-Langmuir isotherm57,58 (Fig. 3C):
![Equation ([2])](https://content.cld.iop.org/journals/1945-7111/167/3/037529/revision1/d0002.gif)
where n is the Hill coefficient, which establishes the extent of interactions between such binding sites.

Figure 3. The adsorption isotherms relevant to DNA-based electrochemical sensing. The binding of target to biomolecular receptors may obey the physics of single-site binding, modeled by the Langmuir isotherm (A). If target affinity for the receptor is high (few nM or below), binding can be modeled by a linear isotherm (B). Finally, for the case of receptors with multiple binding sites, target binding is better modeled by the Hill-Langmuir isotherm (C).
The above-described physics set the theoretical bar that must be addressed when reporting new DNA-based sensors. Specifically, it is crucial to demonstrate the receptor-target binding stoichiometry and affinity (i.e., their KD) based on the sensor architecture employed. Because the Langmuir isotherm has a useful dynamic range (here defined as the range of target concentrations that change receptor occupancy from 10% to 90%) of only 81-fold centered at the KD,54 DNA-based sensors producing linear calibration curves that exceed such dynamic range indicate more complex and, presumably, non-specific interactions. In such cases, proper description of the sensing mechanism (and how it affects the signaling of the interrogation method employed) is necessary to justify the shape of the calibration curve.
The ultimate goal of DNA-based sensors is to measure environmentally relevant levels of target in the exact medium where the target is found. For disease- or health-diagnostic platforms, this means achieving target measurements in the clinically-relevant range for viruses, cells, and biomolecules; i.e., aM – nM,59 and for small-molecule drugs; i.e., nM – μM.60 To achieve these low levels of detection, the scientific community is investing significant efforts on the development of highly sensitive sensor interfaces and signal-amplification strategies. These include, for example, modifying probe density,61 the nature of the blocking monolayer,62 the redox reporter63 and the microscopic architecture of the electrode,64,65 the electrode surface area to increase the moles of DNA receptors,66–69 coupling a catalytic process to electron transfer events to amplify binding-induced signals43,70 or achieving binding-induced receptor polymerization to also amplify signaling.71 Computational methods have also been reported that achieve lower detection limits via noise processing strategies.72 Although the ultimate limit of detection is inherently set by the receptor KD and signal amplification mechanism, it can also be improved via careful selection of the electrochemical interrogation method and its parameters.72,73
The Time Constants Involved in DNA-Based Sensing
The application of a voltage bias to the bioelectronic interface of DNA-based sensors generates electrokinetic, faradaic, mass and charge transport phenomena that affect the output of electrochemical interrogation methods (Table I). Whether the voltage perturbation is a discrete (e.g., chronoamperometry) or a continuous function of time (e.g., voltammetry), the electrolyte responds to the perturbation by dynamically aligning to the electric field.74 This effect generates double-layer charging/discharging currents in electrochemical measurements.75 Moreover, the voltage perturbation may cause field-induced movement actuation of the negatively-charged DNA backbone – that is, DNA will move toward and away from the electrode surface depending on the voltage applied.76 This effect will likely perturb the frequency of electron transfer which, in turn, affects the signaling currents measured. Beyond field-induced modulation of the electrolyte and DNA strands, mass transport of the reporter to the electrode also affects electron transfer. Furthermore, DNA secondary structures and SAM length affect the currents measured, as do the standard electron transfer rate (k0) of the redox reporter and the rates of receptor-target ligand association/dissociation. All of these factors make the signaling of DNA-based interfaces strongly interrogation-frequency dependent.
Table I. Time constants relevant to the interrogation of DNA-based electrochemical sensors.
| Physicochemical Phenomena | Time scale | Reference |
|---|---|---|
| Double-layer charge/discharge | 10s to 100s of μs | 53 |
| Field-induced actuation of DNA motion | 1 to 10s of ms | 76 |
| Mass transport of redox reporter | 1 to 100s of ms | 77 |
| Standard electron transfer rate of reportera | 1 to 100s of ms | 78 |
| Rates of association/dissociation | 10s of ms | 79 |
aThe vast majority of DNA-based sensors use the redox couple methylene blue/leucomethylene blue, which has a k0 significantly slower than that for ferrocenes or other commonly used redox reporters.80
The interrogation-frequency dependence of DNA-based sensors limits their ability to address important biological questions. For example, there is significant interest in achieving chemically-specific measurements of neurotransmitters in live brains to expand our understanding of health and disease-induced neuromodulation.81 Ideally, such measurements should be performed with faster interrogation frequencies than the rates of neuronal firing in the brain, which naturally occur at time scales of 10s of ms.82,83 However, this is impossible to achieve with, for example, state-of-the-art electrochemical, aptamer-based (E-AB) sensors,84 because they rely on methylene blue as their redox reporter,85–88 which undergoes electron transfer at rates of 100s of ms,89 slower than fast neuronal firing. A better approach to this end could be the use of label-free sensors like aptamer-based field effect transistors,90 which can theoretically achieve faster response times than E-AB sensors as they are not limited by the intrinsic electron transfer rate of a reporter. However, unlike E-AB sensors, deploying field effect transistors in vivo has proven an important challenge because of their inherent sensitivity to changes in electrolyte composition and status over time. In any case, the approximate time constants provided in Table I should serve as a guide and reminder that choosing the right interrogation technique and parameters is crucial to achieving the time resolution needed for any particular application of DNA-based sensors.
The best electrochemical interrogation method for a given application is thus determined by the time-resolution, specificity, convenience of signaling output, and sensitivity needed. Chronoamperometry, for example, offers sub-second time resolution91 but requires considerable training and experience for the correct interpretation of chronoamperometric currents. Voltammetry, in contrast, is much easier to interpret, but its time resolution can be worse than amperometry, as it requires the sweeping of voltage ranges (except in the case of fast-scan voltammetry,91 which has other technical challenges related to signal calibration). Below, we provide a discussion on the specific value that each of the most common electrochemical techniques offers to the interrogation of DNA-based sensors.
Interrogating Sensors with Sub-Second Time Resolution via Amperometry
Amperometry employs the simplest voltage program used to interrogate electrochemical biosensors. Here we consolidate all amperometric methods into techniques that measure current versus time following the application of discreet voltage steps (Fig. 4A). We note, however, that there are important technical differences in the duration and number of voltage pulses (and in analytical value) between, for example, constant-voltage amperometry at ultramicroelectrodes,92 stepped-voltage chronoamperometry52,93 and intermittent-pulse amperometry.94,95

Figure 4. Chronoamperometric interrogation of DNA-based sensors. (A) A voltage step is applied to the electrode, driving the electrochemical conversion of the redox reporter. (B) The current output varies depending on the architecture of the sensing layer. A progressive current decay is observed in systems that use reporters in solution, which is modeled by the Cottrell equation (dotted line). A fast decay to zero is observed when the reporter is anchored to the electrode surface due to its complete depletion (solid line). Last, a stationary current is observed in systems where the reporter in solution reacts with a catalyst attached to the target DNA strand (dashed line). (C) For electrode blocking-based detection, target binding hinders electron transfer leading to a decrease in the magnitude of the current decay. (D) The target molecule can be labeled with a catalyst that reacts with reporters in solution, generating a stationary current proportional to the amount of target. (E) In systems where the DNA probe has been modified at one of its ends with the reporter, target binding increases the reporter's electron transfer rate, which translates into shorter decay times in the chronoamperograms.
Because of the non-transient nature of their voltage program, amperometric measurements offer simple signaling outputs (current decays, Fig. 4B) that can be used to determine kinetic parameters of target-binding events. Moreover, the simplicity of the voltage program allows the interrogation of bioelectronic interfaces at millisecond52,94 and even sub-millisecond92 frequencies, making them ideal for monitoring fast, transient and dynamic processes.96
The signaling output of amperometrically-interrogated DNA-based sensors varies depending on whether the redox reporter is present in solution or tethered to the electrode surface (Fig. 4B). Moreover, it also varies depending on whether the detection mechanism is based on catalysis or not. For DNA-based sensors that rely on, for example, binding-induced electrode blockage,97 the current vs time response observed upon application of a voltage step will decay under diffusion control and is accurately modeled by the Cottrell equation98 (Fig. 4C). For sensor platforms that depend on homogeneous catalysis,31,99 the current may decay or increase depending on the catalytic rate of the homogeneous reaction (Fig. 4D). Finally, for DNA-based sensors with surface-bound reporters, the current will exponentially decay to zero within hundreds of milliseconds or faster due to complete oxidation or reduction of all the reporters (Fig. 4E). Thus, amperometric methods not only offer fast sensor interrogation frequencies but their signals also directly report on the kinetics of electron transfer.
The kinetic sensitivity of amperometric interrogation can be exploited to determine the electron transfer rate of a given sensing interface. For example, Dauphin-Ducharme and colleagues89 have used chronoamperometry to study the dependence of the electron transfer rate from methylene blue reporters bound to the terminal (3') end of single-stranded DNA chains (Figs. 5A–5C). Their results demonstrate that DNA chain dynamics affect the apparent electron transfer rate at chain-lengths longer than 10 nucleotides (Fig. 5D). This result is expected because longer DNA strands are more affected by the diffusional transport described in Table I. Moreover, the same group has discussed how converting chronoamperograms to chronocoulograms (by simply multiplying current by time) can be exploited to determine the relative populations of DNA receptors that undergo electron transfer at different rates (for example, single stranded vs hybridized DNA)100 (Fig. 5E). These reports highlight the analytical value of chronoamperometry for the interrogation of DNA-based sensors.

Figure 5. Sensor architecture has an impact on electron transfer between a tethered redox reporter and the electrode. (A) Here, for example, we show a redox reporter (methylene blue), anchored to the 3' end of an immobilized DNA strand with length equal to a N number of nucleotides. To transfer electrons, the reporter must first diffuse to the electrode surface. (B) The chronoamperometric interrogation of this interface first charges the double layer, then drives the reduction of methylene blue. The latter is seen as a sigmoidal decay in a log-log plot. (C-D) The rate of electron transfer is limited by the length of the DNA strand, with a clear transition to diffusion-limited rates when N > 10 nucleotides. (E) The apparent electron transfer rate, expressed in Hz, varies between single and double-stranded DNA. Single stranded DNA is more flexible and reaches the electrode surface more frequently, thus presenting a faster electron transfer rate (∼200 Hz) relative to double stranded DNA (3 Hz). This effect is easily observed in the chronocoulogram presented here. Figures adapted with permission from Refs. 89,100.
The kinetic sensitivity of chronoamperometry can also be exploited to overcome signal drift in DNA-based electrochemical measurements. Drift is observed as a continuous change in the relative signal of the sensors that is independent of target concentration. For example, the signal of DNA-based sensors deployed in whole blood tends to decrease (i.e., drift) over time, presumably due to progressive degradation of the sensor interface.101 To overcome this problem, Arroyo-Currás and colleagues have demonstrated that chronoamperometric lifetime measurements (Figs. 6A, 6B) are inherently resistant to such drift.52 This resistance arises because the apparent rate of electron transfer of DNA-based sensors can be, to some extent, independent of the state of the interface. Thus, while the total amplitude of chronoamperometric currents drifts significantly (due to, for example, loss in total number of redox reporters), the lifetime of their exponential decay is independent of this amplitude and thus largely drift-free (Fig. 6C). Because of this property, chronoamperometry can support continuous, drift-free detection of analytes in untreated biological fluids.52

Figure 6. Chronoamperometry achieves drift-free and sub-second-resolved DNA-based sensing. (A) The difference in electron transfer rate between bound and unbound DNA receptors (Fig. 4E) can be measured as differences in current decay lifetimes. (B) Such lifetimes can be related to the concentration of the target in the sample. (C) Because chronoamperometric lifetimes are a function of the fractional population of bound vs unbound receptors, they are less sensitive to progressive changes of the sensor interface relative to total current amplitude (the current plateau in, for example, Fig. 5C), which depends on the total number of receptors. Thus, the chronoamperometric interrogation of DNA-based interfaces supports drift-free sensing. (D) A different interrogation mode, called Intermittent Pulse Amperometry, can be used to achieve few-millisecond-resolved measurements of target binding kinetics. (E) The output of each periodic pulse produces one forward and one reverse chronoamperograms, which can be subtracted to produce a differential current that is directly proportional to the concentration of target. (F) Monitoring such a differential current in real time allows the highly precise measurement of target-receptor association kinetics. Figures edited with permission from Refs. 52,94.
Serial and fast chronoamperometric interrogation can be applied to extract the rates of receptor-target binding. An example of this was reported by Santos-Cancel and colleagues, who used intermittent-pulse amperometry to measure the association rates of small molecule targets (the antibiotic tobramycin and adenosine triphosphate) to DNA receptors94 (Fig. 6D). This work claims interrogation frequencies as fast as one chronoamperogram every 2 ms (Fig. 6E). Such fast measurement frequencies enable the acquisition of hundreds of datapoints and allow the determination of binding kinetics with 95% precision or higher (Fig. 6F). We foresee that the amperometric interrogation of DNA-based sensors will also be exploited in the future to investigate the kinetics of fast physiological processes in the body, such as inflammatory response or neurotransmitter release and modulation.
Employing Cyclic Voltammetry for Sensor Characterization and Sensing
Cyclic voltammetry uses a voltage program that allows the easy characterization of the bioelectronic interface of DNA-based sensors. Specifically, in cyclic voltammetry, the electrode voltage is linearly swept at a constant scanning rate between an initial and a final value, then swept back to the initial voltage while continuously sampling the current (Fig. 7A). The resulting voltammogram (Fig. 7B) reports on the combination of ionic and faradaic charging/discharging processes occurring throughout the voltage sweep (Table I), which is seen as a series of peaks or waves. Because such processes are a function of the organization and composition of the interface, a cyclic voltammogram is a powerful tool for the electrochemical characterization of DNA-based sensors.53,77,99,102 For example, cyclic voltammetry can be used to determine the surface concentration of double and single stranded DNA.103 It can also be employed to determine the extent of passivating monolayer surface coverage and its homogeneity (i.e., to identify the presence of defects such as collapsed sites or pinholes).42,104 Additionally, by interrogating the sensor interface at different scanning rates, cyclic voltammetry can be employed to extract important electrochemical parameters of the redox reporter such as its diffusion coefficient (if present in solution phase)105 or its standard electron transfer rate.106 Beyond its analytical applications, cyclic voltammetry can also be used to directly interrogate DNA-based sensors.

Figure 7. Interrogation of DNA-based sensors via cyclic voltammetry. (A) The voltage program is a triangular waveform starting from a value where no charge transfer is observed (Ei), to a value where charge transfer is limited by the rate of electrochemical conversion of redox reporters (Eswitch), and then back to Ei. (B) The current output is a voltammogram characterized by having a duck-shaped current profile when the reporters are in solution (solid line) or a symmetric, gaussian-shaped profile for surface-bound reporters (dashed line). (C-D) Voltammograms representing unbound (solid line) and bound (dotted line) states for electrode-blocking-based detection (C, see Fig. 4C) and catalytic detection (D, see Fig. 4D). (E) Voltammograms obtained at low (solid line) and high (dotted line) scan rates for a surface-bound reporter.
The signaling output of sensors interrogated via cyclic voltammetry strongly depends on architecture and detection mechanism. For example, when the detection scheme relies on solution-phase redox reporters – e.g., systems based on hexacyanoferrate or hexaammine ruthenium salts – the output cyclic voltammogram has a characteristic duck shape that changes in magnitude following a binding event (Figs. 7C, 7D). Many examples of this sensing approach have been reported, which use cyclic voltammetry to study the blocking effect of a non-redox active protein that binds to anchor DNA receptors, causing a decrease in the voltammetric currents (Fig. 7C) (e.g., see Refs. 107,108); or measure the signal amplification (current increase) derived from the catalytic reaction between a DNA-bound reporter and a second reporter in solution (Fig. 7D) (e.g., see Refs. 28,109,110). Because the currents measured in these systems depend on the rates of reporter diffusion to the sensor surface, protein-DNA binding or catalytic reaction, the scanning rate must be adjusted as a function of the time constants of these processes (Table I).
When the sensor architecture involves surface-bound reporters - such as in the case of E-AB32 or DNA-scaffold sensors111 - the voltammetric currents are limited by the finite number of reporters attached to the sensor surface. In this situation, the currents raise to a maximum and fall back to background in a gaussian looking peak (Figs. 7B, 7E and 8B, 8C), with their height or area relating to the target concentration, and their width depending on specific factors such as the nature of the redox reporter, the thickness of the passivating layer, or the length of the labeled DNA probe.104 This sensor design, typically based on DNA-bound methylene blue or ferrocene reporters, is attractive for applications that require reagentless, continuous sensing29,30 because both the molecular recognition (the DNA strand) and the signaling (the reporter) elements are covalently attached to the electrode surface. Therefore, the addition of exogenous reagents in not needed for molecular detection. When these sensors are interrogated via cyclic voltammetry, the signaling output depends strongly on the scanning rate and the time constants of the different processes occurring at the sensor interface (Table I).112 For example, voltammograms scanned at rates slower than the apparent electron transfer rate of the system show complete conversion of the surface-bound redox reporter with minimal peak-to-peak separation between the forward and reverse scans (Figs. 7E and 8B).112 Moreover, in these measurements, the voltammogram's peak current linearly correlates with scanning rate (Figs. 8C, 8D). In contrast, when the sensors are interrogated at scanning rates that exceed the time constant of electron transfer, the electrochemical response becomes limited by the frequency with which the reporter can transfer electrons to the sensor (Fig. 8B). In such a case, the voltammograms present peak-to-peak separations that linearly increase with the square root of the scanning rate112 (Figs. 8C, 8E). The exact limit at which the response of the measurement changes depends on the composition of the assembled layer.106,113 Thus, the structure of the bioelectronic interface is also important to consider when choosing an electrochemical interrogation method.

Figure 8. Voltammetric behavior of DNA-based sensors with surface-bound reporters. (A) Here, for example, we illustrate the behavior of a sensor based on DNA hybridization. In the unbound, folded state, the proximity of the reporter to the surface allows electron transfer. In contrast, the bound, hybridized state hinders electron transfer. (B) This is reflected in the shape of the voltammograms obtained for each case, which shows a decrease in peak currents and broader peak-to-peak separation for the bound, hybridized state. (C) The cyclic voltammetry scan can be tuned to probe the different time scales and processes involved in signaling. For example, here we show that scan rates slower than the diffusional approach of the reporter to the electrode produce symmetric, sharp voltammograms. At rates that exceed the diffusional motion, however, the voltammograms become broader and the peak-to-peak separation increases. The scan rate threshold depends of course on the architecture of the interface. (D) For low scan rates, a linear relationship is observed between the scan rate and the peak current, indicative of electron transfer limited by surface confinement. (E) For higher scan rates, the electron transfer is limited by the motion of the reporter toward the electrode, and diffusion control is observed. Figures adapted with permission from Refs. 106,112.
One important caveat to using cyclic voltammetry for the interrogation of sensors employing surface-bound reporters is the inherent low signal-to-noise ratio of this technique. This problem arises from the fact that linearly polarizing the electrode surface causes progressive charging of the electrical double layer, which appears in a voltammogram as charging current (for example, see the thickness of the CVs in Fig. 8B). Depending on the density and organization of the blocking monolayer used in these sensors, the magnitude of the charging current could be comparable or greater than the faradaic current produced by the electrochemical conversion of the reporter. To overcome this limitation, we recommend the use of a different set of voltammetric techniques based on pulsed-voltage programs, which enable the discrimination between charging and faradaic processes when needed.
Achieving Charging Current-Free Sensing with Pulsed-Voltage Methods
Most clinically relevant targets exist at concentrations in the range of aM to nM54 and are likely to produce only small changes in the signaling current output of DNA-based sensors, making their detection strongly affected by charging currents. Thus, techniques that minimize the contribution of double-layer charging to the currents measured are particularly valuable for clinical applications. Specifically, pulsed voltammetric techniques overcome this issue by applying periodic voltage perturbations – such as voltage steps in differential pulse voltammetry (DPV) (Fig. 9A) and square-wave voltammetry (SWV) (Fig. 9B) or sinusoidal functions in alternating-current voltammetry (ACV) (Fig. 9C) – instead of the conventional linear perturbations applied in chronoamperometric and cyclic voltammetric techniques. Because these methods employ periodic perturbations, parameters like pulse width, signal frequency, and amplitude affect the currents (and interfacial processes) measured. Such parameters can be exploited to eliminate charging currents and simultaneously enhance the current generated by reversible redox systems such as the oxidation/reduction of a redox reporter, leading to mostly faradaic, high signal-to-noise measurements (Fig. 9D) and, consequently, lower detection limits.114 These features have made pulsed techniques the preferred interrogation approach for DNA-based electrochemical sensors.72

Figure 9. Interrogation of DNA-based sensors via pulsed-voltage methods. (A) In DPV, a voltage pulse of a certain width and amplitude is applied to the electrode. The current is measured immediately before and at the end of the pulse, and the difference between the two currents is used to create a voltammogram. (B) In SWV, a square waveform is superimposed on a voltage staircase. The current is measured at the end of each square pulse, producing forward (If) and reverse currents (Ir). The absolute values of both currents are subtracted to obtain a differential voltammogram. (C) In ACV, a sinusoidal waveform is superimposed on a linear ramp and the current is measured at a regular frequency. The reference parameter values shown in panels A-C were estimated from reported DNA-based sensors. (D) Depending on, for example, technique frequency, the output voltammogram for all three techniques can give a signal ON or OFF output upon target binding. (E) Current maps can be constructed to identify parameter combinations that produce the largest signal ON or lowest signal OFF outputs. (F) Those parameter combinations can then be employed to build dose-response curves. Here, for example, we show that the combination of 25 mV amplitude and 20 Hz frequency, and 25 mV – 750 Hz from the map in panel E, produce the largest signal OFF and ON responses, respectively, for the sensor interrogated. Figures adapted with permission from Ref. 73.
Pulsed techniques have been extensively used to interrogate DNA-based sensors that exploit solvated redox reporters for target detection. A few example approaches include the interrogation of sensors where target-binding physically blocks electrode access to the reporter, decreasing the peak current,115–117 and sensors with a sandwich-type configuration where the signal generated by target-binding is enzymatically or chemically amplified,118–120 enabling remarkably low detection limits.121 However, because of their unique ability to discriminate between charging and faradaic currents, pulsed methods are of most value for the interrogation of sensors relying on surface-attached reporters.27,122–125
Pulsed methods are not only attractive for their low detection limits, but also because their current output is convenient and easy to interpret. For example, all three methods discussed in Fig. 9 produce sharp, gaussian-like peaks that increase or decrease in magnitude upon target binding, depending on the technique parameters employed (Fig. 9D). Because the shape and magnitude of the currents measured by these methods are so strongly dependent on parameters like waveform frequency and amplitude, the construction of multi-parameter maps is a great resource to optimize their signaling (Fig. 9E). One approach to building such maps is to graph the peak current in the z-axis of a three-dimensional cartesian coordinate, where the y and x axes correspond to frequency and amplitude, respectively. Such maps reveal parameter combinations that lead to signal ON or OFF sensor responses upon target binding (Fig. 9F), which can be used to, for example, achieve calibration-free sensing.126
A second important attribute of pulsed methods is their ability to support drift free sensing. As described above, the waveform frequency and amplitude can be tuned to specifically probe the effect of target binding on the fractional populations of bound vs. free receptors80,127 (Fig. 10A). Moreover, previous reports have shown that waveform frequency pairs can be found which produce peak currents that drift in concert when the sensors are interrogated serially. Thus, by simply subtracting the signals recorded at such frequency pairs, pulsed methods enable continuous, drift-free measurements of targets in complex biological fluids.27,128 This approach, called Kinetic Differential Measurements (KDM), was first demonstrated for DNA-based sensors confined to microfluidic channels and challenged with target in a continuous stream of blood30 (Fig. 10B). However, by fabricating DNA-based sensors with a geometry factor small enough to fit inside the veins of rats, more recent reports have demonstrated the applicability of KDM to the continuous measurement of specific targets in vivo29,52,100 (Figs. 10C, 10D).

Figure 10. Pulsed methods are kinetically sensitive to differences in electron transfer between receptor populations. (A) By tuning the frequency of the pulsed waveform, it is possible to electrochemically discriminate between two populations of DNA receptors: one free and one bound to target. (B) Conveniently, for some frequency pairs the signal drifts in concert, allowing to differentially correct sensor drift in real time, an approach called Kinetic Differential Measurements (KDM). Here, for example, we show real-time drift correction of a concentration step for an E-AB sensor confined to a microfluidic channel. (C-D) This approach to drift correction works even when the sensors are deployed in situ in the veins of live rats. Here we illustrate this by showing the E-AB measurement of two bolus injections of a drug, here tobramycin, into a rat. The top graph shows concerted drift for the different frequency measurements which can be differentially corrected at the bottom to achieve drift-corrected, real-time sensing in vivo. Figures adapted with permission from Refs. 29,30,147.
Up to this point, the described amperometric and voltammetric methods are all limited in measurement frequency by the rate at which the redox reporter can transfer electrons. One alternative to overcome this limitation is, of course, to fabricate sensors with reporters that transfer electrons faster than the commonly used methylene blue. However, doing so is not straightforward, as changing the chemistry of the reporter always affects the properties of the sensor's biomolecular interface; for example, by making it less stable under continuous electrochemical interrogation.44 A second, and less explored alternative, is to use reporter-free interrogation methods such as electrochemical impedance spectroscopy, which we discuss next.
Performing Reporter-Free Sensing via Impedimetric Detection
Electrochemical impedance spectroscopy (EIS) offers the unparalleled ability to interrogate DNA-based sensors with or without the use of redox reporters. This ability exists because the currents measured in EIS are sensitive to surface processes that affect the electrical properties of such sensors: specifically, their interfacial capacitance (Cdl) and electron transfer resistance (Ret).129 The technique is based on overlapping a sinusoidal function (AC voltage) of low amplitude (typically ≤ 10 mV) to a constant DC voltage on the sensor surface (Fig. 11A) while measuring in real time the AC current output as a function of angular frequency. This frequency is swept from values ranging from roughly 10−2 Hz to 106 Hz, thus obtaining impedance spectra that can be represented in Nyquist (Fig. 11B) and Bode plots (Figs. 11C, 11D). Because the waveform frequency can be finely tuned, EIS enables the study of interfacial phenomena at different time scales (Table I), being particularly sensitive to double-layer-related processes.130 For in-depth descriptions of EIS, and its application to the interrogation of biosensors in general, we refer the reader to previously published, comprehensive reviews.131,132 Here, instead, we discuss a few key concepts that are relevant to the specific interrogation of DNA-based sensors.

Figure 11. Interrogation of DNA-based sensors via electrochemical impedance spectroscopy. (A) A sinusoidal voltage is applied (solid line) at a fixed frequency, generating the corresponding current (dashed line). This is repeated for a wide range of frequencies. (B) The imaginary part of the impedance is plotted against the real part for each sampled frequency to obtain the Nyquist plot. The value of the impedance and its phase angle at a certain frequency can be obtained from the module and the angle of the vector, respectively. (C-D) Bode plots provide another way of representing the data obtained in an EIS measurement. In this case, the impedance and the phase angle are plotted against the applied frequency, offering a straightforward manner to view the impedance at a certain frequency value. (B-D) Spectra obtained for a non-faradaic (dashed line) and a faradaic (solid line) system.
Arguably the major motivation to use EIS for the interrogation of DNA-based sensors is its ability to perform reporter-free detection. EIS achieves this by monitoring binding-induced changes to the double-layer capacitance driven by the mere interaction between immobilized DNA receptors and a target.133–135 Thus, by monitoring binding- induced changes to the double-layer capacitance at, for example, constant angular frequency, EIS allows the continuous measurement of fluctuating concentrations of target.136,137 This reporter-free approach is called non-faradaic impedance spectroscopy.138,139 Mechanistically, it is thought that target-binding changes the surface density of water molecules and ions at the sensor interface, thereby changing the double-layer thickness and, consequently, the interfacial capacitance, which can be related with the amount of target in the sample (Figures 12A–12C).140,141 However, the exact detection mechanism is often hard to define for a given sensor architecture and depends strongly on medium conditions like the concentration, pH, and composition of the electrolyte employed.141 Moreover, other challenges with this detection approach include the difficulty of developing signal-amplification strategies, and the non-specificity of capacitance-based detection—i.e., any entities interacting with the sensor interface can potentially change its capacitance—hindering its use in complex samples, such as blood, which are prone to blocking the electrode surface.

Figure 12. Impedimetric behavior of DNA-based sensors. (A) An illustrative example of a non-faradaic DNA-based sensor in which the immobilized aptamer binds the target molecule, modifying the morphology of the double-layer, (B-C) which leads to a change in its capacitance that can be related with the target concentration. (D) faradaic sensors, on the other hand, rely on the use of a redox compound to report the binding of the DNA probe with its target. (E-F) Upon binding, the electron transfer of the reporter with the electrode changes, and the electron transfer resistance can be related with the amount of target in the sample. Figures adapted with permission from Refs. 139,148.
An approach to achieving higher specificity and signal amplification in EIS is the use of reporter-based detection. Two modalities are often described in the literature: 1) the use of "labeled" receptors, which consist of reporters covalently attached to DNA strands anchored to the electrode surface, and 2) the use of "label-free" strategies, which typically consist of DNA sensors that rely on electron transfer from solvated reporters externally added to the sample141 or, in certain cases, on the intrinsic redox chemistry of the target molecule.142 Irrespective of modality, these approaches are known as faradaic impedance spectroscopy. The use of labeled receptors offers the possibility of achieving continuous, real-time sensing since, in theory, the addition of exogenous reagents is not needed for detection. However, receptor labeling itself requires extra synthetic steps, and a deep knowledge of the molecule is required so that its binding capacity remains unaltered after modification.143 In contrast, label-free detection may be less prone to reporter-induced fouling of the receptor. For example, electron transfer from the redox couple [Fe(CN)6]4−/[Fe(CN)6]3− is affected by binding-induced electrostatic changes in the backbone of DNA.132,144,145 The binding of the target molecule to the immobilized DNA strand alters the conformation and charge distribution of the interface, further modifying this electron transfer resistance and, consequently, allowing the relation of this parameter to the amount of target in the sample (Figures 12D–12F).
Conclusions
DNA-based electrochemical sensors emerged as an alternative to enzyme-based and antibody-based measurements for analytes that cannot be detected by such approaches (i.e. when the analyte is not the substrate of a known enzyme or if there is no antibody that can recognize it). The analytical value of DNA for electrochemical biosensing derives from the relative facility with which DNA can be organized in specific conformations146 and on its binding versatility— DNA can bind with high specificity to ions,27,28 small molecules,29,30 proteins or nucleic acids31,32 and even whole cells.33,34 However, to fully exploit the analytical potential of DNA-based sensors, it is essential to have a clear, deep understanding of the features and advantages that different electrochemical methods offer for their interrogation. The selection of the most suitable technique for a given application naturally depends on biosensor architecture, detection mechanism, time-resolution needed, and required sensitivity. Here, we discussed the advantages of different interrogation techniques considering sensor configuration (i.e., if a redox reporter is added to the system and whether that reporter is tethered to the sensing layer or free in solution) and the time scales of the physicochemical phenomena occurring at the interface during sensing (Table I). Beyond simply providing a technical description of methods, which has been done in many previous reviews,42 here we point to specific measurement advantages that are somewhat unique to each technique (Table II). For example, we recommend chronoamperometry as the method of choice if fast, sub-second measurements are needed. Cyclic voltammetry is a great tool for analytical characterizations of sensor interface. However, the value of the latter for sensor interrogation can be limited by its inability to discriminate between charging and faradaic currents. In contrast, pulsed-voltage methods offer charging-free sensing and high detection limits. Finally, if the reporter itself sets the limit in temporal resolution for sensing, electrochemical impedance supports reporter-free sensing. We also discuss applications of the above-mentioned techniques to achieve calibration-free and drift-corrected sensing.
Table II. Merits and Demerits of Electrochemical Methods Most Commonly Used for the Interrogation of E-AB Sensors.
| Acquisition | Reporter-Free | Eliminates | ||
|---|---|---|---|---|
| Technique | Time (s) | Drift-Free Measurements? | Measurements? | Charging Current? |
| Cyclic Voltammetry | 10−1 – 1 | Not demonstrated | No | No |
| Chronoamperometry | 10−3 – 1 | Yes, via current decay lifetime measurements | No | No |
| Differential Pulse Voltammetry | 1 – 30 | Not demonstrated | No | Yes |
| Alternating Current Voltammetry | 10−1 – 1 | Not demonstrated | No | Yes |
| Square Wave Voltammetry | 1 – 30 | Yes, via differential frequency measurements | No | Yes |
| faradaic Impedance Spectroscopy | 10 – 100 | Not demonstrated | No | Yes |
| Non-faradaic Impedance Spectroscopy | 10 – 100 | Not demonstrated | Yes | No |
The ideal interrogation method for future sensor developments will be dictated by the analytical application. As future perspectives we speculate that voltage-pulsed methods will be the choice for applications related to decentralized diagnostics (including point-of-care detection). We say this because the convenient output of these methods, a current peak, can be easily interpreted by technicians with minimal training or automated systems. Moreover, pulsed methods are the least affected by charging currents, which can foul the outcome of electrochemical measurements. We also speculate that cyclic voltammetry will continue to be the method of choice for the electrochemical characterization of bio interfaces; although, it will likely play a key role for in-vivo measurements in the brain, alongside chronoamperometry. We say this because both techniques allow rapid, sub-second measurements, which are necessary to monitor rapid neuromodulation events. Finally, impedimetric methods are also a powerful approach for the surface characterization of biosensor homogeneity and architecture. They are more sensitive to changes in sample environment, including pH and ionic strength, but are extremely powerful for target detection in controlled environments, and probably represent the best alternative for the interrogation of sandwich-type assays in vitro. The future will tell if any of these predictions hold, or if even more advanced techniques will be employed for the interrogation of more complex DNA-based sensors.
We hope this review will serve as an easy reference to experienced scientists, and that it will assist the newcomers to the field in identifying best interrogation approaches during the development of next generation DNA-based sensors.
Acknowledgments
NAC thanks Oak Ridge Associated Universities (ORAU) for granting a Ralph E. Powe Junior Faculty Enhancement Award in support of our ongoing research efforts in the field of DNA-based sensors.
ORCID
Miguel Aller Pellitero 0000-0001-8739-2542
Alexander Shaver 0000-0002-5478-5291
Netzahualcóyotl Arroyo-Currás 0000-0002-2740-6276