
Abstract
To support the increasing demand of a growing population for freshwater, small-sized (<0.1 km2) water reservoirs are necessary in areas with limited infrastructure, especially in water-stressed regions having seasonal and variable precipitation. Seasonal storage in small reservoirs is often overlooked in present inventories. Accordingly, we assessed the current state in semi-arid regions using highly resolved Sentinel-2 satellite imagery. Globally, about 3 million small reservoirs are in operation in semi-arid regions having a total water surface area of 17 800 km2 and seasonal storage of 37 km3, supporting 15% of the world’s population in semi-arid regions. Estimated upper-bound of evaporative losses represent 38% (14 km3) of storage during dry season. The study estimates the evaporation suppression using floating covers and lays foundation to assess the feasibility of this technical solution to increase water savings.
Significance and originality statement
This study provides new insights into the distribution of seasonal freshwater storage in water stressed regions that support large rural population. We provide the first baseline dataset of this distributed freshwater resource to better assess the sustainability of communities in semi-arid regions with chronic water shortages. Water storage in semi-arid regions is subject to potential evaporative losses of nearly 40% of the stored water. We analyzed conditions where evaporative losses could be significantly reduced using floating covers, a simple and scalable solution suitable for regions with underdeveloped economies. The study as well ranks regions with highest potential benefits from evaporation suppression measures.

Original content from this work may be used under the terms of the Creative Commons Attribution 4.0 licence. Any further distribution of this work must maintain attribution to the author(s) and the title of the work, journal citation and DOI.
This article was updated on 18 May 2021 to add permission lines to the figures.
1. Introduction
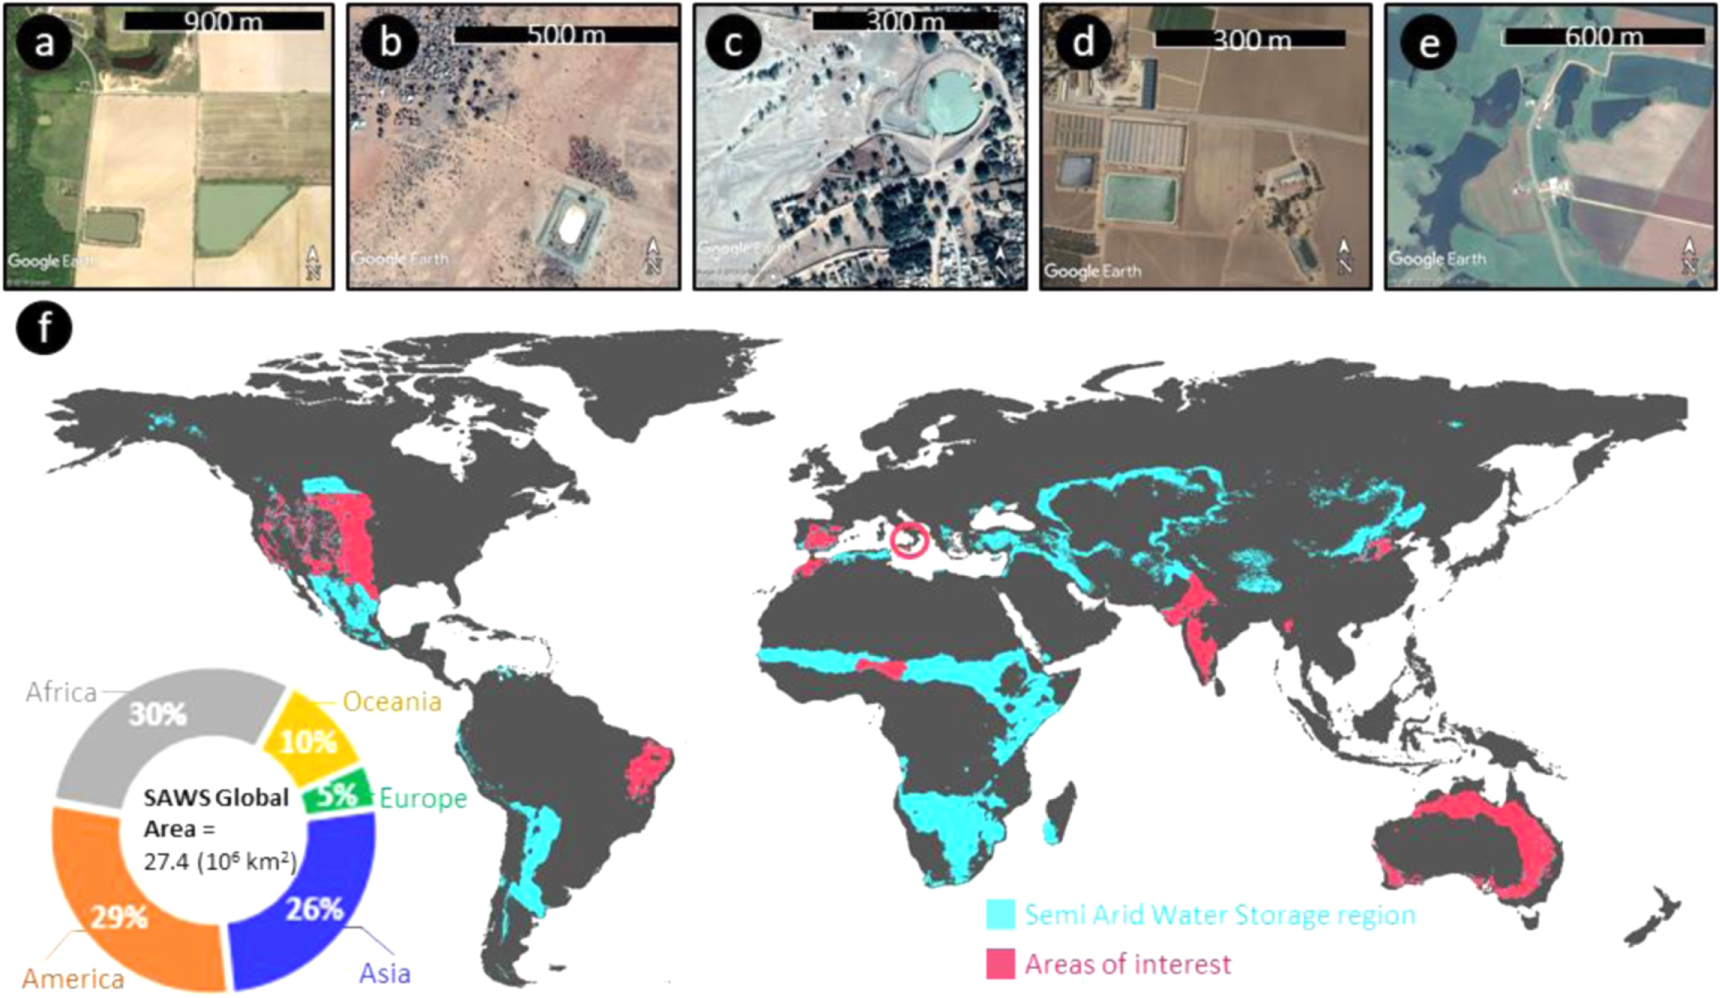
The long tradition of freshwater storage in reservoirs to meet dry-season needs is likely to expand due to the increasing water demand for food production, in a changing climate of a rapidly growing human population [1]. Small seasonal reservoirs have been used in different regions of the world for centuries, especially in semi-arid regions (known under different local names [2, 3], see figures 1(a)–(e)). In these regions, dry-season water shortages for agricultural livelihood are common and water storage remains a feasible mitigation measure, while more recently, additional off-grid electric power supply was facilitated by means of micro-dams [4, 5]. In contrast with well-studied large reservoirs and dams, small-sized and seasonal freshwater storage systems have relatively low environmental impact [6], yet their distribution and function during dry seasons plays a critical role in promoting the sustainability of rural communities and farmers, and reduce societal inequality gaps [7] for 15% of the world’s population inhabiting semi-arid regions [8].
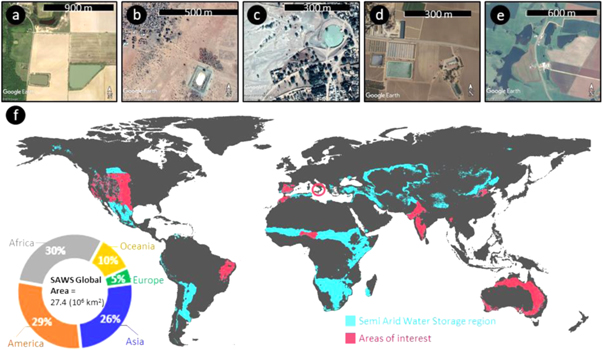
Figure 1. Examples of small reservoirs in semi-arid regions, reproduced with permission from [9]. [Map data ©2018 Google]. (a) Farmers in the US use ‘On-Farm Reservoirs (OFR)’ to collect runoff [10]. (b) ‘Hafir’ is a reservoir of 15–250 thousands m3 volume in semi-arid parts of Sudan [2]. (c) ‘Johad or tank’ is old tradition in Indian scattered settlements [2]. (d) ‘Agricultural Water Reservoirs (AWR)’ are widely used in South Spain [11]. (e) ‘Farm dams’ in Australia secure food supply all year round [12]. (f) Semi-arid water storage regions (SAWS; aridity index AI < 0.5 and mean annual precipitation MAP > 300 mm yr−1) and ten specific areas of interest (AOI) in different parts of each continent where water storage was estimated using satellite imagery (shown in red colour in the map; the small AOI in Italy is highlighted by red circle). The pie chart illustrates the shares of the SAWS land area.
Download figure:
Standard image High-resolution imageThe significance of dry-season water scarcity in rural semi-arid regions with limited infrastructure goes beyond the water value in terms of costs of alternate water sources. It determines the number of livestock that can be supported or the severity of staple crop yield losses [13]. Water shortages have amplified from 6% to 35% between 1960 to 2005, and the gap continues to expand with population growth especially in Southern Asia [14]. Systematic socio-economic analyses of seasonal rainwater harvesting methods have concluded that open water reservoirs and sand dams with capacities of 100 to 10 000 m3 are the most efficient (0.04–0.4 USD m−3) due to their longer lifetime [15]. However, in some basins it has been shown that river discharge could be impacted by uncontrolled construction of farm dams, especially in the absence of regulation for reservoir filling periods [6, 16]. At present, in some catchments the density of such small reservoirs may reach 10 reservoirs per km2 [16], yet a systematic assessment of the global distribution of such an important class of small reservoirs remains lacking. With development of remote sensing techniques for retrieving salient information from satellite imagery [17–19], the identification of locations, sizes, and usage of small water reservoirs now becomes feasible.
Globally, freshwater storage is distributed predominantly in temperate and cold climates where a few large reservoirs dominate the regional storage. The nature of reservoir size and number distributions suggest power-law relations where the number of small reservoirs far exceeds that of large ones [20]. Estimates based on global data sets [21, 22] show that 1.8% of land area is covered by reservoirs and large lakes, however, these values omit small reservoirs (<0.1 km2 that are the core of this study) and the gaps to this point are primarily addressed by extrapolation of size distribution models [18]. Based on a number of surveys in a few regions of the world, Downing et al [23] estimated that small impoundments and farm reservoirs account for up to 1.2% of global land area.
The characteristics of small seasonal reservoirs, i.e., freshwater bodies with an area <0.1 km2, vary across regions reflecting geomorphological, climatic and social factors [24–26] (see figures 1(a)–(e)). A comprehensive dataset (Hydrolakes) lists 1.42 million freshwater reservoirs and storage lakes with 182 000 km3 total storage [19]. Hydrolakes dataset considers storage reservoirs and dams with volumes larger than 0.1 km3 including 6 862 reservoirs previously reported in a related dataset (GRanD [27]). Both global datasets neglect local (on-farm or village) small reservoirs (<0.1 km2) that are crucial to rural communities with chronic seasonal water shortages, limited infrastructure and often lacking alternate water sources. This omission of small reservoirs is pervasive in other global studies of inland water bodies, often attributed to resolution limits of satellite products, such as MODIS [28] and Landsat [29, 30] with spatial resolutions of 250 and 30 m, respectively.
Advanced satellite imagery at 10 m resolution (Sentinel-2) permits bridging this gap to provide regional estimates of the numbers, sizes and spatial distributions of small water reservoirs (<0.1 km2) in semi-arid regions. These highly stressed regions are home for approximately one billion people, typically living in rural communities under conditions of chronic water shortages. The high evaporative demand in these regions results in 20 to 50% loss of the stored water [12, 31]. In this study, we aim to estimate potential evaporative losses from small reservoirs in different semi-arid regions of the world, and assess the potential of reducing evaporative losses using floating covers [12, 32, 33]. The specific objectives of this study were to: i) quantify the numbers and sizes of small water reservoirs in semi-arid regions globally, and ii) estimate evaporative losses and potential of evaporation suppression measures, considering climatic conditions in each region.
2. Materials and methods
2.1. Identification of study regions
To quantify the size and density of small water reservoirs and estimate associated evaporative losses, we selected regions where water is seasonally scarce, yet rainfall is predictably sufficient to fill water reservoirs. Our study focuses on semi-arid regions (prone to high evaporation losses) where seasonal rainfall (800 mm > mean annual precipitation (MAP) > 300 mm) as delineated in figure 1(f). The mean annual aridity index (ratio of precipitation to potential evapotranspiration) AI < 0.5 [34, 35] was estimated from 1950 to 2000, and MAP > 300 mm for the record from 1979 to 2013 [36]. We filtered out regions that preclude the use of reservoirs, such as forests, urban areas, wetlands, and mountains using consistent global land cover (300 m pixel size) ESA products [37].
Within this region (called semi-arid water storage region, SAWS), we selected 10 specific ‘areas of interest’ (AOI) where—(i) different forms of agriculture are taking place, and (ii) water storage could be practiced. The 10 AOI cover a range of socio-economic states, agricultural practices, and infrastructure potential conditions (for assessing alternate water sources and evaporation suppression value) across five continents focusing on USA, Brazil, Spain, Italy, Morocco, Nigeria, India, Myanmar, China, and Australia as representative countries.
2.2. Small reservoirs detection
The AOI is overlain by a 10 × 10 km grid with 10% of grid cells (a grid cell is denoted in the following as a ‘mask’—see SI, figure S1 is available online at stacks.iop.org/ERC/2/061002/mmedia) randomly chosen to quantify water reservoir size and spatial density from the relevant Sentinel-2 satellite imagery within each mask (the sampling percentage choice of 10% of the AOI is explained in SI– figure S2). The Satellite captures 13 different wavelength bands (443 nm–2190 nm) with pixel size of 10–60 meters (depending on wavelength; see SI, table S1). As we show in more detail in Supplementary Information file (figure S9), the reflectance (measured by satellite) in the infrared range is much smaller compared to soil and vegetation and can reasonably distinguish water bodies.
We used imagery acquired at the end of the wet season (see SI, figure S6 for the distinction between wet and dry seasons) assuming that most reservoirs are water filled—this is marked as time T0. Another image for the same area is acquired 90 days later in the dry season (Tval) to provide quality check and avoid randomly inundated lands (only areas also classified as ‘water’ after 90 days are considered as water reservoirs). To classify water reservoirs, inundated agricultural land (e.g., rice) and vegetation, we have used two indices; Normalized Difference Water Index NDWI (positive for water areas but negative for other surfaces), and Normalized Difference Vegetation Index NDVI (positive for vegetation) that were computed at T0 and Tval. Region-specific thresholds were defined for NDWI and NDVI to extract binary images for vegetation and initial water bodies (see SI, section 1 and figure S1).
2.3. Power-law frequency-magnitude distribution
Results of previous inventories of large reservoirs and natural lakes [38] show that the frequency-size distribution follows a power-law. As presented in figure 2(b), a power-law distribution was fitted for our data of small water reservoirs (5 size classes) truncating areas above 100 000 m2 (0.1 km2) and those below 300 m2 as well to reduce the bias that can be introduced to the fitted power-law exponent (decrease in the absolute value of β) with the detection failure of reservoirs at the satellite imagery cell limit (100–200 m2). We bin the frequency of reservoirs that fall in 5 size classes since the reservoirs have irregular shapes and might not be filled to top at time of image acquisition; hence the exact area of the reservoir could have some discrepancies particularly because a rather conservative NDWI threshold is applied. The power-law is determined by computing the probability density function (pdf) for the reservoir sizes extracted from the masks:

with reservoir area A, coefficient K and power-law exponent β. To estimate the total storage in the SAWS (AOI in addition to blue area in figure 1(f)), we first aggregated all water reservoirs from the different AOIs by continent (note that in the remaining text ‘Oceania’ is referred to as ‘Australia’ due to the lack of SAWS in other parts of that geographic region), then derived power-laws for each continent (see SI—table S2) scaled for reservoir density per km2 and size. The differences reflect effects of climate and anthropogenic practices in different regions of the world since abundance of natural lakes in semi-arid regions is marginal [23].
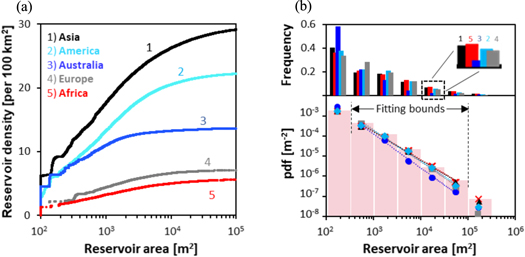
Figure 2. The size distribution of small water reservoirs within the area of interest (AOI) for semi-arid regions in each continent. (a) cumulative small reservoirs spatial density per 100 km2 (note that reservoir sizes from 100–300 m2 are not included in further analysis), and (b) frequency and fitted power-law of probability density function (pdf) for binned reservoir size classes with cutoffs at 300 and 100 000 m2 (illustrated on figure by dashed vertical lines and pink bars).
Download figure:
Standard image High-resolution imageTo estimate number and volume of reservoirs, we assign a representative size to each of the five size classes (‘bins’) that were used to determine the power-law (see figure 2(b)). The estimated number of reservoirs within a size class of areas ΔA defined by maximum amax and minimum area amin was then calculated as:

with area M of SAWS per continent in km2 and the area A in m2 representative for the size class defined by:

Studies have shown that reservoir volume is related to its surface area by power function whose parameters may vary spatially [24, 39]. We synthesized several reported power-laws linking reservoir area and volume into a representative relation which includes the regional differences (see SI, section 2). The relation enables estimation of the stored water volume (V, m3) from observed reservoir area (A, m2) (see SI, figure S3) using:

To estimate the water storage per SAWS for each continent, we estimate the volume of reservoirs within a size class of representative area A with density N simply as:

3. Results and discussion
3.1. Inventory of small water reservoirs in semi-arid regions
We estimate small reservoir numbers and storage capacity in semi-arid regions (about 27 million km2—21% of the Earth land surface). The number and areas of small water reservoirs were estimated by spatial sampling of 4770 masks (each covering 100 km2) randomly distributed over 10% of the representative AOI (red regions in figure 1(f)). The spatial density of small reservoirs varied across regions (SI, table S3) with highest density of 420 reservoirs in a sampling mask in South Asia (India). The lowest average spatial density per country was 5 small reservoirs per 100 km2 in Nigeria, and the highest was in Myanmar with 40 small reservoirs per 100 km2. The probability density function of reservoir sizes obtained for size classes between 0.0003 and 0.1 km2 in SAWS of each continent followed a power-law (see equation (1) in section 2) with similar exponents near 1.5 irrespective of climate and population density, as depicted in figure 2. Additional information on the sensitivity of the power-law coefficients to the sampling procedure and reservoir extraction accuracy are provided in SI—figures S2 and S4, respectively. The number and area of small water reservoirs for the entire SAWS of each continent were deduced from the estimated power-laws as represented in figure 2(b), and water storage volumes from area-volume relations (see equation (4) in section 2). The median small-reservoir size was ∼1 400 m2 with Australia tending to have smaller reservoirs, and the largest in Africa and America. As reported in table 1, we estimated 2.9 million small reservoirs globally in the SAWS with an estimated total water surface area of 17 800 km2 and seasonal storage of 37 km3.
Table 1. The estimated storage and computed evaporation losses of small reservoirs in the semi-arid water storage region (SAWS, blue and red area in figure 1(f)) of each continent for this study.
| Continent | Mean rainfall in SAWS (mm yr−1) | Evaporative demand (ET0, mm yr−1) | Estimated no. of reservoirs (103) | Estimated area of reservoirs (km2) | Estimated storage (km3) | Evaporation losses (%) | Evaporation losses (km3) |
|---|---|---|---|---|---|---|---|
| America | 529 | 1750 | 1136 | 6167 | 13.7 | 31 | 4.2 |
| Europe | 444 | 1343 | 60 | 267 | 0.5 | 23 | 0.12 |
| Asia | 477 | 1574 | 1217 | 8695 | 16.5 | 39 | 6.5 |
| Australia | 540 | 2400 | 156 | 569 | 1.2 | 53 | 0.63 |
| Africa | 600 | 2317 | 294 | 2111 | 4.8 | 52 | 2.5 |
| Global (SAWS) | 520 | 1875 | 2863 | 17 809 | 37 | 38 | 13.95 |
Note: the mean rainfall and evaporative demand (ET0) is the annual average for the whole semi-arid region in each continent. The estimations are computed using equations (2), (5) for reservoir sizes between 300 and 100 000 m2, and the cumulative evaporation losses are represented (i) as percentage of the estimated storage per continent and (ii) as volume per dry season.
We examined the potential of extending power-law distributions of size-densities for large reservoirs from other studies to recover the small-reservoir results of this study. For a direct comparison, we first estimated power-law relations for the size distribution of large lakes or reservoirs (Hydrolakes and GRanD) restricted to the SAWS in each continent [19, 27]. The extrapolated estimates using large water bodies relations exhibited significant discrepancies with the direct estimates of small reservoirs size-density (see SI, figure S5(a) and table S2). In addition, we found that the approach proposed by Downing et al [23] for estimating farm ponds from the area of farmlands (within administrative boundaries; e.g. cities) and mean annual precipitation tends to overestimate reservoirs coverage as shown in SI (figure S5(c)) for an example in entire SAWS of India. The discrepancy could be attributed to the climatic differences as their field surveys were conducted primarily in humid regions of the USA. Finally, we assessed whether the size-density distribution of small reservoirs in SAWS, primarily in the USA, was similar to that obtained for natural lakes and reservoirs of same size range in humid northern regions. The resulting size-frequency distribution of natural lakes with areas between 0.0003 and 0.1 km2 delineated from Sentinel-2 imagery followed a power-law with an exponent of 1.2 (see SI, figure S5(b)) and was significantly lower than exponent of 1.8 for water reservoirs in semi-arid regions. The total water surface area per 100 km2 for natural small lakes was 25% less than for small water reservoirs in semi-arid regions. These results suggest that resulting small-reservoir size distributions carry signatures of anthropogenic construction practices and differences in climatic conditions.
3.2. Estimated evaporation losses from small water reservoirs
Water losses from small reservoirs in semi-arid regions are attributed primarily to evaporation [40]. Seepage losses are negligible considering that on-farm ponds are often lined by low-permeability clay liners, plastic sheets or sprayed concrete [2, 41]. An objective of this study was to capitalize on the estimated small-reservoir distribution to assess the efficacy of methods for suppressing evaporation in their regional context. We thus estimate the regional evaporation demand considering regional climate and seasonal storage.
While direct measurements of open water evaporation are scarce in semi-arid regions, Penman-Monteith equation (see SI, section 2.2) was proven to provide relatively good estimates for evaporation from open water showing low sensitivity to parameter variations compared to other methods [12, 40, 42, 43]. The evaporative budget (ET*) from free water surfaces of small reservoirs was computed for each region by subtracting the mean monthly precipitation (P) from the cumulative monthly evaporation (ETo) computed with standard FAO application of the Penman-Monteith method [44] reported in CGIAR dataset [34] (see SI, figure S6(B)) [35]. The estimates focused on the dry period, when evaporative rates are highest and reservoir inflows are negligible. The global precipitation dataset Chelsa [36] was used to identify the dry period for each region within the prescribed SAWS. The months with rainfall values lower than 30% of the maximum monthly precipitation for the northern and southern hemispheres were considered as ‘dry season’ (for equatorial regions the threshold was 50%; see SI—figure S6(A)).
For the computation of the volume losses, we considered a unified geometry for the reservoirs (see SI, section 2.2 and figure S3). During the dry season, the diminishing water depth and shrinking evaporating surface area are calculated based on this unified geometry. The results in figure 3 show that estimated evaporative losses (i) may amount up to 75% of stored water during the dry season, and (ii) vary with regional climate. Note that these estimates represents the upper bound of losses since it neglect the withdrawal of water for water use. When the sum of evaporation and withdrawal during the wet season is larger than the stored volume, the fraction of evaporation to stored volume is slightly different (especially for sizes >3000 m2). This is discussed in Supplementary Information file (section 3.1 and table S5).
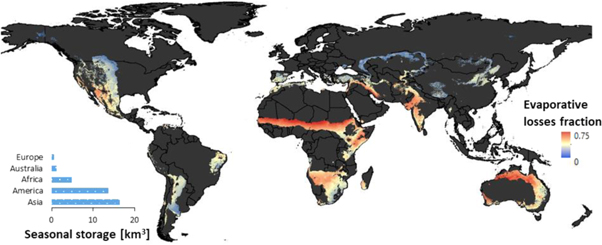
Figure 3. Estimated evaporative losses as a fraction of storage in small reservoirs per 100 km2. The inset bar chart shows the estimated water storage volume at end of the wet season in the semi-arid water storage regions (SAWS) of each continent. The estimated global storage at end of wet season and losses during dry season are 37 and 13.8 km3 respectively.
Download figure:
Standard image High-resolution imageThe fraction of estimated evaporative water losses ranges from 5%–10% in northern latitudes to 75% in the Sahel region and in Australia due to the reception of higher solar radiation in the latter regions. In terms of absolute volumetric water losses (see SI, figure S7), the highest losses were in America and Asia due to high reservoir densities (figure 2(a)). The estimated losses amount to about 38% (13.8 km3) of the storage during the dry season in the SAWS, while globally the evaporative budget of large dams and artificial reservoirs accounts for only 5% of total storage as reported by Aquastat [45]. Hence, the need for evaporation protection for seasonal small reservoirs in semi-arid regions is acute and should be given attention as discussed in next sub-section.
3.3. Evaporation suppression using floating covers—water saving potential
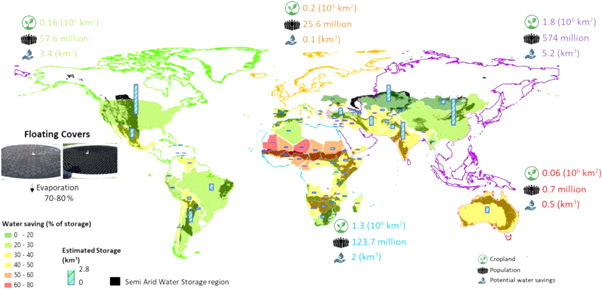
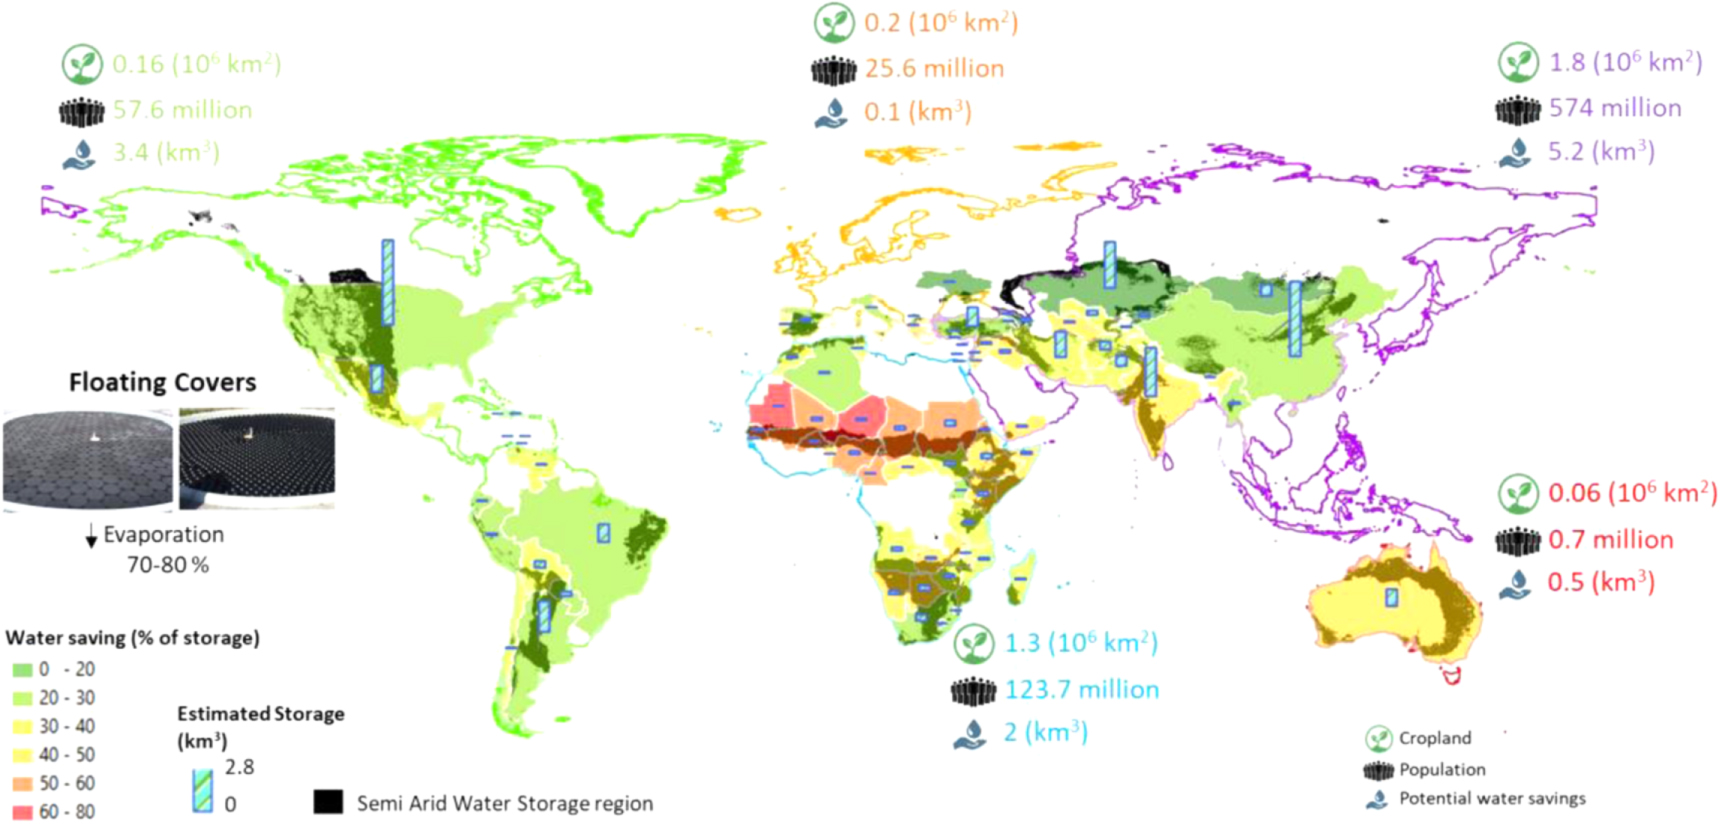
Cheap floating cover elements could be a simple and scalable solution for suppressing evaporative losses from the many small reservoirs that serve largely rural populations in semi-arid regions. Results from recent studies have shown that across a wide range of climatic conditions, such covers suppress between 70 and 85% of the evaporation relative to uncovered water surfaces [33, 46]. Floating covers reduce the exposed water surface, increase the effective boundary layer over the surface, and shift radiation and heat exchange from the water surface to the top surfaces of the covers [33, 46]. The packing of floating spheres or discs permit light penetration and gas exchange through the 9% uncovered area (gaps formed between the elements), thus permitting ecological functions (we report preliminary results from an ongoing field experiment in SI—section 3 and figure S8). Attractive features of this technologically simple evaporation suppression method are (i) the relatively low cost (SI—section 4), and (ii) the scalability to various reservoir sizes, particularly suitable for small on-farm reservoirs.
The cover effectiveness is influenced by atmospheric conditions [46], but for simplicity we have used a constant evaporation suppression efficiency of 80% over the dry season as specified by Aminzadeh et al [33] for Styrofoam disks. In figure 4, we add regional context by presenting savings percentage for each country of SAWS and highlighting social information about the population and agricultural land areas in each continent. Figure 4 reveals that the highest suppression potential is in the Sahel region. However, such ranking may differ considering the economic value of an alternative water source (see SI—section 4). For example, the rank of Australia in the list of suppression potential may decline considering seawater desalination price (due to proximity of SAWS region to the coast and the generally flat topography, the transport of desalinated water may be cheaper than buying floating covers).
Figure 4. Potential evaporation suppression from small reservoirs (<0.1 km2) in semi-arid regions using floating covers. The colors indicate the fraction of water saving by evaporation suppression for each country of SAWS region, and bars show the estimated storage volume. Total cropland areas, reproduced from [37]. CC BY 4.0, population size, reproduced with permission from [47]. [© ESA Climate Change Initiative - Land Cover led by UCLouvain (2017)], and evaporative savings in the semi-arid regions for each continent are given. For estimating water savings, 80% suppression of the potential evaporation losses listed in table 1 are assumed. The inset shows pictures from a field experiment with floating covers (disks and spheres covering a pond area of 14 m2, see SI—figure S8).
Download figure:
Standard image High-resolution image
4. Summary and conclusion
We provide new global estimates of the spatial distribution and storage capacity of small water reservoirs (0.0003 to 0.1 km2) in semi-arid regions using high-resolution multi-spectral Sentinel-2 imagery. The resulting small-reservoir densities follow remarkably similar power-law frequency-size relationships, with exponent values close to those of large natural lakes and big reservoirs reported in existing databases (Hydrolakes/GRanD). Despite the exponent values’ similarity, we found that the information gap on small reservoirs cannot be extrapolated from existing large dams and lakes data due to the significant difference in spatial densities of small compared to large reservoirs. Hence, for the first time, our study provides reliable estimates of water storage for small reservoirs and enables the estimation of maximum evaporative losses and evaporation suppression potential using floating covers. The water storage in small reservoirs can be characterized as follows:
- The total number of small reservoirs in semi-arid regions is about 2.9 million with a water surface area of 17.8 thousand km2
- The spatial distribution and areal density of small reservoirs vary significantly (0 to 420 reservoirs per 100 km2)
- The global seasonal storage in semi-arid regions is about 37 km3
- Compared to total freshwater reservoirs, the storage in small water reservoirs is small; nevertheless, small reservoirs have a high socio-economic value due to their high density (250 l/capita/dry day for 1 billion people in semi-arid regions)
- The estimated evaporative losses during the dry season may amounts up to 38% of total storage (13.8 km3 losses from 37 km3 storage) depending on regional climate
- Floating covers could suppress 70%–85% of the evaporative losses
These important and spatially distributed seasonal freshwater storage reservoirs are essential for a significant fraction of the global population (mostly rural) that live in regions with chronic water shortages. The new inventory of small reservoirs enables estimates of seasonal water storage and evaporation losses that are regionally referenced. This information could be of great importance for governments or international organizations to better assess the sustainability of large rural communities in semi-arid regions. It can be utilized for instance to quantify the economic potential of evaporation suppression using floating covers, considering the local climate and infrastructure (see preliminary analysis in SI, section 4).
Acknowledgments
This work was supported by funding provided by the Swiss National Science Foundation (SNSF; project Nr. 200021_172493). S.M. Gorelick was supported by the Belmont Forum Sustainable Urbanisation Global Initiative (SUGI)/Food-Water-Energy Nexus theme via the US National Science Foundation under grant ICER/EAR-1829999 to Stanford University. Any opinions, findings, and conclusions or recommendations expressed in this material do not necessarily reflect the views of these funding organizations. We thank the organizations and scholars that made their data publically available (Sentinel-2 Satellite imagery, and Grand/Hydrolakes global databases, ESA land cover maps), which we used in the reservoir quantification and comparisons.
Data availability
The data that support the findings of this study, as well as the data layers used for the sampling procedure sensitivity checks are available at repository: ‘https://figshare.com/s/c258f1894088eaff7ff0’. All the external datasets that have been used are referenced in the text.
Code availability
The code used for the probability function fitting, reservoir spatial coverage estimation, and sampling procedure sensitivity checks is available at repository: ‘https://figshare.com/s/c258f1894088eaff7ff0’.
Author contributions
B M, P L and D O led the study. B M designed and implemented the computation algorithms, processed the data, and assembled the database. P L and B M performed the data analyses. B M wrote the first draft of the manuscript. P L and D O edited the manuscript. D O and S G revised the manuscript and made significant contributions to the data interpretation. P L, D O and S G read and approved the final version of the manuscript.