
Abstract
The Global Ecosystem Dynamics Investigation (GEDI) is a waveform lidar instrument on the International Space Station used to estimate aboveground biomass density (AGBD) in temperate and tropical forests. Algorithms to predict footprint AGBD from GEDI relative height (RH) metrics were developed from simulated waveforms with leaf-on (growing season) conditions. Leaf-off GEDI data with lower canopy cover are expected to have shorter RH metrics, and are therefore excluded from GEDI's gridded AGBD products. However, the effects of leaf phenology on RH metric heights, and implications for GEDI footprint AGBD models that can include multiple nonlinear RH predictors, have not been quantified. Here, we test the sensitivity of GEDI data and AGBD predictions to leaf phenology. We simulated GEDI data using high-density drone lidar collected in a temperate mountain forest in the Czech Republic under leaf-off and leaf-on conditions, 51 d apart. We compared simulated GEDI RH metrics and footprint-level AGBD predictions from GEDI Level 4 A models from leaf-off and leaf-on datasets. Mean canopy cover increased by 31% from leaf-off to leaf-on conditions, from 57% to 88%. RH metrics < RH50 were more sensitive to changes in leaf phenology than RH metrics ⩾ RH50. Candidate AGBD models for the deciduous-broadleaf-trees prediction stratum in Europe that were trained using leaf-on measurements exhibited a systematic prediction difference of 0.6%–19% when applied to leaf-off data, as compared to leaf-on predictions. Models with the least systematic prediction difference contained only the highest RH metrics, or contained multiple predictor terms that contained both positive and negative coefficients, such that the difference from systematically shorter leaf-off RH metrics was partially offset among the multiple terms. These results suggest that, with consideration of model choice, leaf-off GEDI data can be suitable for AGBD prediction, which could increase data availability and reduce sampling error in some forests.
Export citation and abstract BibTeX RIS

Original content from this work may be used under the terms of the Creative Commons Attribution 4.0 license. Any further distribution of this work must maintain attribution to the author(s) and the title of the work, journal citation and DOI.
1. Introduction
Forests are a large global carbon stock, but substantial current uncertainties in the spatial distribution of forest aboveground biomass density (AGBD) limit our ability to understand feedbacks between forests and global land use and climate change (Friedlingstein et al 2022). The Global Ecosystem Dynamics Investigation (GEDI) is a spaceborne lidar mission designed to characterize ecosystem structure and improve estimates of AGBD in temperate and tropical forests (Dubayah et al 2020, Dubayah et al 2022a). The GEDI instrument, onboard the International Space Station (ISS), is a waveform lidar sensor that samples ∼25 m footprints in eight parallel ground tracks following the trajectory of the ISS. In addition to full waveform data and waveform relative height (RH) metrics, GEDI data products include footprint level estimates of AGBD (the GEDI L4A product; Dubayah et al 2022b).
GEDI predicts footprint AGBD using ordinary least squares regression models with 1–4 predictor variables derived from RH metrics (Duncanson et al 2022, Kellner et al 2022). The models applied to on-orbit GEDI data were developed using a comprehensive training data set of plot-based estimates of AGBD and simulated GEDI waveforms, derived from airborne lidar (Hancock et al 2019, Duncanson et al 2022, Kellner et al 2022). This dataset was contributed by a large community of researchers and encompasses 21 countries on 6 continents, resulting in 13 linear models used in 32 combinations of plant functional type and geographic world region (Duncanson et al 2022, Kellner et al 2022). Further details on the training datasets are provided in Duncanson et al (2022). An important feature of this dataset is that simulated waveform data were acquired under leaf-on conditions for ecosystems with seasonal deciduousness.
Changes in leaf phenology affect GEDI waveform data because canopy cover decreases during leaf-off conditions, which will result in more total energy in GEDI waveform ground returns and a reduction in the height of RH metrics (figure 1). Consequently, AGBD predictions may differ between leaf-off and leaf-on data. GEDI footprint AGBD models are not intended to be applied to leaf-off GEDI data because leaf-off conditions are not represented in the model training data. To avoid generating predictions under leaf-off conditions, GEDI uses the 1 km Visible Infrared Imaging Radiometer Suite (VIIRS) land surface phenology product generated from daily 22-band imagery (Zhang et al 2018) to flag leaf-off measurements in deciduous forests (Kellner et al 2022). These leaf-off measurements are then excluded when generating gridded estimates of AGBD (the GEDI Level 4B AGBD product) in deciduous broadleaf and deciduous needleleaf strata (Healey et al 2022, Dubayah et al 2022a).
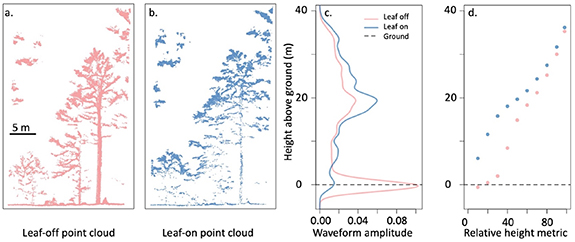
Figure 1. High-density drone lidar in a temperate mountain forest in DBT × Europe. Point clouds (a,b) show a transect ∼1 m in depth through an area the size of a single GEDI footprint. Point clouds are from the same location observed 51 d apart under leaf-off (a) and leaf-on (b) conditions. The presence of leaves reduces penetration of laser energy into the canopy. The associated simulated GEDI waveform (c) and relative height (RH) metrics (d) are shown for this location for each leaf phenology condition.
Download figure:
Standard image High-resolution imageA consequence of excluding leaf-off GEDI measurements from gridded estimates of AGBD is a loss of data in deciduous prediction strata. For example, Kellner et al (2022) documented that 55% of the observations in global deciduous broadleaf strata were acquired under leaf-off conditions during mission weeks 17–153 (April, 2019—November, 2021). GEDI is fundamentally a sampling mission that will result in approximately 4% of the Earth's surface being directly overlaid by a GEDI footprint at the end of the original planned mission (the exact coverage depends on mission length and orbital resonance). Data losses due to leaf phenology filtering reduce the number of ground tracks and observations available to estimate gridded AGBD, limiting the number of 1 km cells with valid AGBD estimates, and increasing the sampling component of the standard error of cells with AGBD estimates (Ståhl et al 2016, Patterson et al 2019).
Leaf-off reductions in canopy cover are expected to decrease RH metric height, but the magnitude of this phenomenon has not been directly tested using GEDI data. Consequently, we do not know the extent to which different RH metrics are affected by changes in leaf phenology, or the degree of associated bias in AGBD predictions from multi-variable, nonlinear candidate AGBD models. Characterizing the effects of leaf phenology on GEDI RH metrics and footprint AGBD estimates is an important first step towards assessing the potential use of GEDI leaf-off data for AGBD estimation. If leaf-off data could be incorporated in AGBD estimates, the sampling component of GEDI AGBD uncertainty could be reduced.
Previous research comparing leaf-off and leaf-on lidar data has shown that discrete-return lidar data collected under leaf-off or leaf-on conditions can each be used, separately, to predict AGBD (Næsset 2005, Villikka et al 2012, Anderson and Bolstad 2013, Bouvier et al 2015, White et al 2015, Krůček et al 2020). Whether models perform best when trained and tested on leaf-off or leaf-on data, separately, depends on forest type, but absolute differences in the predictive power of the best leaf-off vs. leaf-on model were generally small for a suite of candidate models including: height percentiles; minimum, maximum, and mean canopy height; and metrics related to structural variability (Anderson and Bolstad 2013, Bouvier et al 2015). Fewer studies have examined whether models trained under one set of conditions can generalize to the other, but one study found that estimating biomass from leaf-off data using a model trained on leaf-on data (again using a suite of lidar metrics including height percentiles, cover metrics, and metrics related to variability) increased model error (root mean square error, RMSE) by 33% for AGBD compared to the original leaf-on data accuracy, and increased bias by 2.2% (White et al 2015).
Here, we quantify the impact of leaf-off conditions on predictions of AGBD using simulated GEDI waveforms in a temperate mountain forest in the southwest Czech Republic. Our analysis is based on simulated waveform data derived from two high-density drone lidar datasets collected 51 d apart under leaf-off and leaf-on conditions. These measurements isolate the influence of leaf phenology with little to no change in woody structure, allowing us to quantify the systematic prediction difference associated with the application of candidate GEDI models developed under leaf-on conditions to leaf-off data.
2. Methods
2.1. Study site and inventory data
We performed this study in a deciduous broadleaf forest in the southern Czech Republic (Kellner et al 2019). The site contains the Zofin Forest Dynamics Plot, which is a 25-ha permanent-inventory plot in which all free-standing woody plants >1 cm diameter at breast height (DBH) have been mapped and monitored since 2012 (Janík et al 2016, Davies et al 2021). This forest is dominated by old-growth European beech (Fagus sylvatica, 78% of basal area), Norway spruce (Picea abies, 17%), and silver fir (Abies alba, 4.5%) with occasional other broadleaf tree species (Janík et al 2016, Krůček et al 2020).
Aboveground biomass of each tree was estimated using the models of Forrester et al (2017) applied to the 2017 plot census. These equations are species-specific for the three most common species. For all other species, we used the generalized broadleaf equation of Forrester et al (2017). The allometric models of Forrester et al (2017) were used to develop the GEDI04_A AGBD data product in Europe (Duncanson et al 2022, Kellner et al 2022).
2.2. High-density airborne lidar under leaf-off and leaf-on conditions
Airborne lidar data were collected in two sets of orthogonal flight lines using a heavy-lift helicopter drone (Scout B1-100; Aeroscout GmbH, Lucerne-Horw, Switzerland) carrying a RIEGL VUX-1 laser scanner (RIEGL Laser Measurement Systems GmbH, Horn, Austria) coupled to an Oxford Technical Solutions Survey +2 GPS-IMU (Oxford Technical Solutions Ltd, Oxfordshire, United Kingdom). Additional technical details about the drone platform and payload are provided in (Kellner et al 2019). Flights were repeated on two dates that were 51 d apart—the first flights began on 16 April 2018, and the second flights started on 6 June 2018, at the beginning of full leaf-on conditions for this site. These dates captured leaf-off and leaf-on conditions with little to no change in woody structure (figure 1). The April campaign was completed in six flights over two consecutive days. The June campaign required six flights over three consecutive days. The total flight time for each campaign was about 5 h. For each campaign there were 45 flight lines in the NW-SE direction, and 45 flight lines in the NE-SW direction. Flight altitude was 110 m aboveground, and the nominal flight speed was 6 m s−1. During the autonomous portion of the flight, the flight-control system maintained stable control of the aircraft and sensors. For example, during a representative flight line, the realized speed was 6 m s−1 (SD = 0.06). The standard deviation in the pitch, roll, and heading axes was 0.3°, 0.6°, and 0.8°, respectively. The total areas covered were 1.72 and 1.60 km2, respectively, and mean point density was 5189 pts m−2 under leaf-off conditions and 3165 pts m−2 under leaf-on conditions. All data were post-processed and differentially corrected using a NovAtel FlexPak6 GPS receiver (NovAtel Inc., Calgary, Canada). A previous analysis demonstrated that the post-processed range accuracy was 2.4 cm (estimated accuracy in measured distance between the lidar sensor and reflecting targets), and the single-date precision was 2.1–4.5 cm (estimated from variation in return height on a uniform target; Kellner et al 2019).
2.3. GEDI waveform simulation
We used the GEDI waveform simulator to produce simulated waveforms from discrete-return airborne lidar under leaf-off and leaf-on conditions (Blair and Hofton 1999, Hancock et al 2019, Cushman 2023). Because GEDI04_A AGBD models (hereafter AGBD models) have been developed using simulated waveforms (Duncanson et al 2022, Kellner et al 2022), the simulator allows us to evaluate the impact of leaf-off and leaf-on conditions on waveform relative-height (RH) metrics, and the consequences of variation in simulated RH metrics on candidate AGBD models that contain different RH metrics. For example, low-valued RH metrics may be more sensitive to changes in leaf phenology than RH98, an index of maximum canopy height (figure 1).
Simulated waveform centers were placed on a 20 × 20 m grid within the 25 ha plot, for a total of 570 simulated waveforms. We used exactly the same waveform centers to produce simulated waveforms under leaf-off and subsequent leaf-on conditions. High scan angle data for low altitude airborne lidar can have a higher contribution of data from the sides of trunks and branches compared to actual GEDI data, so we retained points with scan angles <6° (GEDI's maximum angle of incidence) for waveform simulation and excluded points collected from scan angles ⩾6° (Hancock et al 2019). Mean point densities for points <6° within simulated waveforms were 1753 and 1304 pts m−2 under leaf-off and leaf-on conditions, respectively (range = 543–2,981 and 850–1,643 pts m−2 for leaf-off and leaf-on conditions, respectively) which exceeds the minimum point density recommendation in Hancock et al (2019). Waveforms were simulated using 15.6 ns full width half maximum (FWHM) and 22 m footprint diameter. RH metrics were computed relative to the center-of-gravity of the ground waveform (Hancock et al 2019).
2.4. Waveform sensitivity to leaf phenology
We evaluated the sensitivity of simulated waveforms to leaf phenology by comparing simulated canopy cover and RH metrics between leaf-off and leaf-on conditions. To determine whether canopy cover and RH metrics changed between leaf-off and leaf-on conditions, we used a paired Wilcoxon test. We also calculated the effect size (Cohen's d) associated with leaf-area changes on each RH metric (e.g. the change in RH50 under leaf-off and leaf-on conditions). Following the approach developed by the GEDI Science Team to predict AGBD, we considered RH metrics from RH10—RH90 in increments of 10% in addition to RH98 (Duncanson et al 2022, Kellner et al 2022).
2.5. Impact of leaf phenology on GEDI AGBD predictions
We quantified the impact of leaf-area changes on AGBD predictions using candidate AGBD models described in Duncanson et al (2022), including the currently selected model for the deciduous broadleaf trees (DBT) prediction stratum in Europe. AGBD models are ordinary least squares regressions with 1–4 predictor variables, where potential predictor variables are simulated RH metrics RH10—RH90 in increments of 10%, RH98, and products between pairs of RH metrics. Each model uses one of four transformation scenarios: either a natural logarithm or square-root on the response variable, and either the same or no transformation on the predictors. There were four feature sets under consideration for each transformation scenario. These were: (1) all RH metrics were permitted in candidate models; (2) no RH metrics < RH50 were permitted in models; (3) models were forced to contain RH98; and (4) no RH metrics < RH50 were permitted in models and models were forced to contain RH98. The performance of thousands of candidate models was ranked for each transformation scenario and feature set combination in order of smallest mean residual error, smallest percentage RMSE rounded down to the nearest 5%, the maximum RH metric in the model, the number of coefficients in the model, and the number of RH metrics in the model (Duncanson et al 2022). We examined the top 20 models under each feature set scenario (i.e. 80 candidate models).
All candidate AGBD models were developed by the GEDI Science Team using simulated GEDI waveforms under leaf-on conditions (Duncanson et al 2022, Kellner et al 2022). Examining the difference in predicted AGBD by applying the coefficients from these models to simulated waveforms collected under leaf-off and leaf-on conditions provides an estimate of the magnitude of systematic prediction difference due exclusively to changes in leaf phenology. Systematic prediction difference for candidate model j averaged across n = 570 waveforms was computed according to:
Here,  is the back-transformed and bias corrected AGBD for footprint i under candidate model j under leaf-on conditions, and
  is the corresponding value for footprint i, candidate model j under leaf-off conditions. Candidate AGBD models use the Snowdon (1991) or Baskerville (1972) back-transformation and bias corrections (Kellner et al
2022). We also calculated the change in RMSE associated with the change in leaf phenology:
is the corresponding value for footprint i, candidate model j under leaf-off conditions. Candidate AGBD models use the Snowdon (1991) or Baskerville (1972) back-transformation and bias corrections (Kellner et al
2022). We also calculated the change in RMSE associated with the change in leaf phenology:

where  and
and  are RMSE during leaf-off and leaf-on conditions, respectively, expressed as a percentage of the mean AGBD for this site. RMSE was calculated using footprint-level AGBD estimates from inventory plot data.
3. Results
Measurements of vertical forest structure from high-density drone lidar were sensitive to changes in leaf phenology (figures 1 and 3). The presence of leaves increased mean canopy cover by an average of 31% (standard deviation = 8%), from 57% to 88%, reducing penetration into the canopy (figure 2). For example, the density of ground returns under leaf-on conditions was 102 pts m−2. This is an 87% reduction in the frequency of ground returns compared to leaf-off conditions (759 pts m−2).
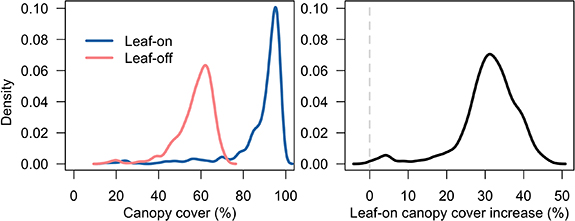
Figure 2. Distributions of canopy cover (a) and increase in canopy cover from leaf-off to leaf-on data (b) for 570 simulated GEDI waveforms collected 51 d apart in a temperate mountain forest in the southwest Czech Republic. Density values represent the relative frequency of cover values among waveforms.
Download figure:
Standard image High-resolution image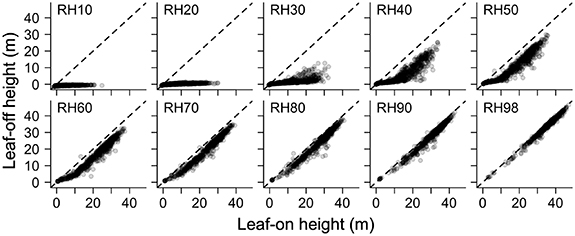
Figure 3. Low-valued simulated GEDI waveform RH metrics change between leaf-off and leaf-on conditions. The data are from 570 simulated GEDI waveforms collected 51 d apart in a temperate mountain forest in the southwest Czech Republic. These simulated waveforms are in the DBT × Europe prediction stratum.
Download figure:
Standard image High-resolution imageAll simulated waveform metrics changed significantly between leaf-off and leaf-on conditions (figure 3, table 1). RH metrics < RH50 were more sensitive to changes in leaf phenology than upper-canopy RH metrics. For RH30 and above, the effect size of leaf-area changes decreased with increasing RH values (table 1). During leaf-off conditions RH10–RH30 were close to 0 m in height (and therefore contained within the ground-return portion of the simulated waveform) with little variation, but during leaf-on conditions RH10–RH30 were larger and more variable (figure 3).
Table 1. Sensitivity of RH metrics to changes in leaf phenology. Data are from simulated GEDI waveforms in a temperate mountain forest in the DBT × Europe prediction stratum. Statistics are for footprint-to-footprint differences in RH metrics between leaf-off and leaf-on conditions 51 d apart. All tests were significant (P < 0.001).
| Metric | Difference between leaf-off and leaf-on height | |
|---|---|---|
| Paired Wilcoxon V | Cohen's d | |
| RH10 | 162 723 | 1.69 |
| RH20 | 161 561 | 1.92 |
| RH30 | 162 730 | 1.93 |
| RH40 | 162 140 | 1.25 |
| RH50 | 162 122 | 0.85 |
| RH60 | 162 122 | 0.61 |
| RH70 | 162 701 | 0.48 |
| RH80 | 162 169 | 0.39 |
| RH90 | 161 855 | 0.31 |
| RH98 | 162 477 | 0.21 |
Candidate AGBD models developed using leaf-on data were sensitive to changes in leaf phenology. As expected, systematic prediction difference (i.e. the % change in estimated AGBD; equation (1) was negative for all candidate models, indicating that predicted AGBD is smaller in leaf-off conditions in comparison to the leaf-on conditions used for model development (equation (1)). The magnitude of systematic prediction difference ranged from 0.6 to 19.0% among candidate models (figure 4; table 2). Distributions of predicted AGBD values are shown in figure S1.
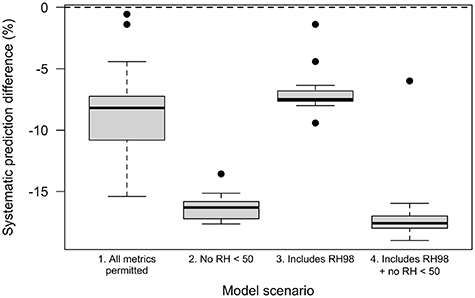
Figure 4. Systematic differences in predicted AGBD caused by changes in leaf phenology (equation (1)) among 20 candidate AGBD models in the DBT × Europe prediction stratum for each of four feature-set scenarios (table S2). AGBD was predicted using simulated GEDI waveform RH metrics. Here, boxes denote the first and third quantiles, solid lines indicate the median value, and whiskers indicate the data point furthest from the mean and less than 1.5 times the interquartile range; other outliers are included as solid points.
Download figure:
Standard image High-resolution imageTable 2. Systematic differences in predicted AGBD (Mg ha−1) due to leaf-off conditions for candidate GEDI AGBD models in the DBT × Europe prediction stratum. The five models with the smallest systematic prediction difference (equation (1)) are shown for each of four feature sets. Data are from simulated GEDI waveforms in a temperate mountain forest in the southwest Czech Republic. Summaries from the top 20 models under each feature set are in table S2). The model being used to predict AGBD in release 1 and release 2 of the GEDI04_A data product is in bold. Note that the model coefficients are rounded in this table, a constant value of 100 is added to RH metric values before model application, and a back transformation is also applied to estimate AGBD using models. Correction application is demonstrated in the supplemental code.
| Rank | Model | Systematic prediction difference (%) |
|---|---|---|
| Feature set 1: all RH metrics permitted | ||
| 1 | log(AGBD) = −2.21 × 101–3.22 × log(RH10) + 2.11 × log(RH20)–2.00 × log(RH40 × RH50) + 5.34 × log(RH60 × RH98) | −0.56 |
| 2 | log(AGBD) = −2.48 × 101 + 2.86 × log(RH40) + 6.75 × log(RH98)–1.73 × log(RH10 × RH30) | −1.39 |
| 3 | log(AGBD) = −5.57 × 10⁻²–1.89 × 10⁻² × RH10 + 4.71 × 10⁻² × RH98 + 8.62 × 10⁻⁵ × RH60 × RH70 | −4.41 |
| 4 | log(AGBD) = 6.01–8.09 × 10⁻² × RH10 + 4.87 × 10⁻⁴ × RH10× RH98 + 8.15 × 10⁻⁵ × RH60 × RH70 | −7.09 |
| 5 | log(AGBD) = − 2.61 + 7.26 × 10⁻² × RH98 + 6.82 × 10⁻⁵ × RH10× RH50–2.65 × 10⁻⁴ × RH10 × RH98 + 9.03 × 10⁻⁵ × RH20 × RH98 | −7.22 |
| Feature set 2: no RH metrics < 50 permitted | ||
| 1 | sqrt(AGBD) = −4.08 × 101 + 4.53 × 10⁻¹ × sqrt(RH80 × RH90) | −13.57 |
| 2 | sqrt(AGBD) = −9.49 × 101–2.02 × 10⁻¹ × sqrt(RH50) + 1.02 × 101 × sqrt(RH80) | −15.15 |
| 3 | sqrt(AGBD) = −3.97 × 101–3.25 × 10⁻¹ × sqrt(RH50) + 4.77 × 10⁻¹ × sqrt(RH70 × RH90) | −15.50 |
| 4 | sqrt(AGBD) = −9.53 × 101 + 9.99 × sqrt(RH80) | −15.59 |
| 5 | sqrt(AGBD) = −3.28 × 101–1.47 × sqrt(RH50) + 5.25 × 10⁻¹ × sqrt(RH70 × RH80) | −15.71 |
| Feature set 3: forced inclusion of RH98 | ||
| 1 | log(AGBD) = −2.48 × 101 + 2.86 × log(RH40) + 6.75 × log(RH98)–1.73 × log(RH10 × RH30) | −1.39 |
| 2 | log(AGBD) = −5.57 × 10⁻²–1.89 × 10⁻² × RH10 + 4.71 × 10⁻² × RH98 + 8.62 × 10⁻⁵ × RH60 × RH70 | −4.41 |
| 3 | log(AGBD) = −3.74 + 1.15 × 10⁻² × RH20 + 5.57 × 10⁻³ × RH50 + 7.55 × 10⁻² × RH98–1.94 × 10⁻⁴ × RH10 × RH98 | −6.35 |
| 4 | log(AGBD) = −3.07 + 1.10 × 10⁻² × RH20 + 7.00 × 10⁻² × RH98–1.92 × 10⁻⁴ × RH10 × RH98 + 4.79 × 10⁻⁵ × RH50 × RH98 | −6.77 |
| 5 | log(AGBD) = − 2.55 + 7.17 × 10⁻² × RH98 + 7.58 × 10⁻⁵ × RH10 × RH60–2.72 × 10⁻⁴ × RH10 × RH98 + 9.36 × 10⁻⁵ × RH20 × RH98 | −6.79 |
| Feature set 4: no RH metrics < 50 permitted and forced inclusion of RH98 | ||
| 1 | sqrt(AGBD) = −3.70 × 1001 + 4.09 × 10−01 × RH98 | −5.99 |
| 2 | sqrt(AGBD) = −5.28 × 101 + 2.05 × sqrt(RH98) + 3.70 × 10⁻¹ × sqrt(RH70 × RH80) | −15.97 |
| 3 | sqrt(AGBD) = −9.65 × 101 + 7.18 × sqrt(RH70) + 2.92 × sqrt(RH98) | −16.29 |
| 4 | sqrt(AGBD) = −2.07 × 101 + 1.07 × 10⁻¹ × RH98 + 1.51 × 10⁻³ × RH70 × RH80 | −16.31 |
| 5 | sqrt(AGBD) = −4.18 × 101 + 3.38 × 10⁻¹ × RH70 + 1.28 × 10⁻¹ × RH98 | −16.83 |
We considered 20 candidate models originally described by Duncanson et al (2022) under each of four feature-set scenarios. The feature set scenarios were (1) all RH metrics were permitted in candidate models; (2) no RH metrics < RH50 were permitted in models; (3) models were forced to contain RH98; and (4) no RH metrics < RH50 were permitted in models and models were forced to contain RH98 (figure 4). A one-way ANOVA indicated that systematic prediction differences varied significantly among feature sets (F = 85.5; DF = 3; P < 0.001, R2 = 0.76). A Tukey's post-hoc multiple comparison test showed that feature sets that contained RH metrics < RH50 had smaller systematic differences in predicted AGBD across leaf phenology conditions than feature sets that excluded RH metrics <50 (table S1). All candidate models with systematic prediction difference <5% included both the lowest (RH10) and the highest (RH98) RH metrics (table 2). The two models with the smallest systematic prediction difference included logarithmic transformations of AGBD and RH metrics–these two models had prediction difference <2%, whereas all other models had prediction difference >4% (table 2). There was no clear pattern of reduced systematic prediction difference when RH metrics appeared either alone or as products—the best model included RH10 in isolation and RH98 in a product (e.g. RH60 × RH98) while the second-best model included RH98 in isolation and RH10 in a product (RH10 × RH30; table 2).
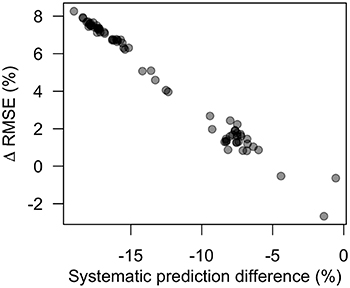
There was a strong correlation between systematic prediction difference and ΔRMSE (figure 5), where ΔRMSE was calculated from field-estimated footprint-level AGBD (equation (2)). Models with larger magnitude in systematic prediction difference also had larger increases in RMSE in leaf-off conditions compared to leaf-on conditions (Pearson correlation r = −0.99, P < 0.001), increasing overall model RMSE by up to >8%. Models with the lowest systematic prediction difference had similar RMSE in both leaf phenology conditions.
Figure 5. Relationship between systematic differences in predicted AGBD (equation (1)) and model ΔRMSE (equation (2)) due to changes in leaf phenology for 80 candidate AGBD models for the DBT × Europe prediction stratum. Positive ΔRMSE indicates higher RMSE in leaf-off conditions compared to leaf-on conditions. AGBD was predicted using simulated GEDI waveform RH metrics.
Download figure:
Standard image High-resolution image
4. Discussion
Our analysis demonstrates that changes in leaf phenology impact the vertical distribution of lidar data, with potential consequences for the estimation of AGBD. Using simulated GEDI waveforms, our results confirmed expectations that leaf-off conditions reduce canopy cover (figure 2), resulting in lower RH metric values (figure 3). Consequently, we found that predicted AGBD is systematically smaller when candidate GEDI AGBD models—developed using simulated waveforms under leaf-on conditions—were applied to waveforms simulated using leaf-off data (figure 4). Our novel dataset allowed us to quantitatively describe effects on predicted AGBD among models that can include nonlinear and interactive predictor variables. The magnitude of this systematic prediction difference data varied widely among candidate models, from <1% to almost 20%. Models with greater systematic prediction difference also had greater increases in RMSE for leaf-off AGBD predictions when compared to field-estimated AGBD (figure 5), indicating that systematic prediction difference is associated with lower model accuracy, specifically an underestimation of AGBD (figure S1). Here, we discuss the causes of this variation, and how model selection can minimize systematic prediction difference in AGBD estimates from changes in leaf phenology in on-orbit GEDI data.
The presence of leaves increases canopy cover, causing less lidar signal energy to be reflected from the ground under leaf-on conditions. All RH metrics were smaller during leaf-off conditions, as expected, and the magnitude of this change varied greatly among metrics—the effect size for RH98 was nearly an order of magnitude less than lower-canopy metrics of RH20 and RH30 (figure 3, table 1). Larger changes in smaller RH metrics are expected in high canopy cover forests like Zofin because the sensitivity of RH metrics to changes in waveform energy is inversely proportional to waveform intensity near the RH metric height, and waveform intensity is relatively smaller for smaller RH metrics in leaf-on high canopy cover forests (Hancock et al 2019). Surprisingly, although lower-canopy RH metrics were most affected by changes in leaf phenology, the exclusion of metrics < RH50 increased systematic prediction differences among candidate AGBD models, with or without the forced inclusion of RH98 (figure 4; table S2). This seemingly contradictory result is possible because some candidate GEDI AGBD models with RH metrics < RH50 had both negative and positive coefficients (table 2). Because all RH metrics were systematically smaller in leaf-off conditions, the combination of both positive and negative model coefficients allows some of the systematic difference in RH metrics to effectively 'cancel out', reducing the magnitude of the overall systematic difference in predicted AGBD. The only model with systematic prediction difference <6% that did not contain a combination of positive and negative coefficients contained only a single predictor, RH98, the metric that changed least between leaf-off and leaf-on conditions (tables 1 and 2). Further, all models with systematic prediction difference <6% contained RH98 as a predictor.
Systematic differences in AGBD predictions from leaf phenological changes could be reduced by considering land surface phenology at the time GEDI data are acquired. The GEDI04_A data product contains flags derived from the VIIRS global land surface phenology product that indicate whether the GEDI footprint was collected after the onset of maximum greenness and before the midpoint of the senescence phase at the resolution of the VIIRS 1 km grid (Kellner et al 2022). Although this characterization will correctly identify leaf-off conditions in northern-hemisphere deciduous forests, and some tropical dry forests that experience total leaf loss during dry-seasons, it may not detect crown-scale deciduousness that is common in some evergreen broadleaf forests. Consideration of leaf phenology effects on GEDI lidar data and derived products in other ecosystem types warrants further consideration. Forests do not exist in binary leaf-off or leaf-on states—rather, the degree and timing of deciduousness varies among individuals and species (Condit et al 2000, Augspurger and Bartlett 2003, Smith et al 2019). For example, one study in Panama documented up to 19.1% leafless crown area in a moist tropical forest canopy (Condit et al 2000). In that community the crown area of individual trees can reach up to 0.1 ha in size, roughly twice the area of a single GEDI footprint (Martínez Cano et al 2019). Additionally, total leaf area has been shown to vary seasonally across the Amazon basin by 5%–10%, with asynchronous patterns in the canopy and understory that can complicate expected effects on predicted AGBD (Tang and Dubayah 2017). However, in some tropical forests community-level leaf phenology is more stable than individual-level patterns due to asynchronous phenology among species (Wirth et al 2001); if community-level phenology is sampled representatively in training data then individual variance is subsumed in AGBD model parameter covariance matrix. Other high-resolution gridded data products could help to identify leaf-off conditions at the scale of individual GEDI footprints, and/or resolve forest classification errors and resolution differences among current auxiliary products (Bolton et al 2020, Moon et al 2021). Modeled error can also address systematic biases and be propagated in AGBD prediction (Tang et al 2021).
Our analysis used simulated GEDI waveform data and focused on quantifying the impact of extreme changes in leaf phenology on AGBD prediction. We acknowledge that other sources of error are also important for understanding overall accuracy in AGBD predictions, including ground-finding error associated with GEDI waveform processing and allometric model error, among others. By using simulated waveforms derived from drone lidar collected 51 d apart, our analysis isolated the impact of leaf phenological changes on simulated GEDI AGBD at a single forest site in the absence of changes in woody vegetation structure. We believe that our study defines an upper limit on systematic prediction differences associated with leaf phenological changes in deciduous broadleaf forests of Europe. For example, changes in leaf area that are smaller than the range examined here occur throughout leaf-on conditions during the growing season, i.e. changing in leaf area during the growing season are expected to produce smaller changes in RH metrics than changes between the growing and post-senescence period.
5. Conclusions
In this paper we demonstrated the quantitative sensitivity of applying GEDI AGBD models to leaf-off data in a deciduous old growth forest in Europe, and shows that there is an associated 1%–20% underestimation when using this data for AGBD estimation compared to using only leaf-on data. Therefore, for the majority of current applications utilizing GEDI lidar for AGBD mapping, we confirm that caution must be taken when using leaf-off data. The currently GEDI L4A product does not include leaf-off data in its predictions, largely due to the theoretical bias that our paper quantitatively demonstrates.
We found that some AGBD models are more transferable to leaf-off conditions than others, and while they all produced increases in RMSE and AGBD underestimation, there may be conditions when it is highly desirable to use leaf-off data from GEDI (e.g. if those are the only data available over a study site, or the sample size would increase sufficiently to justify a slight bias in AGBD). In these cases, our paper can inform adoption of minimally biased AGBD models for application to leaf-off conditions. For our study area, models that included RH98 had the lowest systematic differences in predicted AGBD, and indeed RH98 was included in all models that yielded <6% systematic prediction difference. This supports the expectation that maximum height should be the least sensitive to leaf phenology in comparison to any lower RH metric. Additionally, multivariate models including both positive and negative model coefficients had the lowest systematic prediction differences, due to the effect of systematically smaller RH metrics partially compensating among predictor variables.
Further research into the potential utility of leaf-off data for GEDI AGBD estimation should be conducted, potentially taking advantage of other datasets where direct comparisons between leaf-on and leaf-off conditions can be made. These results are from a single data-rich study site, and therefore may not generalize to other deciduous ecosystems. GEDI to GEDI crossovers may be one such dataset that can expand the analysis presented here for a global-scale analysis of the impact of leaf area phenology on AGBD mapping. This may be particularly important for areas where relatively limited leaf-on data area available, e.g. due to persistent cloud-cover during the growing season. The potential use of leaf-off data could increase the sample size of GEDI AGBD estimates, reducing overall uncertainty in the spatial distribution of global AGBD.
Acknowledgments
This work was independently supported by Brown University and by NASA contracts to the University of Maryland and Brown. We are grateful to the NASA Terrestrial Ecology Program and to Hank Margolis and Michael Falkowski. We thank our colleagues on the GEDI Mission Science Team, including research technicians and graduate students whose work directly supported the mission. We thank Markus Birrer, Christoph Eck, Cristoph Falleger, Benedikt Imbach, Henry Johnson, Peggy and Henry D Sharpe Jr, Jan Trochta, Peter S Voss, Tomáˇs Vrˇska, and Carlo Zgraggen. K K, M K, and D J were supported by Inter- Action Grant LTAUSA18200.
Data availability statement
The data that support the findings of this study are openly available at the following URL/DOI: https://doi.org/10.7910/DVN/TB13RI.
Supplementary data (0.7 MB PDF)