
Abstract
The physical hydroclimate system of the Amazon functions on several spatial and temporal scales. Large-scale processes control the main seasonal patterns of atmospheric circulation and rainfall. Seasonal variability in solar forcing, associated with the low rainforest albedo, provides energy for continental heating, convection, and the onset of the South American monsoon. Mesoscale processes cause localized circulations such as river breeze and deforestation breeze. We assessed the impact of different deforestation scenarios for the mid-century last decade rainy season. Here we describe a yet unreported synoptic-scale circulation that delays the rainy season onset in southern Amazonia. This model-predicted circulation is driven by extensive (ca. 40%) deforestation patterns and may last as long as two months. This persistent anomalous circulation may result in a rainy season onset delay of 30–40 d compared to the historical period. Like other synoptic-scale phenomena, differences in surface heating drive this circulation. Given the unabated deforestation trends, the consequences for local ecosystems, agriculture, and power generation of delayed rainy season onset associated with this circulation may be difficult to revert.
Export citation and abstract BibTeX RIS

Original content from this work may be used under the terms of the Creative Commons Attribution 4.0 license. Any further distribution of this work must maintain attribution to the author(s) and the title of the work, journal citation and DOI.
1. Introduction
The seasonal behavior of the Amazon's hydroclimate is related to large-scale mechanisms such as the Intertropical Convergence Zone and the South American Monsoon System, which cause most of the region's rain to fall during summer (Wright et al 2017, Mu and Jones 2022, Sierra et al 2022, Talamoni et al 2022). In addition, the South Atlantic Convergence Zone is a monsoon trough convergence band oriented in the northwest–southeast direction and ranging from the Amazon basin to the tropical South Atlantic (Sierra et al 2022, Talamoni et al 2022). Moreover, the El Niño–Southern Oscillation controls the main interannual hydroclimate variability in Amazon (Marengo et al 2021, Espinoza et al 2022) and has contributed to severe droughts in the basin recently (Marengo et al 2021, Mu and Jones 2022).
Northwestward of an SW–NE diagonal ranging from 16° S, 60° W to 4° S, 45° W, the Amazon climate is humid, with either no dry season or just a less rainy season (Koppen's Af and Am) (Alvares et al 2013). As this diagonal is crossed, in southern Amazonia (SA), the climate transitions from humid to seasonal (Koppen's Aw). The onset of the rainy season in SA is related to large-scale mechanisms and heterogeneous solar heating promoting convection in the region (Leite‐Filho et al 2020, Espinoza et al 2022). The heating promotes evapotranspiration, increasing atmospheric moisture and preconditioning the regional convection for the rainy season onset (Wright et al 2017, Talamoni et al 2022).
In the last few decades, the rainy season onset in SA has been delayed (Fu et al 2013, Leite‐Filho et al 2020). This behavior relates to changes in atmospheric circulation, regional convective energy (Wright et al 2017, Talamoni et al 2022), and land-use change by deforestation (Leite‐Filho et al 2020, Staal et al 2020). Specifically, deforestation can change the surface energy balance and surface roughness, creating feedbacks that reduces rainfall and delays the rainy season onset (Stickler et al 2013, Lawrence and Vandecar 2015, Khanna et al 2017, Staal et al 2020, Caballero et al 2022, Mu and Jones 2022).
Early studies that analyzed the effects of complete Amazon deforestation on climate simulated a reduction in the evapotranspiration and precipitation proportional to the increase in the land surface albedo, which would impact the surface energy fluxes (latent and sensible heat) (Shukla et al 1990, Dirmeyer and Shukla 1994, Eltahir and Bras 1996, Costa and Foley 2000, Sampaio et al 2007). In the simulations, these energy fluxes promoted a change in the monsoon circulation, impacting the rainfall volume and rainy season timing due to anomalous subsidence over the region.
However, current deforestation patterns are fragmented and on the scale of a few tens of kilometers. Mesoscale forest clearing creates a thermally driven mesoscale (10–100 km) circulation called the deforestation breeze (Saad et al 2010, Lawrence and Vandecar 2015, Fassoni‐Andrade et al 2021). This circulation may promote subsidence, diminishing rainfall upwind of the deforested areas (Saad et al 2010, Khanna et al 2017).
Analyses of intermediate-scale deforestation scenarios in the last two decades have associated deforestation with rainfall decrease (Costa et al 2007, Sampaio et al 2007, Pires and Costa 2013, Spracklen and Garcia-Carreras 2015), but the coarse-resolution models (∼300 km) used in these analyses might not have correctly represented the circulation dynamics between the mesoscale and the large-scale processes. Those models' resolutions might also have affected land–atmosphere interactions since there is an apparent relationship between the deforestation scale and rainfall impact (Spracklen and Garcia-Carreras 2015, Leite-Filho et al 2021, Caballero et al 2022, Mu and Jones 2022, Smith et al 2023).
Here we use a fine-resolution (0.9° × 1.25°) coupled climate system model to investigate the effects of realistic deforestation scenarios on the Amazon's climate and increasing atmospheric CO2 concentrations. While we follow the representative concentration pathways (RCPs) of the Coupled Model Intercomparison Project Phase 5 (CMIP5), we consider their land-use scenarios too optimistic for Amazonia. RCP8.5 assumed Amazon deforestation of 20% by 2050 (Pires et al 2016), which is close to estimates of the current (2020) levels of Amazon deforestation (∼838 000 km2) (Souza et al 2020). Instead of using the default CMIP5 scenarios, we used two realistic deforestation pathways that emerged from different environmental policy scenarios (Rochedo et al 2018). The strong environmental governance (SEG) scenario enhances forest legislation and conservation, while the weak environmental governance (WEG) scenario renounces deforestation control and reinforces predatory practices (Rochedo et al 2018, Leite-Filho et al 2021). In the SEG pathway, the deforested area will be ∼23% in 2050, while with WEG, deforestation could reach ∼1700 000 km2 (∼40%) by the same time (Rochedo et al 2018).
2. Methods
2.1. Climate simulations
We used the Community Earth System Model version 1.0.6 (CESM) (Hurrell et al 2013). CESM is a fully coupled model capable of simulating interactions between the different components of the climate system, such as the atmosphere, oceans, cryosphere, and land surface (Hurrell et al 2013, Sampaio et al 2021). We arranged the simulations to reproduce the original RCP2.6 and RCP8.5 CMIP5 simulations with coupled atmosphere, ocean, sea, and ice, except for the land-use patterns inside Brazil, where the original RCP land-use patterns were replaced by those of two locally informed environmental governance (EG) scenarios (see below).
The Community Land Model version 4 (CLM) is the component that represents surface processes in CESM (Hurrell et al 2013). It represents the transient land-cover change between the fractions of 15 plant functional types (PFTs), each with its own set of physiological parameters and RCP's emissions effects on it.
Four initializations were performed for each scenario, with initial historical conditions taken from four ensemble members of the historical experiment with the original CCSM4 (Community Climate System Model version 4, former name of CESM) for the year 2005, thus replicating the original initial conditions of the scenarios present in the RCP simulations from CMIP5.
2.2. EG scenarios
Inside Brazil, land-use patterns for CLM were taken from two scenarios representing land-use futures under two levels of EG: WEG and SEG. Both EG scenarios considered the trajectory of Brazilian environmental policy, land use, and occupation in recent years (Rochedo et al 2018).
The WEG scenario represents the worst possible case for the environment, indicating policies to support the development of agriculture with zero sustainability. WEG was designed to replicate the deforestation trends of the pre-2005 period when the EG of the Amazon and Cerrado was at its lowest. The SEG scenario assumes that environmental policies will be enforced and have government support, with conservationist practices and economic incentives for preservation, replicating deforestation rates from the 2005–2012 period when EG was substantially reinforced (Rochedo et al 2018).
The EG scenarios consist of yearly land-cover information on a 25 ha grid discriminated into 31 classes. These were reclassified into crops, pasture, natural vegetation, and planted forest, and then further reclassified into CLM's 15 PFTs (table S1). Natural vegetation was mapped to a combination of PFTs with the same fraction as those in the primary vegetation maps from Ramankutty and Foley (1999). For a more detailed description of the mappings, refer to Oleson et al (2010).
2.3. Anomalies for the decade 2040–2050
We ran the simulations for 2012–2050 for four scenarios that combined climate forcings and EGs: RCP2.6-WEG, RCP2.6-SEG, RCP8.5-WEG, and RCP8.5-SEG. We calculated anomalies between the EG scenarios (WEG–SEG) to assess their effects on the rainy season onset. The onset is defined as the start of the lengthiest period when rainfall exceeds the established threshold for a specific region (supplementary methods—equation (1)). We calculated monthly averages for zonal, meridional, and vertical wind, rainfall, net radiative flux (Rn), and heat fluxes (latent and sensible) for 2040–2050 for September, October, and November.
3. Results
3.1. Rainfall validation
To assess the model's skill, we compared its rainfall results with an ensemble of observed precipitation data comprising the GPCC, CHIRPS, and PERSIANN-CDR (described in the supplementary methods). The CESM simulations behavior (figures 1(a) and (b)) was similar to the observed data (figures 1(c) and (d)), showing higher precipitation over the northern portion of the Amazon and decreasing the rainfall amount in the southern direction. Most anomalies were between ±2 mm d−1 (figures (e) and (f)), with significant differences in September (figure 1(e)).

Figure 1. Monthly mean precipitation and anomalies for CESM historical period and the observed data (1990–2005). CESM precipitation (a) and (b), average observed precipitation (c) and (d), and precipitation anomalies (e) and (f). Shaded areas indicate differences significant at α = 0.05.
Download figure:
Standard image High-resolution image3.2. Climate response to different EG scenarios
While the SEG deforestation is not much different from 2020 deforestation levels, the WEG pathways promote more extensive and heavier deforestation in SA (figure 2). The difference between the WEG and SEG scenarios is always greater than 5%, but in northern Mato Grosso and along paved roads, the deforestation differences are over 60% (figure 2(g)).
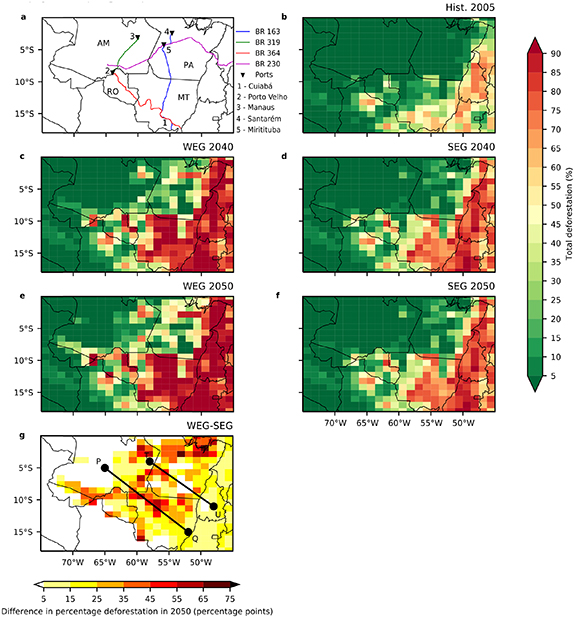
Figure 2. Study area, with main roads, deforestation (historical and scenarios), and scenarios differences. Orientation map (a) with state names (AM—Amazonas, MT—Mato Grosso, PA—Pará, and RO—Rondônia), major cities (numbered), ports (black triangles), and highways (labeled BR). P–Q and T–U indicate two cross-sections for circulation analyses. Total deforestation in 2005 (b), 2040 according to WEG (c) and SEG (d), and 2050 according to WEG (e) and SEG (f) pathways and the difference between them, calculated as WEG–SEG (g).
Download figure:
Standard image High-resolution imageThere was an increase in deforestation for the 2040–2050 decade (figures 2(c)–(f)), especially in the WEG scenario AM, MT, and PA frontiers increased deforestation. What showed a change in the PFTs compositions with an expansion in croplands and pasture.
The differences between deforestation scenarios influence the energy partitioning and distribution over the region, revealing a previously unreported shallow synoptic-scale circulation over SA and Mato Grosso (figure 3). This circulation can be as deep as 600 hPa in September and October (figures 3(a), (b), (e), (f), (i), (j), (m), and (n)) and extends from 1200 to 1500 km (figure 4). We noticed a clearer circulation for RCP2.6 in September (figures 3(a) and (i)), while RCP8.5 presented a later circulation pattern in October (figures 3(f) and (n)), with sharper circulation behavior (figures 3(e), (f), (m), and (n)). This synoptic circulation is absent in November, when the rainy season has already started.

Figure 3. Synoptic-scale circulation and its impacts on precipitation. Zonal winds and vertical velocity anomalies calculated as WEG–SEG over the cross-sections P–Q ((a)–(c), (e)–(g)) and T–U ((i)–(k), (m)–(o)) for September and October (the rainy season onset months) and for November (when the rainy season is already established); red and blue arrows indicate significant differences at α = 0.05 and 0.10, respectively. Total precipitation changes calculated as WEG–SEG over cross-section P–Q for RCP2.6 and RCP8.5 (d) and (h) and cross-section T–U for RCP2.6 and RCP8.5 (l) and (p) that are significant at α = 0.10; values of precipitation not shown are not significant at α = 0.10.
Download figure:
Standard image High-resolution image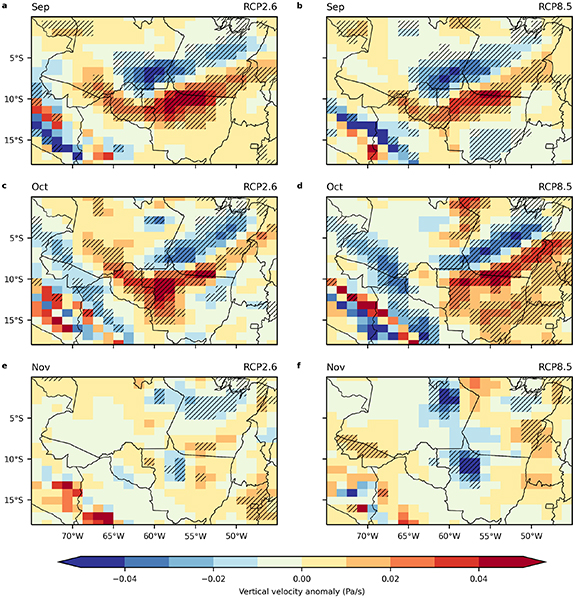
Figure 4. Vertical velocity (omega) anomalies at 850 hPa were calculated as WEG–SEG for RCP2.6 ((a), (c), (e)) and RCP8.5 ((b), (d), (f)). Shaded areas indicate results significant at α = 0.05.
Download figure:
Standard image High-resolution imageRegarding the circulation pattern, we observed a dipole behavior over SA (figure 3) with a subsidence branch over northern Mato Grosso (MT) and an ascending branch over the southern state of Amazonas (figure 4). In RCP8.5, most of Mato Grosso experiences a subsidence anomaly (figure 4(d)). These subsidence regions cause a significant (α = 0.05) delay in the rainy season onset (figure 5).
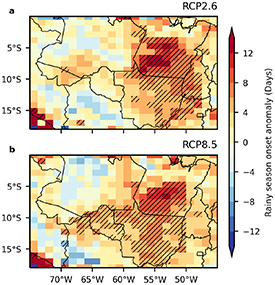
Figure 5. Rainy season onset anomalies, in days, were calculated as WEG–SEG for RCP2.6 (a) and RCP8.5 (b). Shaded areas indicate anomalies significant at α = 0.05.
Download figure:
Standard image High-resolution image
The subsidence occurs mostly over regions with a negative net surface radiative flux (Rn) anomaly (figures S1(a)–(d)), associated with the albedo increase due to deforestation in the region (figure 2(g)). Rn reductions cause reductions in both sensible heat flux (H) and the injection of water vapor into the atmosphere (reduction in latent heat flux LE) (figures S2 and S3). Similarly, the increased convection occurs where Rn has a positive anomaly, mostly in September (figures S1(a) and (b)). This spatial energy distribution mirrors the ascending and descending circulation branches, characterizing a thermally induced circulation.
Global warming and deforestation patterns cause significant rainfall anomalies (figure S4) and a significant delay in the rainy season onset (figures 5 and S5). For our four scenarios in SA, RCP2.6 shows an average onset on September 30 and October 4 for SEG and WEG, respectively (figures S5(b) and (c)), while RCP8.5 shows an average onset on October 1 and 7 for SEG and WEG (figures S5(d) and (e)), respectively.
The circulation anomaly exhibits a predominant subsidence movement over SA and MT during September and October (figures 3 and 4(a)–(d)) when the rainy season usually begins in these areas (figure S5(a)). In RCP2.6, the circulation affects most of SA, all of MT, and Pará, with anomalies as high as 12 d (figure 5(a)). The significant anomalies increase spatially for RCP8.5, with higher delay values (figure 5(b)). We also observed that, comparing the historical (1990–2005) onset with the worst scenario (RCP8.5 + WEG), the delay in the onset can reach 30–40 d (figures S5(a) and (e)), and the areas with significant onset delay extend geographically over most of MT (figure 5(b)).
RCP2.6 is associated with an earlier onset than RCP8.5 (figures S5(b)–(e)). Rainfall reductions are more significant in September in RCP2.6, while in RCP8.5, the main reductions happen in October (figures S4(a) and (d)).
4. Discussion
4.1. Model validation
Our simulation represented the land–atmosphere interactions over amazon as an energy-limited process, in agreement with observations and other CESM experiments (Baker et al 2021). Moreover, CESM accurately represented the circulation pattern and its impact on precipitation variability in South America (Olmo et al 2022). Furthermore, CESM's precipitation behavior was similar to the observations (figure 1), following previous multimodel evaluations, including some underestimation over the Amazon (Firpo et al 2022, Monteverde et al 2022). Our work is innovative in presenting a monthly scale analysis, which identifies with more detail differences in model simulations compared to annual means.
Previous works suggested good simulations of vegetation water cycles and energy fluxes by land surface models (CLM included) in Amazon (Christoffersen et al 2014, Restrepo-Coupe et al 2021). When replacing forests with C4 grasses, CLM tends to produce higher LE values in CESM simulations because C4 grasses are very productive in tropical regions (Boysen et al 2020). Thus, increased values in LE coinciding with high deforestation regions (figure S3(c)) were related to increased evapotranspiration due to an enhanced C4 plant's leaf area index (LAI) (figure S7(c)). Although this behavior does not match observed evapotranspiration after vegetation loss, neither in forests nor pastures (Spracklen et al 2018), it could be related to the physiological effects of CO2 or may be model-specific due to the model parametrization (Boysen et al 2020, Pitman et al 2009) and thus may bring uncertainty to the generalization of the results. However, we keep the original CLM parameterization to maintain full compatibility with the CMIP5 simulations.
Nevertheless, our simulations indicated increased precipitation (figure S4(c)) where the LE and LAI were higher (figures S3(c) and S7(c)), demonstrating a cohesive relation between evapotranspiration and rainfall over Amazon, similar to previous ESM analysis (Lawrence and Vandecar 2015, Boysen et al 2020, Baker et al 2021).
4.2. Climate response and impacts of different EG scenarios
Large-scale circulation patterns influence rainfall in SA all year (Mu and Jones 2022, Sierra et al 2022, Talamoni et al 2022), while mesoscale circulations induced by deforestation have a much shorter duration (Saad et al 2010, Lawrence and Vandecar 2015, Khanna et al 2017, Sierra et al 2022). Our results showed a deforestation-induced synoptical scale circulation anomaly with a duration of two months (figures 3 and 4), impacting the early rainy season in SA.
The additional deforestation disturbed the net radiation balance and partitioning over SA, with negative anomalies in the Rn and LE (figures S1 and S3), creating a subsidence circulation that reduced the rainfall and delayed the rainy season. Moreover, the persistence of the circulation anomaly during the dry-to-wet transition months (September–October) exacerbated the magnitude and spatial extent of the delayed rainy season onset.
Despite the known impact of reducing evaporation on precipitation, highlighting the significance of surface fluxes (Findell et al 2011, Lee et al 2012), the role of synoptic-scale phenomena is often overlooked in such cases, particularly in the context of extensive deforestation as discussed herein.
The expansion of roads in the Amazon has been causing deforestation since the 1970s, transitioning forests to agriculture around BR-230 (Moran 2016, Li et al 2019). Yet deforestation was constrained by the poor condition of Amazonia's dirt highways. These constraints have recently been removed since the recent expansion and paving of BR-163 and BR-319 (figure 2(a)). The paving of BR-163 between the Mato Grosso–Pará border and the Miritituba Port between 2019 and 2021 and the ongoing paving of BR-319 linking Porto Velho to Manaus have facilitated access to these regions leading to further deforestation due to land occupation for agriculture expansion (Andrade et al 2021, Ferrante et al 2021). Regions closer to Santarém showed higher deforestation over WEG (figure 2(g)), confirming the negative impact of BR-163 under weak governance (Soares-Filho et al 2004, Saad et al 2010). However, a higher-resolution model could provide more detailed information on road-level deforestation.
Deforestation impacted climates in both RCP scenarios through changes in circulation, rainy season onset, and rainfall (figures 3, 5, and S4, respectively). These results are consistent with several studies that relate deforestation and global warming to rainfall reduction and rainy season delay (Lawrence and Vandecar 2015, Khanna et al 2017, Wright et al 2017, Costa et al 2019, Leite‐Filho et al 2020, Baudena et al 2021, Leite-Filho et al 2021). However, in this study, we simulated a spatially long (∼1200–1500 km) and persistent (2 months) circulation pattern.
The effects on the delayed rainy season onset were more spatially extensive in RCP8.5 (figure 5(b)), affecting most of Mato Grosso and producing a significant reduction in October precipitation (figure S4(d)) (>60% reduction, α = 0.05). Mato Grosso's agriculture has already been demonstrated to be extremely sensitive to deforestation and climate change (Costa et al 2019). Other authors have noted rainfall reductions in RCP8.5 combined with deforestation (Pires et al 2016, Sampaio et al 2021). In RCP2.6, significant (α = 0.05) effects of deforestation were most extensive at the rainy season onset (figure 5(a)) but smaller than in RCP8.5. However, the impacts on total precipitation were mostly non-significant, with significant changes limited to smaller regions (figure S4).
Even the original RCP scenarios, which considered limited deforestation scenarios, caused a delayed rainy season onset and precipitation reductions for agriculture and land-use dynamics in the region (Fu et al 2013, Pires et al 2016, Costa et al 2019, Brumatti et al 2020). In addition, deforestation itself has been shown to reduce precipitation and delay the rainy season onset (Lawrence and Vandecar 2015, Khanna et al 2017, Leite‐Filho et al 2020, Leite-Filho et al 2021). Previous studies have attempted to add the climate effects of global warming and realistic deforestation linearly (Pires et al 2016, Brumatti et al 2020), showing that both forcings cause effects in the same direction, but without considering the feedback between them and with the rest of the climate system. Here we have demonstrated that the two effects (increased CO2 and realistic land use), combined with their feedbacks, may promote a vaster and more persistent impact on rainy season onset (figure 5) and precipitation reductions due to the long-lasting subsidence anomaly described here.
Along with climate change, deforestation and forest degradation will impact the Amazon's hydroclimate, ecosystem services, and ecosystem vulnerability. While forest preservation is an ally to ecosystem services (Strand et al 2018, Flach et al 2021, Rattis et al 2021), a shorter rainy season enhances ecosystem vulnerability (Gatti et al 2021) and has consequences for agriculture and hydropower generation, as discussed below.
The realistic deforestation scenarios explored here incorporate the likely consequences of the paved road infrastructure that has recently been constructed in the Amazon; this infrastructure is facilitating agricultural expansion and increasing forest fragmentation (Rochedo et al 2018, Strand et al 2018, Andrade et al 2021). This deforestation course—together with rising temperature, increasing vapor pressure deficit, and increasing fires—can destabilize or even collapse the rainforest ecosystem (Brando et al 2020, Gatti et al 2021, Oliveira et al 2022, Xu et al 2022). With a shorter rainy season and a vulnerable ecosystem, the risk to biodiversity preservation increases dramatically (Strand et al 2018, Boulton et al 2022), thus turning forest conservation into a greater challenge (Brando et al 2020, Gatti et al 2021).
Because of the climate feedbacks, agricultural expansion over Amazonia may produce results opposite from what is expected, that is, leading to lower productivity and instigating several negative economic consequences associated with agricultural activities (Costa et al 2019, Brumatti et al 2020, Spera et al 2020, Leite-Filho et al 2021, Rattis et al 2021). Previous studies that did not consider the persistent effects we have found concluded that deforestation could cost SA agriculture US$1 billion annually through the mid-century (Leite-Filho et al 2021). Our results suggest that the impacts on agriculture may be even more severe. Mato Grosso is the most affected region, with the longest delay in the rainy season onset (figure S5) due to the deforestation-induced circulation. Equivalent results from other studies for the rainy season in Mato Grosso have shown negative impacts for double cropping (Costa et al 2019, Zhang et al 2021), damaging the state's economy and productivity (Strand et al 2018, Spera et al 2020). Deforestation alone could decrease yield by 20% (Spera et al 2020). Combining the effects of deforestation and rising greenhouse gases, but without considering the positive feedback between them, yield decreases may lead to US$2.8 billion in annual losses by 2050 (Brumatti et al 2020). Thus, when considering a persistent circulation that strongly influences the early rainy season, the losses may be stronger, as calculated below.
Moreover, the Tapajós and the Xingu, Amazon River's southern tributaries that drain Mato Grosso, have many hydropower plants in operation, with many others under construction (Couto et al 2021, Wasti et al 2022). Most of these plants use the run-of-the-river concept (i.e. they incorporate little to no water storage) to reduce dam flooding impacts (Stickler et al 2013, Arias et al 2020, Costa 2020, Couto et al 2021). Unfortunately, a run-of-the-river design is largely susceptible to river discharge seasonality (Arias et al 2020), i.e. to changes in the duration of the dry season. A longer dry season and reduced precipitation could undermine billions of dollars of hydropower infrastructure (Stickler et al 2013, Arias et al 2020, Costa 2020).
Our results suggest a delay in the onset and a reduction in the length of the rainy season in Amazonia's Tapajós and Xingu basins (figures 5 and S6), where most of the hydropower expansion is planned to happen (Couto et al 2021). This rainy season behavior could diminish hydropower generation during the transitional and dry seasons, enhancing energy insecurity. Future hydropower generation, autonomy, and planning will depend much more on the presence of trees (Costa 2020, Wasti et al 2022), especially in dystopic scenarios with dry seasons of longer duration.
Using similar deforestation pathways, Strand et al (2018) calculated losses in climate-related ecosystem services that reach US$1.84 ha−1 yr−1 and US$9 ha−1 yr−1 for hydropower generation and agriculture, respectively. Using these relationships, the WEG scenario (1700 Mha deforested) would translate to losses of US$3.1 billion yr−1 for hydropower generation and US$15 billion yr−1 for agriculture. However, these computations do not consider the persistent circulation discovered in this work, which may enhance the duration of the dry season year after year. Considering the changes in the atmospheric circulation described here, SA could face substantial losses in the agribusiness and hydropower sectors.
Since the atmosphere–biosphere feedback contributes to most of our results, after the loss of the rainforest, effects of this feedback would be difficult to reverse. It would require over a million square kilometers of reforestation to undo them (Baudena et al 2021, Tuinenburg et al 2022), reversing the trajectory of the last 50 years' events and the predictions for the next three decades. Additional atmosphere–biosphere feedbacks not considered in this study could lead to savannization, seasonalization, or even dieback of parts of Amazonia's forests (Lovejoy and Nobre 2018, Boulton et al 2022), with possibly irreversible consequences.
Acknowledgments
This study was made possible by a 500 000-CPU-hour grant to M H C by the National Laboratory of Scientific Computing (LNCC), Brazil L F S C and G M A were supported by CNPq Grants 140099/2021-2 and 142230/2017-0.
Data availability statement
All data that support the findings of this study are included within the article (and any supplementary files).
Author contributions
L F S C, G M A, and M H C designed research; L F S C and G M A performed the research; L F S C analyzed the data; L F S C wrote the first draft; L F S C, G M A, and M H C wrote the paper.
Supplementary data (3.4 MB PDF)