
Abstract
Agriculture is facing the complex challenge of satisfying increasing food demands, despite the current and projected negative impacts of climate change on yields. Increasing crop diversity at a national scale has been suggested as an adaptive measure to better cope with negative climate impacts such as increasing temperatures and drought, but there is little evidence to support this hypothesis at the field scale. Using seven long-term experiments across a wide latitudinal gradient in Europe, we showed that growing multiple crop species in a rotation always provided higher yields for both winter and spring cereals (average +860 and +390 kg ha−1 per year, respectively) compared with a continuous monoculture. In particular, yield gains in diverse rotations were higher in years with high temperatures and scant precipitations, i.e. conditions expected to become more frequent in the future, rendering up to c. 1000 kg ha−1 per year compared to monocultures. Winter cereals yielded more in diverse rotations immediately after initiation of the experiment and kept this advantage constant over time. For spring cereals, the yield gain increased over time since diversification adoption, arriving to a yearly surplus of c. 500 kg ha−1 after 50–60 years with still no sign of plateauing. Diversified rotations emerge as a promising way to adapt temperate cropping systems and contribute to food security under a changing climate. However, novel policies need to be implemented and investments made to give means and opportunities for farmers to adopt diversified crop rotations.
Export citation and abstract BibTeX RIS

Original content from this work may be used under the terms of the Creative Commons Attribution 4.0 license. Any further distribution of this work must maintain attribution to the author(s) and the title of the work, journal citation and DOI.
1. Introduction
Global demand for food is predicted to increase by 50%–70% in the coming 40 years (Jaggard et al 2010, United Nations 2019). Global trend analyses show that, although yields continue to increase in many regions, across c. one third of the growing areas of major staple crops yields either never improved, stagnated or even collapsed (Ray et al 2012). There are multiple causes for these trends, notably climate change (Lobell et al 2011, Asseng et al 2017, Gammans et al 2017), depletion of soil fertility and salinization, soil erosion, pest and disease build-up (Timsina and Connor 2001), and geopolitics (Cottrell et al 2019). In the last decades, cereal yields appeared to be especially sensitive to temperature warming and precipitation deficits (Brisson et al 2010, Asseng et al 2015, 2017, Moore and Lobell 2015, Zhao et al 2017) and, without rapid adaptation, further yield losses are expected in both temperate and tropical regions (Godfray et al 2010, Ortiz-Bobea et al 2019). Hence, climate adapted cropping practices need to be developed to support crop yield under climate change (Rasmussen et al 2018). Besides relatively straightforward improvements of current cropping systems, such as changing planting dates or switching to better adapted varieties (Deryng et al 2011, Himanen et al 2013), effective adaptation would require more costly measures including crop breeding, expansion of irrigation, and more radically transformed cropping systems (Lobell et al 2008, Gaudin et al 2015, Ortiz-Bobea et al 2018, Bowles et al 2020).
Crop diversification has been suggested as a general strategy to sustain yields and reduce risk of yield losses from adverse conditions through improved soil fertility, enhanced beneficial soil biota and reduced accumulation of weeds, pests and diseases (Snapp et al 2010, Bennett et al 2012, Mcdaniel et al 2014, Tiemann et al 2015, Angus et al 2015). However, the current trend in most cropping systems worldwide, and particularly in intensive conventional crop production, is to grow cereals in increasingly short rotations, and even in continuous monoculture (Bennett et al 2012, Seymour et al 2012, Plourde et al 2013, Wang and Ortiz-Bobea 2019). From national to regional spatial scales, growing a greater diversity of crops increases the temporal stability of the total regional harvest of all crops combined, with crop complementarity buffering climate variability (Renard and Tilman 2019). However, changes in cropping practices at the management unit level will be a key component in adapting agriculture to climate change (Howden et al 2007, Snapp et al 2010, Gaudin et al 2015). To this end, it remains unclear whether alternating different crops in the same field, i.e. a diverse rotation, can buffer cereal yields against climate change. The only substantial evidence to date is from maize and soybean, where increased rotational diversity of crop species at the field scale improved yields over time and growing conditions (Gaudin et al 2015, Bowles et al 2020). Using data from seven long-term experiments spanning a wide latitudinal gradient across Europe, we investigate whether diverse rotations support yields of small grain cereals compared to monocultures, and whether diverse rotations vs. monocultures modify yield response to variable weather conditions.
2. Methods
2.1. Long-term experiments
We quantified the yield benefit of the long-term adoption of a diverse rotation vs. a cereal monoculture and tested if a diverse rotation reduced yield sensitivity to temperature warming, precipitation deficits, and their joint effects. We tested these hypotheses for spring (barley and wheat) and winter cereals (oat, wheat and rye), grown under conventional management with optimal applications of mineral fertilizers. For this, we gathered data from spring and winter cereals grown in seven, long-term rainfed experiments along a wide latitudinal gradient across Europe, including 291 site-years (figure 1). Each experiment had a sampling design with a crop rotation treatment comparing a cereal monoculture to the same cereal species and variety grown in a diverse crop rotation with a minimum of four and a maximum of six crop species (table 1). All experiments were designed such that the focal cereal crop could be sampled from both the diverse rotation treatment and the monoculture every year. For the focal cereal under monoculture, the plots remained the same during the whole duration of the experiment, while under rotation the focal cereal returned on the same plot after one full cycle (4–6 years depending on the rotation). We only considered yield observations from treatment receiving the locally recommended NPK mineral fertilizer rate (table S1 (available online at https://stacks.iop.org/ERL/15/124011/mmedia)). Sites differed widely in climate, ranging from subarctic to humid subtropical, and in other major environmental factors, such as soil features (tables S1–S2). Within each site, weeds, pests and diseases were controlled equally across treatments according to local recommendations. Cereals were harvested at physiological maturity with a combined harvester. Fresh weight was measured and dry matter determined. Plot yield was recalculated on a dry matter basis and the harvested area was used to determine annual yield per unit area (kg ha−1).
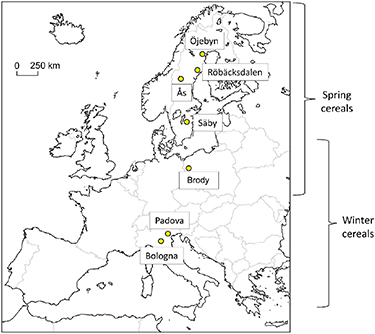
Figure 1. Geographical distribution of the seven long-term experiments along a European latitudinal gradient from Mediterranean to sub-Arctic climates, with the indication of the range of winter and spring cereals included in the analyses.
Download figure:
Standard image High-resolution imageTable 1. Duration, reference crop in monoculture, average yield over the study period, and crops included in the rotation.
| Site | Study period | Crop in monoculture | Average yield (kg ha−1 per year) | Crops in the rotation |
|---|---|---|---|---|
| Öjebyn | 1967–2009 | Barley | 2907 | Barley—Ley—Ley—Pea/oat—Potato—Ryegrass |
| Röbäcksdalen | 1966–2009 | Barley | 3034 | Barley—Ley—Ley—Pea/oat—Potato—Ryegrass |
| Ås | 1966–2009 | Barley | 3348 | Barley—Ley—Ley—Pea/oat—Potato—Ryegrass |
| Säby | 1974–2011 | Barley Oat | 3952 3772 | Fallow—Oilseed rape—Winter wheat—Oat—Barley—Spring wheat |
| Spring wheat | 3827 | |||
| Brody | 1958–2013 | Barley Winter rye | 3289 4053 | Potato—Barley—Winter triticale—Alfalfa—Alfalfa—Winter wheat—Winter rye |
| Padova | 1989–2009 | Winter wheat | 4738 | Maize—Sugar beet—Maize—Winter wheat—Alfalfa—Alfalfa |
| Bologna | 1967–2011 | Winter wheat | 4907 | Maize—Winter wheat—Maize—Winter wheat—Alfalfa—Alfalfa—Alfalfa |
2.2. Crop phenology
We limited our exploration of climate effects on crop yield to weather conditions occurring during the entire growing season from spring to maturity, and the early (spring growth to flowering) and late (flowering to maturity) parts of this period. To this end, we identified these three phenological periods for each crop in each experimental site. With the exception of winter rye in Brody (see below), no precise information was available on the timing of the active growing season and flowering, aside from generic information on the typical beginning and ending of the growing season in the region. We determined the sowing date for spring cereals, and the beginning of the active growing season for winter cereals, flowering date and maturity date for each site, crop and year as described below. The resulting dates (table S3) were remarkably stable over the years, with the exception of the sowing date. Because we had no information on how sowing time in each experiment was changed according to the specific conditions in a year, we averaged over the duration of each experiment and use the mean values as boundaries for the growing season and time of flowering.
We employed a phenological model that was calibrated and validated across a wide latitudinal and climatic gradient in Europe for winter wheat, spring wheat, oats, and maize (Olesen et al 2012). The model was applied to our sites with the parameterization reported in the original study. The same phenological model was used also for spring barley, assuming a photoperiod dependence until flowering but not after that, similarly to wheat and oats. Lacking extensive data on barley phenology extending over the latitudinal range considered here, the seven model parameters were defined as follows. The base temperature was set at 0 °C (Juskiw et al 2001, Alqudah and Schnurbusch 2014). While it has been suggested that barley has even lower base temperature and that such temperature depends on the developmental stage and variety (Saarikko and Carter 1996), such choice allowed us to exploit literature data for the parameterization of the photothermal unit thresholds for flowering and maturity. The dependence on latitude of the threshold temperature for sowing was assumed to match that of spring wheat (Olesen et al 2012); we note that sowing date is only marginally affected by these parameters for our sites. Finally, the dependence of photothermal unit thresholds on local long-term average temperature was determined based on data relative to 32 Hordeum vulgare L. accessions of different provenances, grown in soils in Gatersleben, Germany for one year (Alqudah and Schnurbusch 2014), and for 5 cultivars, grown in three locations in Alberta, Canada (Juskiw et al 2001). While the latitudes of these sites are comparable (sim 52 °N), the climatic conditions are different and extend over almost the entire range of our sites (average annual mean temperature in Gatersleben is 9 °C, comparable to Brody; average annual temperature in the Alberta sites is sim 2 °C, comparable to Röbäcksdalen). Based on the average photothermal thresholds reported by the two studies and the local average temperatures, we determined the following dependencies of the thresholds for flowering (subscript fl) and maturity (subscript mat) of the long-term average temperature, Tm (in °C): Sfl = 803 + 4.3 Tm and Smat = Sfl + 647 − 2.1 Tm. These values are in line with those obtained by a model calibration for Finland (i.e. at latitudes comparable to the Swedish sites) (Rötter et al 2011). With this parameterization, the resulting flowering and maturity dates are comparable to those observed in Northern and Central Sweden (Lister et al 2009), in Finland (Saarikko and Carter 1996), but are slightly earlier than average observations for Southern Poland (Szulczewski et al 2010).
Finally, observations for winter rye in Brody, Poland, were available over the period 1958–2012 (Blecharczyk et al 2016). We thus employed the average observed dates of full flowering (50% of anthers mature, BBCH65) and harvest (BBCH89-92) (Lancashire et al 1991).
2.3. Climate metrics
For each long-term experiment, basic meteorological data (daily minimum, maximum and average air temperature; daily precipitation totals) were obtained from local meteorological station or nearby stations within the national meteorological service (table S2). For each year and each of the three phenological periods (the whole growing season from spring growth to maturity; and the two subsets of growing season spring growth to flowering, and flowering to maturity), we calculated the following climatic variables: the total recorded precipitation over the period (mm) and the average daily mean temperature over the period (°C). When a single day of data was missing, the temperature for that day was assigned to be the average between the previous and subsequent days, while precipitation was assumed to be 0. To limit the effects of missing data, phenological periods with more than 5% of missing daily data were considered as lacking adequate meteorological information and were excluded from further analyses. We excluded 7 years in Ås and 1 year in Öjebyn and Röbäcksdalen, while all the other time-series were complete.
2.4. Statistical analyses
We created a categorical variable of crop rotation diversity by selecting yield observations of cereals grown either in monoculture or in diverse rotations. Prior to analyses, grain yields from each experiment were de-trended to account for technological improvements driving yield increases over time, such as changed crop varieties and fertilization practices, as well as other site-specific factors (figure S1). We de-trended the yield time series by pooling the treatments (rotation vs. monoculture) within each site and crop species. Within each site, any long-term effects are shared between the two treatments (rotation vs. monoculture). Hence, the de-trending removed any potential underlying long-term trends not related to the treatment, while preserving the difference in yield between monoculture and rotation. A visual evaluation revealed that each experimental site presented different yield trend patterns, which were often non-linear (figure S1). We therefore fitted for each site and crop combination a Gaussian GAM model with year as independent variable and observed yield as dependent variable. We fixed the number of knots to five to capture only long-term trends and avoid removing inter-annual variation caused by climatic conditions. After fitting the GAM model, we extracted the yield deviations, i.e. the model residuals which are the differences between the observed and fitted values from GAM model. Yield deviations were used as the response variable in all the analyses. It is important to stress that we did not test for the effect of climate on raw yield, but on how the rotation affected the yield deviation depending on the inter-annual variation in temperature and precipitation.
Due to the inherent differences in crop physiology and development, we ran separate analyses for spring and winter cereals. First, to assess how crop rotation (monoculture vs. diverse rotation) affected yield deviation, we used general linear-mixed effect models (GLMM). All models shared the same random structure with site-crop combination and plot within site-crop as random factors, to account for the spatial and temporal dependence in the experimental design. The first model included time (duration of the experiment) and rotation and their interaction as fixed effects:
Model (1)Yield deviation = f(Rotation + Time + Rotation × Time), random = sim 1|Site-crop/plotID
Model (1) tested if yield differed between the two treatments and if this difference varied with time, irrespective of climate.
To assess how crop rotation (monoculture vs. diverse rotation) affected yield response to climatic variation, we fitted the following second GLMM:
Model (2)Yield deviation = f(Temperature + Precipitation + Precipitation2 + Temperature × Precipitation + Rotation × Temperature + Rotation × Precipitation + Rotation × Temperature × Precipitation), random = sim 1|Site-crop/plotID
Model (2) explicitly tested the interaction between precipitation and temperature. We included also the quadratic term of precipitation as cereals are expected to be sensitive both to scant and heavy rainfall (Mäkinen et al 2018). The interaction between rotation and climate metrics tested whether yield response to climate varied between treatments. To test for potential multi-collinearity between climate metrics, we fitted the model with only the main effects and extracted the variance inflation factors (vif) for our variables. All the vif values were below 1.2, indicating very low collinearity. Within each site, temperature and precipitation metrics were only weakly related (table S2) and therefore could be included in the same models. Model (2) was fitted using climate metrics calculated over the three distinct phenological periods: the whole growing season (i.e. from spring growth to maturity), from spring growth to flowering, and from flowering to maturity. The three models were fitted using a maximum likelihood method (ML) and compared using Akaike Information Criterion (AIC). The best model selected by AIC was re-fitted using restricted maximum likelihood (REML). We graphically validated the underlying statistical assumptions of GLMMs using residual diagnostic plots. The model residuals presented very little temporal autocorrelation, evaluated using the 'acf' function implemented in R (R Development Core Team 2015). Years when no crops were harvested were included as missing values (<2%). In preliminary analyses, we also included crop species as fixed effect. As the inclusion of crop species did not change the results, we present the model without this variable. All analyses were generated using package 'nlme' (Pinheiro et al 2017) in R version 3.4.1 (R Development Core Team 2015).
3. Results and discussion
3.1. Yield responses to diverse crop rotations
On average, winter and spring cereals produced more under a diverse rotation than under monoculture, 860 and 390 kg ha−1 per year, respectively. Comparing the long-term effect of rotation with the raw average yield of monoculture (table 2), the benefit of adopting a diverse rotation corresponds to a 20%–25% yield gain. Because our experiments spanned several decades, we tested whether yield gain from adopting a diverse rotation changed over time (table 2). For winter cereals, the yield advantage of a diverse rotation emerged few years after implementation and then remained remarkably constant over time (figure 2(A)). For spring cereals, the yield trajectories of the monoculture and rotation diverged distinctly over time (figure 2(B)). In the first years of adoption, rotation gained little over monoculture, but then the benefit increased linearly over time, reaching over 500 kg ha−1 per year after 50–60 years, with no sign of plateauing.
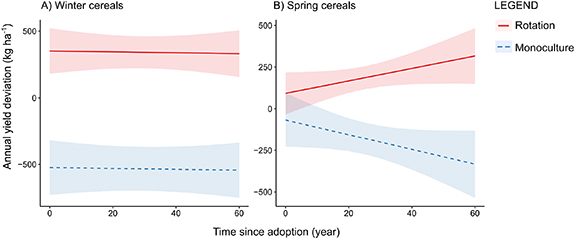
Figure 2. Temporal evolution of annual yield deviations under rotation and monoculture. (A) In winter cereals, there is an immediate and constant yield gain of adopting a diverse rotation compared with monoculture cropping. (B) In spring cereals, the benefit of rotation is small in the first years of adoption, and increases with time. The yield deviation is calculated as the difference between the observed yield and the site-specific long-term trend. The figures are partial residual plots built using the 'effects' package in R. The shaded areas are the 95% intervals of confidence.
Download figure:
Standard image High-resolution imageTable 2. Results of the linear mixed-effects models testing rotation, duration of the experiment (Time) and their interaction on yield deviation over the whole season for (a) winter and (b) spring cereals. The yield deviation is calculated as the difference between the observed yield and the site-specific long-term trend. The model included site by crop and plot ID as random factors. Main effect of time was not significant due to the de-trending.
| (a) Winter cereals | χ2 | P |
|---|---|---|
| Rotation | 117.02 | <0.0001 |
| Time | 0.02 | 0.8788 |
| Rotation × Time | 1.12 | 0.2896 |
| (b) Spring cereals | χ2 | P |
| Rotation | 36.948 | <0.0001 |
| Time | 0.05 | 0.8208 |
| Rotation × Time | 6.696 | 0.0017 |
The long-term negative effect of continuous monoculture is probably related to the deterioration of soil properties and biotic factors reducing yield, such as accumulation of specialized soil-borne pathogens and altered rhizosphere microbiome (Angus et al 2015, Bakker et al 2018), and increased weed (Weisberger et al 2019) and pest pressures (Bennett et al 2012). A diverse rotation can sustain beneficial soil communities by increasing the quality and chemical diversity of residues, with positive feedbacks on soil organic matter and fertility (Mcdaniel et al 2014, Tiemann et al 2015) and ultimately on the quantity of residues. The incremental effect of diversification we found for spring cereals has also been observed from long-term rotation experiments in maize and soybean (Gaudin et al 2015, Bowles et al 2020) and could be a common response for spring sown crops in temperate climates. Grassland diversification experiments also show that plant community species richness is a main explanatory driver for a continuous increase in biomass production over time compared with species poor communities, where nutrient cycling and use efficiency are likely to play substantial role (Tilman et al 2012). An important difference compared with crop rotation experiments is that the grassland species were grown intermixed and not in a sequence over time. However, information gained from intermixed stands are likely to be valuable also for species grown in sequence since year to year soil legacies emanating from plant-soil feedback appear strong (Heinen et al 2020).
3.2. Yield responses to climate
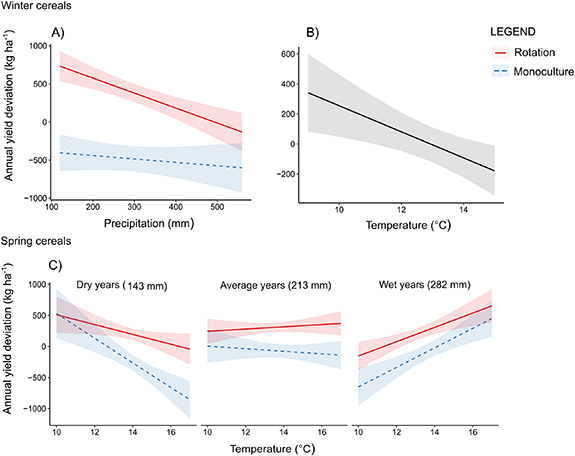
It has been shown in several independent studies that cereal production is vulnerable to temperature warming (Lobell et al 2008, Zhao et al 2017, Asseng et al 2017) and temperature and precipitation extremes (Lesk et al 2016) and that a rapid development of adaptation measures is needed to counteract these negative trends (Lobell et al 2008, Lin 2011, Challinor et al 2014). However, lack of long-term empirical data results in high uncertainties about which measures are most effective, in particular at the management unit scale (Howden et al 2007, Challinor et al 2014). We found that crop rotation reduced yield losses caused by climatic extremes for both spring and winter cereals, providing large benefits in particular under dry conditions. Both winter and spring cereals responded strongly to precipitation deficits during the whole growing season, while temperature was important only for spring cereals (table 3). We also analyzed climate effects separately for the early and late season effects, but found that both winter and spring cereals responded more strongly to the climatic conditions during the entire growing season (table S4). For winter cereals, the diverse rotation reduced crop sensitivity to severe precipitation deficits, and provided c. 1000 kg ha−1 per year higher yield than in monoculture in the driest years (figure 3(A)). There was also a pervasive negative effect of increasing temperatures on yield under both monoculture and diverse rotation (figure 3(B)). For spring cereals, warming temperatures had a negative effect in dry years and a positive effect in wet years (figure 3(C)). A diverse rotation buffered against adverse climatic conditions, in particular in the warmest and driest years in the experiment, when the yield gain of rotation over monoculture reached c. 750 kg ha−1 per year (figure 3(C), first panel). These results complement the outcomes from long-term rotation experiments of other major staple crops, which clearly demonstrate how adverse weather conditions potentially leading to water and heat stress are mitigated by diverse rotations across North America (Gaudin et al 2015, Bowles et al 2020).
Figure 3. Response of annual yield deviations to temperature and precipitation under rotation and monoculture. (A) For winter cereals, the adoption of a diverse rotation bolstered yields in dry years compared with monoculture, but (B) the negative effect of warming temperatures on yield did not depend on rotation and, (C) there was an interactive effect of temperature, precipitation and rotation on spring cereal yield. The yield deviation is calculated as the difference between the observed yield and the site-specific long-term trend. The figures are partial residual plots built using the 'effects' package in R. The shaded areas are the 95% intervals of confidence.
Download figure:
Standard image High-resolution image
Table 3. Results of the linear mixed-effect model testing the effects of rotation, climate metrics during growing season (from the start of the spring growth to maturity and their interactions on yield deviation over the whole growing season for (a) winter and (b) spring cereals. The yield deviation is the difference between observed yields and the site-specific long-term trend. The model included site by crop and plot ID as random factors.
| (a) Winter cereals | χ2 | P |
|---|---|---|
| Rotation | 126.61 | <0.0001 |
| Temperature | 7.93 | 0.00 48 |
| Precipitation | 15.13 | 0.0001 |
| a Precipitation2 | – | – |
| Rotation × Temperature | 0.09 | 0.7590 |
| Rotation × Precipitation | 4.83 | 0.0279 |
| Temperature × Precipitation | 1.34 | 0.2466 |
| Rotation × Temperature × Precipitation | 0.245 | 0.6207 |
| (b) Spring cereals | χ2 | P |
| Rotation | 41.61 | <0.0001 |
| Temperature | 1.50 | 0.2212 |
| Precipitation | 64.20 | <0.0001 |
| Precipitation2 | 16.04 | <0.0001 |
| Rotation × Temperature | 0.34 | 0.5586 |
| Rotation × Precipitation | 0.52 | 0.4697 |
| Temperature × Precipitation | 44.0.4 | <0.0001 |
| Rotation × Temperature × Precipitation | 5.18 | 0.0229 |
aPrecipitation2 was removed from the final model since the effect was linear.
The mechanisms underpinning the mitigating effect of crop rotation on yield losses under drought can be through enhanced beneficial soil biota (Tiemann et al 2015), improved soil structure, organic matter content and water retention capacity (Rawls et al 2003, Gaudin et al 2015), and increased availability of residual nutrients (Kirkegaard et al 2008), while synergistic negative effects on the plants from root diseases and drought are reduced (Seymour et al 2012). Even small changes in the amount and composition of soil organic matter can increase soil water retention capacity in diverse rotations, and improved aggregates can enhance soil infiltration rate, with potentially large consequences in medium to coarse soils and in years with conditions conducive to crop water stress (Lal 2006, Gaudin et al 2015). This is likely to be especially important for spring sown crops, which establish in the often dry and warm spring, develop shorter roots and mature later, when compared with autumn sown crops, which establish in the moister and cooler conditions of the autumn (Reckling et al 2018). Hence, improved water retention capacity and nutrient cycling are expected to be more relevant for spring- than autumn-sown crops, and are particularly needed near the soils surface when roots are still shallow.
4. Conclusions
Diverse rotations reduced cereal annual yield losses in years with high temperatures and scant precipitations by c. 1000 kg ha−1. After the experiments were started, winter cereals quite immediately yielded more in diverse rotation and kept that surplus constant over time. The spring cereal yield gain in diverse rotations increased steadily over time attaining a yearly benefit of 500 kg ha−1 after 50–60 years with no sign of plateauing. Crop rotation appears to be a promising measure for sustainable intensification of temperate cereal systems under a changing climate. Without effective adaptation measures, the projected climate changes can cause large drops in cereal yield under medium to high emissions scenarios (Lobell et al 2008, Jaggard et al 2010, Liang et al 2017). We show that diversifying crop production at the field scale by adding crop species to the rotation needs to be incorporated in the set of adaptation measures for farmers to adopt. The benefits of growing a diversity of crops are supported by recent advances in plant sciences, showing consistent evidence that increased plant diversity enhances biomass production and stability across different spatial scales (Gaudin et al 2015, Angus et al 2015, Isbell et al 2017, Renard and Tilman 2019, Bowles et al 2020).
Although the yield gains and the insurance rendered by growing a portfolio of crop species can improve farm profitability (Davis et al 2012), the local production of a larger number of crops would also require major transformations. Investments into knowledge (Kleijn et al 2019), supportive technologies and inputs, and infrastructure for processing and distribution will be needed for a larger number of crop species. Importantly, a shift of policies and subsidies that support widespread adoption of diversification rather than specialization are needed to provide farmers with the means and opportunities to diversify (van der Ploeg et al 2019).
Acknowledgments
We thank Kerstin Huss-Danell for providing data from Öjebyn, Röbäcksdalen and Ås. We thank Aimee Classen (University of Vermont, USA), Matt Liebman (Iowa State University, USA) and Christine Watson (SRUC, UK) for constructive criticism. The Swedish long-term experiments were funded by the SLU Faculty of Natural Resources and Agricultural Sciences, and the Swedish Infrastructure for Ecosystem Science (SITES) for Röbäcksdalen. The Brody/Poznań University of Life Sciences long-term experiments were funded by the Polish Ministry of Science and Higher Education. L M and R B acknowledges funding from the EU 7th framework programme to the project LIBERATION (331781). G V and R B acknowledge funding from the Swedish Research Council for Sustainable Development FORMAS (Grant No. 2018-02872). G V acknowledges also partial support by the Swedish Research Council Vetenskapsrådet (Grant No. 2016-04910).
Authors contributions
L M conceived the study; G B, A Bl, A Be, K H-D, F M, I M-J and Z S maintained the long-term experiments and provided the yield data. A S-M collated the yield dataset. G V compiled the meteorological data and computed crop phenology; L M analyzed the data; L M, A S-M, G V and R B interpreted the results and led the writing. All authors contributed to the drafting of the manuscript.
Competing financial interests
The authors declare no competing financial interests.
Data availability statement
The data that support the findings of this study are available upon reasonable request from the authors.