
Abstract
The concept of a European super-grid for electricity presents clear advantages for a reliable and affordable renewable power production (photovoltaics and wind). Based on the mean-variance portfolio optimization analysis, we explore optimal scenarios for the allocation of new renewable capacity at national level in order to provide to energy decision-makers guidance about which regions should be mostly targeted to either maximize total production or reduce its day-to-day variability. The results show that the existing distribution of renewable generation capacity across Europe is far from optimal: i.e. a 'better' spatial distribution of resources could have been achieved with either a ~31% increase in mean power supply (for the same level of day-to-day variability) or a ~37.5% reduction in day-to-day variability (for the same level of mean productivity). Careful planning of additional increments in renewable capacity at the European level could, however, act to significantly ameliorate this deficiency. The choice of where to deploy resources depends, however, on the objective being pursued—if the goal is to maximize average output, then new capacity is best allocated in the countries with highest resources, whereas investment in additional capacity in a north/south dipole pattern across Europe would act to most reduce daily variations and thus decrease the day-to-day volatility of renewable power supply.
Export citation and abstract BibTeX RIS

Original content from this work may be used under the terms of the Creative Commons Attribution 3.0 licence.
Any further distribution of this work must maintain attribution to the author(s) and the title of the work, journal citation and DOI.
Introduction
The European Commission Energy Roadmap [1] requires a significant decarbonization of the energy system in the EU, with greenhouse gas (GHG) emissions reduced by 80%–95% from 1990 levels by 2050. This roadmap aims to get secure and economically competitive electricity mainly from renewable resources—such as wind, solar and biomass—as well as from low emission sources—nuclear power plants and conventionally fueled plants equipped with carbon capture and storage devices [1]. In order to achieve the aforementioned target, it is widely expected that there will be a massive increase in photovoltaics (PV) and wind capacity across Europe. For instance, the authors of the study [2] reported that it is expected that PV and wind capacity will double by the late 2040's, following the projections of the Current Policies scenarios proposed by the International Energy Agency (IEA) [3]. However, a major challenge for power systems with a high penetration of renewables is the time variability of the supply because of the intermittent nature of the renewable resources (wind and solar) [4]. While additional spinning reserves (i.e. part-loaded fossil fuel plants able to respond at short notice) and power-storage solutions may be sufficient to manage high-frequency weather fluctuations (minutes to hours), the system is still likely to be vulnerable to longer-term climate fluctuations (days to months and longer).
An innovative idea for enhancing the performance of world power-systems requires the development of high voltage transmission lines to transport power across large geographical distances [5–7]. These transmission lines are part of high voltage direct current (HVDC) grids—currently in development in Europe—that aim to connect individual European power systems together into the so-called European super-grid [8]. In such a system, a deep knowledge of spatiotemporal variability of renewable resources is beneficial, if new renewable capacity is to be strategically distributed to best facilitate the integration of renewable energy [9–13]. This spatiotemporal information would allow the optimal distribution of new renewable capacity such that below-normal solar/wind power production in one area would be systematically compensated by above-normal solar/wind power production in other regions (at least on average) [14–16]. This spatiotemporal balancing of the renewable resources can be expressed quantitatively in a policy-making framework using Markowitz's mean-variance portfolio (MVP) optimization techniques [17]. MVP is a standard approach in financial risk management is used here to determine the 'best possible' distributions of renewable capacity such that the day-to-day variability is minimized for a desired level of total long-term average output. Portfolio optimization using similar techniques has been previously applied in smaller regions for optimal exploitation of wind and concentrating solar power (CSP) resources in southern Spain [18] and for renewable energy sources in Brazil [19]. At a continental scale, MVP analysis has also begun to be used for planning an optimal power mix for Europe [20, 21] and for the optimal deployment of wind energy in Europe [22]. There is not, however, any similar-scale study in which both PV and wind power is considered in the optimal generation mix.
Table 1. Installed PV and wind capacity and data sources.
| Countries | PV capacity (GW) | Source of PV data | Wind capacity (GW) | Source of wind data |
|---|---|---|---|---|
| Austria | 0.8 | ENTSO-E (2015) | 2.4 | ENTSO-E (2015) |
| Belgium | 3.1 | ENTSO-E (2015) | 1.5 | ENTSO-E (2015) |
| Czech Republic | 2.1 | ENTSO-E (2015) | 0.3 | ENTSO-E (2015) |
| Denmark | 0.6 | ENTSO-E (2015) | 3.8 | ENTSO-E (2015) |
| Estonia | <0.1 | — | 0.3 | ENTSO-E (2015) |
| France | 5.6 | ENTSO-E (2015) | 10.4 | ENTSO-E (2015) |
| Germany | 38.2 | ENTSO-E (2015) | 41.6 | ENTSO-E (2015) |
| Greece | 2.6 | ENTSO-E (2015) | 2.2 | ENTSO-E (2015) |
| Hungary | <0.1 | — | 0.3 | ENTSO-E (2015) |
| Italy | 18.3 | TERNA (2014) | 9 | TERNA (2014) |
| Latvia | <0.1 | — | <0.1 | ENTSO-E (2015) |
| Lithuania | <0.1 | ENTSO-E (2015) | 0.4 | ENTSO-E (2015) |
| Netherlands | 1 | ENTSO-E (2015) | 3 | ENTSO-E (2015) |
| Poland | <0.1 | — | 5.1 | ENTSO-E (2015) |
| Portugal | 0.4 | ENTSO-E (2015) | 5.1 | ENTSO-E (2015) |
| Romania | 1 | ENTSO-E (2015) | 3 | ENTSO-E (2015) |
| Slovakia | 0.4 | ENTSO-E (2015) | 3 | — |
| Spain | 5.4 | ENTSO-E (2015) | 23 | ENTSO-E (2015) |
| Sweden | < 0.1 | — | 5.8 | ENTSO-E (2015) |
| UK | 8.4 | ENTSO-E (2015) | 8.6 | National Grid (2014) |
According to these reference projections stated in [2], it is expected that the total PV and wind capacity will be doubled by the 2040s (totaling about 214 GW of new renewable capacity), mostly achieved through individual nations independently setting renewable targets. The aim of this study is to rethink this approach by evaluating different possibilities for the distribution of new renewable capacity so that the performance of a common European electricity power super-grid—in terms of maximizing the power yield and minimizing fluctuations—is enhanced and maximized. This study is conducted from a meteorological perspective and aims to explore how the weather and climate patterns in Europe can be exploited to enhance the performance of the European super-grid without technological and policy limitations. With the derived results, we therefore seek to provide to energy decision-makers with information about the optimal distribution of PV and wind capacity and its ideal mix (depending on the desired levels of power productivity and the tolerance towards supply risk) in order to support the planning of a common efficient European super-grid.
Methods
Modeling daily PV and wind capacity factors
Long-term PV and wind power series are required for a robust optimization analysis since the effects of the weather and climate condition the 'optimal' sitting of generation capacity. However, these data are not available for long-term periods and the records that exist are sparse and inhomogeneous (due to changes in installed capacity and its spatial distribution, for example). Previous studies have, however, shown that reliable long-term estimates of PV and wind power capacity factors (at national-aggregate level) can be derived from reanalysis data at daily resolution [23–26]. This follows a three-step approach which is described below.
In the first step, hourly meteorological data from the MERRA 2 reanalysis [27] are extracted for the entire European continent with a 50 km grid resolution for the period from 1980 to 2015 (36 years). From this source, surface temperature and global horizontal irradiance (henceforth denoted as GHI) are directly extracted. Following the approach of [23], hourly wind-speed data at 10, 20 and 50 m above ground level (m.a.g.l.) is extrapolated to a height representative of the wind turbine hub altitude (typically at 80 m.a.g.l.) based on a logarithmic wind-shear profile.
In the second step, the meteorological information is transformed into normalized estimates of power production using reference wind farm (WF) power curves and a PV plant model, commonly referred to as 'capacity factors' (e.g. a capacity factor of 0.1 implies that the estimated power output is 10% of the theoretical maximum output achievable from the installed generation equipment). This transformation is done independently at each MERRA grid point. For wind power, three power curves are used to calculate hourly wind capacity factors at 80 m.a.g.l. [28]. These power curves are representative of three types of wind farms: offshore, lowland (up to 400 m above the sea level, m.a.s.l), and upland (above 400 m.a.s.l). Elevations for the MERRA grid have been obtained using the 90 m spatial resolution Shuttle Radar Topography Mission (SRTM) Digital Elevation Model (DEM) [29]. This high-resolution topography dataset was firstly reduced to the same resolution of the MERRA grid then mapped onto the MERRA grid for the European region using a bilinear interpolation. Similarly, PV capacity factors are calculated based on a static tilted PV panel (oriented directly south) using as input GHI and surface temperature [30, 31]. A detailed description about the PV modeling can be found in the first section of the supplementary material available at stacks.iop.org/ERL/12/114030/mmedia.
Finally, in the third step, PV and WF capacity factor time-series at national level for each European country are estimated. To do so, a weighted average of the grid-point capacity factors is taken, with the weight reflecting the proportion of the country's total installed capacity contained within the grid-box. Clearly, this requires the grid-box distribution of installed generation capacity in each country to be known, but, unfortunately these data are not available and updated for all countries involved in this study. We therefore estimate a spatial distribution of the PV and WF capacities for each country (at the MERRA grid-scale) using a constrained linear regression method [32] applied to observed power system data(described below). More details about this procedure can also be found in section 2 of the supplementary material.
Hourly observed PV and WF power data for the European countries were collected from different sources. First of all, PV and wind power series for Austria, Belgium, the Czech Republic, Denmark, Estonia (only wind), France, Germany, Greece, Hungary (only wind), Latvia (only wind), Lithuania (only wind), Netherlands, Poland (only wind), Portugal, Romania, Slovakia (only PV), Spain, Sweden and the United Kingdom (only PV) were collected from the ENTSO-E transparency portal for the year 2015. In addition, actual PV power data for Italy, and wind power data for Italy and the United Kingdom for the year 2014 were provided by their respective national transmission system operator (TERNA and the National Grid). Table 1 summarizes the power data sources.
Based on these single-year observational datasets, weights were obtained representing the MERRA grid-box distribution of wind and/or PV capacity in each country. The weights were then used to calculate for each country hourly PV and wind capacity factors series for a total of 36 years. These hourly modeled PV and wind capacity factors series are then corrected based on the cumulative distribution function (CFD) transform (CFD-T) probabilistic downscaling approach [33, 34], applied to each calendar month independently (i.e. a bias correction is established between each calendar month in the observed year of power data and the corresponding modeled month, and the correction is applied to all similar months in the entire 36 year period6). The spatial distribution of PV and WF capacity as well as density scatter plots between actual and modeled generating capacity for all the countries are presented in section 3 of the supplementary material (supplementary figures 2–21), and a strong relationship between the modeled and observed generation is clearly displayed (shown in panels (b) and (d) for each figure). The resulting generation time-series for PV and WF are also found to be robust to the choice of training period used (as described in supplementary material section 4). Finally, these series were daily-averaged as input to the MVP optimization.
Mean-variance portfolio (MVP) optimization approach
MVP selection seeks to assemble a set of assets—the output from each of which varies in time—such that the variance in the aggregate (portfolio) output is minimized for a desired mean portfolio output level (i.e. if two portfolios with the same mean output are compared, the one with the lower output variance will be selected) [17]. Given daily PV and wind capacity factor series for different European countries (i.e. the output time series from a possible set of assets), this approach provides the percentage of PV/wind capacity that should be allocated in each country (i.e. the amount of each asset we should hold in our portfolio) in order to minimize the standard deviation of aggregated daily power output (a measure of output variability, henceforth referred to as risk) for a given level of mean power production (a measure of mean output; hereafter mentioned as yield or return). Different solutions of this optimization problem can be derived for different desired levels of return, with the set of these 'optimal portfolios' being referred to as the efficient frontier [17]. Additional constraints can also be imposed in the optimization formulation to limit the range of the allowed weights applied to each asset of the portfolio. In this study, two different analyses are conducted depending on the type/tightness of additional constraints in the formulation.
The first analysis is called 'Ideal' and aims to find the optimal allocation of the existing 214 GW of renewable capacity in the European countries such that the best power yield and risk trade-off is provided. 'Ideal' can therefore be interpreted as counter-factual scenarios of the 'present-day' (in terms of the total capacity installed), with properties corresponding to those that would have been achieved with an MVP-optimal spatial deployment of RE resources. The difference between the 'Ideal' scenarios and the observed present day is therefore considered to be measure of the sub-optimality of the observed present day distribution of RE. In the ideal optimization scenarios, the method does not preserve the current shares of PV and wind capacity (i.e. in theory the algorithm could select all the capacity to lie in a single technology).
The second analysis conducted is called 'Towards 2040'—henceforth denoted as T2040—which aims to find the optimal allocation of up to 214 GW of new renewable capacity in the European countries in order to enhance the current-day yield/risk trade-off. As in the ideal case there is no constraint on the choice of technology or country into which the additional capacity is added, but additional constraints are added to T2040 that limit the range of variation of the weights in order to ensure that existing installed renewable capacity in each country is preserved. Lower bounds are therefore set so that each country retains at least its currently existing PV and wind capacity, while upper bounds are selected such that all the new capacity could, in the extreme case, be allocated in a single country as a single technology (i.e. all PV or all wind), although more typically one expects the additional capacity to include a mixture of technologies spread over many countries. The T2040 analysis is conducted in five steps by gradually adding 42.8 GW of new renewable capacity, so a collection of five efficient frontiers is derived. T2040 can therefore be viewed as a series of step-wise increases in RE capacity on top of the existing European RE distribution which are designed to move the entire system from its present sub-optimal state towards MVP-optimality (i.e. the maximum yield for minimum risk).
The mathematical formulation of the portfolio selection problems is provided in section 5 of the supplementary material.
A lesson that has been learned from the many years of experience with applying traditional MVP optimization techniques in practical financial problems is that the results of the portfolio selection exercise can be sensitive to small perturbations in input data (the vector of expected yields and the variance-covariance matrix between generating capacities) [35–37] This is particularly prominent if the correlation between the returns on a subgroup of portfolio constituents (in our case a WF or a PV generation unit) is high. To reduce the effect of noisy inputs, we assemble highly correlated assets into larger groups by applying a clustering technique prior to the optimization process, following [38].
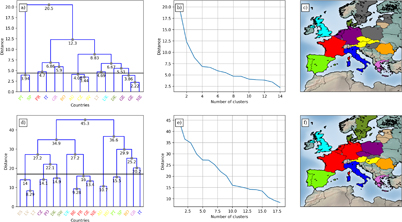
Figure 1. (a) Dendrogram for the PV clustering. Groups below the black horizontal line are the selected clusters. (b) Distance vs. the number of clusters derived from the hierarchical clustering. (c) The set of ten country groups resulting from the PV clustering. Grey-colored countries do not participate in the selected partitioning. Panels (d), (e) and (f) are the same as in (a), (b) and (c) but for the clustering of wind power series. The acronyms used for the countries are: AU (Austria), BE (Belgium), CZ (Czech Republic), DK (Denmark), ES (Estonia), FR (France), GE (Germany), GR (Greece), HU (Hungary), IT (Italy), LV (Latvia), LT (Lithuania), NE (Netherlands), PO (Poland), PT (Portugal), RO (Romania), SV (Slovakia), SP (Spain), SW (Sweden) and UK (United Kingdom).
Download figure:
Standard image High-resolution imageCountry-level daily capacity factor time series are grouped using a hierarchical clustering method in which the Ward minimization algorithm is used to reduce the total within-clusters variance [39]. This clustering stage is conducted separately for the daily wind and PV capacity factor series and their respective dendrograms are presented in figures 1(a) and (d). The final number of clusters is selected based on a compromise between the number of clusters retained (i.e. determining the cardinality of our asset universe) and the optimal number of clusters obtained following the traditional Elbow criteria. To do so, the distance is calculated for different number of clusters (varying from 2 to N-1), and the optimal number of clusters is therefore obtained when this metric experiences a change in slope. Figures 1(b) and (e) show the distance for different number of clusters for the wind and PV clustering, respectively. Despite the fact that the elbow in the clustering of the PV resources is observed for the fourth cluster, we selected the same number of clusters as in the case of wind for clarity. Thus, according to these graphs a total of 10 clusters for both PV and wind were selected for the MVP analysis and the resulting grouping of countries is shown in figures 1(c) and (f) for wind and PV clustering, respectively. The cluster-aggregate daily PV and wind capacity factor series are then calculated as an area-weighted sum of the individual capacity factor series in each country within the cluster. Figure 2 presents the resulting map of the existing installed PV and wind capacity for 2015 by cluster (figures 2(a) and (b)), means of daily PV and wind capacity factors (figures 2(b) and (e)), and the standard deviation of daily PV and wind capacity factors (figures 2(c) and (f))—these are referred to in the subsequent discussion.
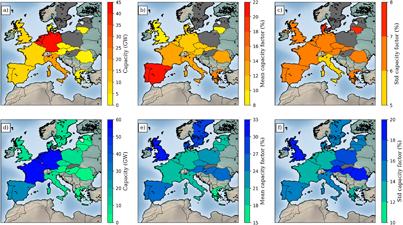
Figure 2. (a) Currently installed PV capacity in each of the ten clusters (as of 2015). (b) The mean PV capacity factor for the ten clusters. (c) The standard deviation of daily PV capacity factors for the ten clusters. Panels (d), (e) and (f) are the same as in (a), (b) and (c) but for the clustering of wind resources.
Download figure:
Standard image High-resolution image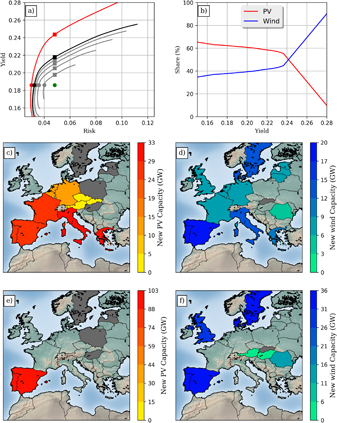
Figure 3. Results from the 'Ideal' and 'Towards 2040' analyses (Ideal and T2040, respectively). Panel (a) presents the efficient frontiers in the risk/yield plane corresponding to the Ideal scenario (red curve) and the five optimization settings associated with the T2040 analysis (grey curves for the four first stages and black for the final stage). The green dot represents the position in the risk-yield plane of the current distribution of PV and wind capacity across the selected group of European countries. Circles in the efficient frontiers represent the portfolios that minimize the risk preserving the current power yield, whereas squares represent the portfolios that maximize the power yield preserving the current level of risk. (b) The PV and wind share in the case of the ideal analysis for different power yield targets. Only the spatial allocation of the PV and wind capacity for two portfolios of the ideal case is presented in this figure. Panels (c) and (e) map the PV and wind capacity allocation, respectively, corresponding to the Ideal portfolio that minimizes the risk retaining the current power yield (red circle in panel (a)). Panels (d) and (f) show the PV and wind capacity allocation, respectively, corresponding to the Ideal portfolio that maximizes the yield while being characterized by the current level of energy supply risk (red square in (a)). Finally, the corresponding allocation of PV and wind capacities for the remaining selected portfolios of the T2040 analysis—black and gray circles and squares in (a)—are presented in tables 2 and 3.
Download figure:
Standard image High-resolution imageFinally, the robustness of the portfolio optimizations is conducted. This sensitivity analysis—which is described in detail in section 6 of the supplementary material—indicates that the results from the optimization scenarios discussed below are stable to the sampling period used, giving portfolios showing similar risk/return performance and low variations in the capacity assigned in each cluster.
Results and discussion
Ideal allocation of the existing renewable capacity
The Ideal optimization scenario provides the decision-maker a set of different counter-factual portfolio possibilities for the spatial distribution of the existing capacity among the European countries involved in this study. Each portfolio is characterized by the lowest power supply risk for a given yield target and all optimal portfolios make up the 'efficient frontier'. The pairs of yield/risk values associated with each of these optimal portfolios compose the red efficient frontier depicted in figure 3(a). Overall, most of the different portfolios along this efficient frontier substantially improve the yield/risk ratio compared to the existing distribution of the renewable capacity (see the green dot in figure 3(a), which is clearly encompassed by the efficient frontier). In the light of the results, we can conclude that the performance of the European super-grid would have been better if the allocation of the renewable capacity had been planned following a joint coordination at European level rather than an ad-hoc distribution guided by capacity targets set by each country independently. Among the set of portfolios representing this efficient frontier, two of them are further examined.
The first portfolio—henceforth denoted as IdealEqRet—represents a counter-factual capacity distribution which minimizes the risk while maintaining the same yield as the observed present-day capacity distribution. It is therefore a thought experiment such that we allow the existing wind and solar capacity to be moved (or replaced) such that it has the same average output but the lowest possible day-to-day variance. This portfolio is represented with a red dot in figure 3(a), and its associated maps with the PV and wind capacity allocation are presented in figures 3(c) and (d), respectively.
Table 2. Allocation of the new PV and wind capacity (in GW) derived from the five optimization processes that minimize the risk level preserving the power yield provided by current-day capacity distribution from the 'Towards 2040' analysis.
| Clusters | Added Capacity (GW) | ||||
|---|---|---|---|---|---|
| 42.80 | 85.60 | 128.40 | 171.20 | 214.00 | |
| PV | |||||
| AU-CZ-SV | 0.57 | 0.98 | 1.28 | 1.52 | 1.71 |
| BE-GE-NE | 7.07 | 12.10 | 15.88 | 18.83 | 21.19 |
| DK | 0.10 | 0.17 | 0.23 | 0.27 | 0.30 |
| FR | 2.42 | 5.41 | 7.48 | 14.00 | 19.60 |
| GR | 0.43 | 1.93 | 8.30 | 14.21 | 20.08 |
| IT | 3.05 | 5.23 | 6.86 | 8.14 | 11.83 |
| LT | 0.01 | 0.02 | 0.03 | 0.03 | 0.03 |
| PT-SP | 6.00 | 17.60 | 29.05 | 37.36 | 45.03 |
| RO | 0.17 | 0.29 | 0.37 | 0.44 | 0.50 |
| UK | 1.40 | 2.40 | 3.15 | 3.72 | 4.20 |
| WIND | |||||
| AU-HU | 0.45 | 0.77 | 1.02 | 1.21 | 1.36 |
| BE-FR-GE-NE | 9.40 | 16.13 | 21.16 | 25.10 | 28.22 |
| CZ-PO | 0.90 | 1.54 | 2.03 | 2.40 | 2.70 |
| DK-SW | 1.60 | 2.75 | 4.09 | 6.77 | 9.38 |
| ES-LV-LT | 0.13 | 0.22 | 0.29 | 1.09 | 2.19 |
| GR | 0.99 | 4.07 | 7.70 | 10.86 | 13.69 |
| IT | 1.50 | 2.57 | 3.38 | 4.00 | 5.25 |
| PT-SP | 4.68 | 8.02 | 10.52 | 14.04 | 18.20 |
| RO | 0.50 | 0.94 | 2.36 | 3.39 | 4.24 |
| UK | 1.43 | 2.46 | 3.22 | 3.82 | 4.30 |
Table 3. Same as table 2, but for the portfolios that maximize the power yield preserving the energy risk supply level of today's capacity distribution.
| Clusters | Added Capacity (GW) | ||||
|---|---|---|---|---|---|
| 42.80 | 85.60 | 128.40 | 171.20 | 214.00 | |
| PV | |||||
| AU-CZ-SV | 0.57 | 0.98 | 1.28 | 1.52 | 1.70 |
| BE-GE-NE | 7.07 | 12.10 | 15.89 | 18.83 | 21.19 |
| DK | 0.10 | 0.17 | 0.23 | 0.27 | 0.30 |
| FR | 0.94 | 1.61 | 2.11 | 2.50 | 2.82 |
| GR | 0.43 | 0.74 | 0.97 | 1.15 | 1.30 |
| IT | 3.05 | 5.23 | 6.87 | 8.14 | 9.15 |
| LT | 0.01 | 0.02 | 0.03 | 0.03 | 0.03 |
| PO-SP | 3.68 | 11.75 | 22.42 | 35.20 | 49.33 |
| RO | 0.16 | 0.30 | 0.36 | 0.44 | 0.50 |
| UK | 1.40 | 2.40 | 3.15 | 3.73 | 4.20 |
| WIND | |||||
| AU-HU | 0.45 | 0.77 | 1.02 | 1.21 | 1.36 |
| BE-FR-GE-NE | 9.40 | 16.13 | 21.17 | 25.10 | 28.22 |
| CZ-PO | 0.90 | 1.54 | 2.02 | 2.40 | 2.70 |
| DK-SW | 3.25 | 7.85 | 12.88 | 18.23 | 23.85 |
| ES-LV-LT | 0.13 | 0.22 | 0.28 | 0.33 | 0.38 |
| GR | 0.37 | 0.63 | 0.82 | 0.98 | 1.10 |
| IT | 1.50 | 2.57 | 3.38 | 4.00 | 4.50 |
| PO-SP | 4.68 | 9.19 | 14.88 | 20.92 | 27.22 |
| RO | 1.74 | 4.02 | 6.40 | 8.87 | 11.42 |
| UK | 2.97 | 7.38 | 12.24 | 17.35 | 22.73 |
The IdealEqRet portfolio clearly outperforms the observed present-day portfolio (risk 0.030 compared to 0.048), suggesting that the day-to-day variability associated with today's RE distributions could have been 37.5% lower with no loss of average aggregate output if a 'better' continental-scale spatial distribution had been sought from the outset. From the analysis of figures 3(c) and (d), it is seen that PV plays a more important role than wind (a total of 132.3 vs. 81.8 GW) in IdealEqRet compared to the observed distribution. Most of the PV capacity is installed in Greece (32.8 GW), Italy (30.2 GW), the Iberian cluster (28.5 GW), and France (25.0 GW). The wind capacity is allocated in the Iberian cluster (19.7 GW), the Scandinavian cluster (12.9 GW), Italy (12.4 GW) and Greece (11.7 GW).This PV and wind capacity distribution aims to reduce as much as possible the fluctuations in the power supply (while preserving the total yield), so the capacity is mainly set in the less fluctuating clusters such as Italy and the Iberian cluster for PV (figure 2(c)) and the Mediterranean region and the Scandinavian countries for wind (figure 2(f)).
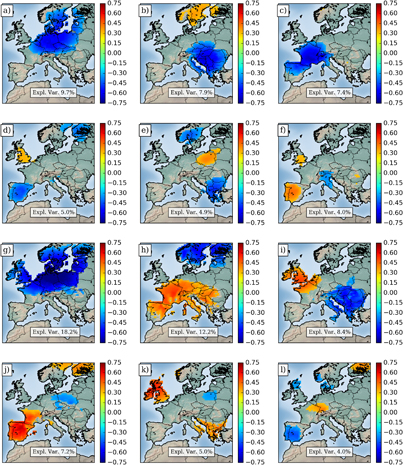
The optimization process does not, however, focus the installation of renewable capacity only in clusters with low variability, but also in others in which the PV and wind resources are spatiotemporally balanced. Hence, this procedure takes advantage of the implicit spatiotemporal balancing of PV and wind resources to install some capacity in clusters for a better mitigation of time fluctuations in the aggregate power supply. The potential of this approach for attaining more optimal continental-scale distributions of RE capacity is highlighted by a principal component analysis (PCA) [40, 41] of daily-gridded PV and wind capacity factor anomalies applied to the entire European region. PCA is applied separately to PV and wind fields. To ease the interpretation of results, figure 4 shows factor loading maps for the first six only variability modes. Among the PV PCA modes, the sixth (figure 4(f)) plays an essential role for the capacity allocation in this first portfolio. This mode suggests a balancing of the PV resource between northern Italy and the Iberian Peninsula (figure 4(f)). This feature appears to be exploited by the optimization method by allocating some PV capacity in the latter region to effectively mitigate fluctuations in PV power production. The wind resource presents clearer and stronger balancing patterns than the PV resources. From the results of the PCA, spatiotemporal balancing is prominent between the southern Europe and the Scandinavian countries (given by the second mode, figure 4(h)); and between the northwestern and southeastern of the study region (given by the third mode, figure 4(i)). This complementary feature of the wind resource also appears to be exploited by the optimization method, as seen from the capacity allocation depicted in figure 3(c).
Figure 4. The results for the first six variability modes derived from the PV and wind PCA analyses. (a)–(f) The factor loading maps for the first six modes of the PV PCA analysis. Similarly, (g)–(l) show the loading maps corresponding to the first six modes from the wind PCA.
Download figure:
Standard image High-resolution image
The second optimal portfolio derived—hereafter denoted as IdealEqRisk—represents a second counter-factual reality maximizes the average power yield while preserving the risk level of the observed present-day capacity distribution. It is therefore a thought-experiment such that we allow the existing wind and solar capacity to be moved (or replaced) such that it has the same day-to-day variability but the highest possible average output. This portfolio is denoted by a red square in figure 3(a) and the allocation of PV and wind capacity associated with this portfolio is shown in figures 3(e) and (f).
The IdealEqRisk portfolio again clearly outperforms the observed present-day portfolio (return 0.243 compared to 0.186), suggesting that the average aggregate output from today's observed RE distribution could have been 31% higher with no increase in day-to-day variability if a 'better' continental-scale spatial distribution had been sought from the outset. In contrast to the, equal-return (IdealEqRet) portfolio, wind resources are slightly more important than solar ones (102.6 vs. 111.5 GW) as it is typically associated with higher values for the mean capacity factor (see figures 2(b) and (e)). This switching role between PV and wind is observed when the imposed yield in the MVP optimization is increased. As illustrated in figure 3(b), which shows how the shares of PV (solid red line) and wind (solid blue line) grow for different targets for the power yield, for an expected yield of 0.24 and above wind is increasingly preferred. The spatial distribution of PV and wind capacity is less dispersed than in the IdealEqRet scenario, concentrating the PV capacity (figure 3(e)) in the Iberian cluster (102.6 GW), and the wind capacity (figure 3(f)) in the Iberian cluster (35.6 GW), the Nordic cluster (31.2 GW), UK (28.6 GW) and Romania (13.1 GW). As these portfolios aim to maximize the production level, most of the capacity is located in countries with the highest values for the mean capacity factor (figures 2(b) and (d)) such as the Iberian cluster (for PV and wind), the UK, the Nordic cluster (for wind). In this case, the optimization method only appears to take advantage of the complementarily patterns of the wind resource presented in figures 4(h) and (i) (NW–SE and NE–SW Europe respectively).
Optimal allocation of new renewable capacity: towards 2040
The T2040 analysis focuses on how the 214 GW of new renewable capacity can be added in Europe to improve the efficiency of the common grid (i.e. to move the mix towards mean-variance optimality). No distinction is made between PV and wind: the optimisation is free to select either wind, PV or a mixture of both and the resulting share of wind and solar is not fixed. This analysis is conducted incrementally, i.e. the optimization is carried out by gradually giving out 42.8 GW in five successive steps until all the projected capacity for 2040 is spent. The corresponding efficient frontiers for the five proposed problems are depicted in figure 3(a): the first four efficient frontiers are plotted in gray, and the curve for the final stage is plotted in black. It can be seen that the gradual allocation of the new renewable capacity following the efficient frontiers substantially improves the efficiency of the current-day European capacity distribution. Moreover, the gain in efficiency increases as more capacity is installed. Similarly to the Ideal analysis, two portfolios for each efficient frontier are further elaborated. The first set of selected portfolios aims to minimize the overall risk while preserving current-day yield and the resulting allocation of capacity for each stage is presented in table 2. On the contrary, the second set of portfolios aims to maximize the power yield while preserving the current-day level of risk. The capacity allocation for these portfolios is presented in table 3.
The first set of portfolios—represented with dots in figure 3(a) in each efficient frontier—gradually reduce the average risk from 0.048 to 0.040 (by 16.6%), 0.036 (by 25.0%), 0.034 (by 29.1%), 0.033 (by 31.2%) and 0.032 (by 33.3%) for the five steps respectively. These results suggest that careful planning of relatively small increments of additional capacity installation could substantially reduce the day-to-day variability of the total European renewable power supply. The role of each cluster for the allocation of new renewable capacity can vary, however, depending on the stage. This fact is particularly evident for PV (see table 2). Note that at the first capacity allocation stage, most of the new PV capacity is installed in the north central European cluster (BE-GE-NL), whereas in the subsequent steps, new PV capacity is primary installed in France, Greece and in the Iberian cluster (PT-SP). Wind, by contrast, is always installed mainly in the cluster composed by Belgium, France, Germany and the Netherlands, and in the Iberian Cluster. At the final stage, the new PV capacity is installed in the Iberian cluster (45.03 GW), the central European cluster (21.19 GW), Greece (20.08 GW), and France (19.60 GW). Similarly, the new wind capacity is allocated in the central European cluster (28.82 GW), the Iberian cluster (18.20 GW), Greece (13.69 GW) and to a lesser extent in the Nordic cluster (9.38 GW). As in the IdealEqRet scenario, this portfolio sets most of the renewable capacity in the less fluctuating clusters because it aims to minimize power supply risk (figures 2(c) and (f)) but, in addition, these capacity distributions also take advantage of the balancing patterns between the PV and wind resources to allocate capacity, particularly those captured by the sixth mode of the PV PCA (figure 4(f)) and the third mode of the wind PCA (figure 4(i)).
The second set of portfolios is able to gradually increase the yield from the current-day value of 0.186–0.197 (by 5.9%), 0.205 (by 10.2%), 0.211(by 13.4%), 0.214 (by 15.0%) and 0.218 (by 17.2%), as shown in figure 3(a). These results again confirm that coordinated international planning could maximize the total European power yield on average (without increasing the risk exposure) and that the role of each cluster for the allocation of new renewable capacity may vary depending on the renewable deployment stage. This fact is particularly evident for PV (see table 3). For instance, most of the PV capacity is installed in the cluster formed by Belgium, Germany and the Netherlands during the first stage, but then it is primary installed in the Iberian cluster. A similar behavior is observed for the new wind capacity. In the three first stages, the north central European cluster (BE-FR-GE-NE) is the dominant for the installation of wind capacity, but after the fourth step, the Iberian cluster, the Nordic cluster and the UK absorb most of new capacity. After the final step, most of the new PV capacity is installed in the Iberian cluster (49.33 GW), the north central European cluster (BE-GE-NE) (21.19 GW) and Italy (9.15 GW). Similarly, the new wind capacity is allocated in the north central European cluster (28.22 GW), the Iberian cluster (27.22 GW), the Nordic cluster (23.85 GW) and the UK (22.73 GW). Again, this portfolio tends to put most of the new renewable capacity in the clusters with the highest average capacity factors (figures 2(b) and (f)) but also combines capacity in other clusters in which the wind resource shows spatiotemporal balancing (figures 4(h) and (i)).
Conclusions
A key ingredient in the gradual decarbonization of European power systems is the displacement of carbon-intensive generation by the deployment of renewable energy technologies. However, one of the main threats for power systems based mainly on renewables is the lack of reliability in energy supply, as a consequence of the temporal variability of the underlying renewable resources. It is therefore essential to consider the minimization of renewable generation risk alongside the maximization of expected renewable power output. The construction and existence of a common European super-grid may offer new opportunities to address both of these issues simultaneously—enabling an increase in total power yield and a reduction in variability—by exploiting the individually 'best' locations and areas with inherent spatiotemporal balancing (i.e. above-normal power production in some countries could be transferred to others with below-normal production).
While in reality the sitting of present (and future) RE capacity will undoubtedly be influenced by many complex political, technical and socio-economic considerations which are beyond the scope of this work, this study nevertheless provides specific meteorological guidance to European energy policy-makers on how the deployment of future renewable generation plants could best achieve a desired balance of mean-output versus day-to-day variability in a putative future European super-grid. In particular, using an MVP optimization approach, we have shown that the current distribution of European wind and PV capacity is far from optimal: a higher mean aggregate power output would have been possible for the same level of day-to-day energy supply variability-and the same mean aggregate power output could also have been attained with much less day-to-day variability.
The future scenarios considered also demonstrate that the current situation could be improved through careful international planning of relatively small increments of additional capacity installation. The choice of where to deploy new resources depends on the objective being pursued. On the one hand, if the objective is to minimize fluctuations, the capacity should primarily be installed in countries with the most predictable power production, and secondly, in countries whose renewable production profile complements that of the previous countries. On the other hand, if the target is to maximize the average power yield, then capacity should mainly be installed in countries with the highest power production, and secondly in countries able to balance the wind resource of the aforementioned countries.
The results show the importance of three main areas for the deployment of renewable energy regardless the target (maximization of yield or minimization of risk): the Iberian Peninsula (for its solar and wind resources) and the UK and Nordic countries (for their wind resources). These areas present high PV and wind energy generation potential and efficiently exploit the spatiotemporal balancing of the wind resource between the Iberian Peninsula and the northern Europe. The results also show the importance of the Mediterranean basin (Italy and Greece) for the installation of renewable capacity and the central Europe for PV capacity when the target is to reduce the risk. Despite the fact that the energy resources in these areas are poorer if examined individually, the combination of these areas with the Iberian Peninsula and the Nordic countries takes more advantage of the existing balancing patterns in Europe, reducing therefore the variability of the aggregate power production.
Acknowledgments
This study has been supported by the Department of Meteorology at the University of Reading (UK), the Department of Physics at the University of Jaén (Spain), and the Research Unit of the Aristotle University of Thessaloniki (Greece), under grant code 93280. The authors would like to thank the European Network of Transmission System Operators for Electricity (ENTSO-E), the National Grid (UK) and TERNA (Italy) for providing actual data on current PV and wind power generation.
Footnotes
- 6
This proposed monthly correction is not conducted for the wind generating capacity of Netherlands, because the observations contain missing data for entire months. So, for this particular case, the correction was conducted for the entire period.