

Abstract
The virial coefficients of cryogenic gases, especially helium-4 and helium-3, are playing an ever more critical role in the establishment of primary reference standards for temperature after the redefinition of the kelvin in the SI. Thus, the reliability of the values and uncertainties of these coefficients, especially those of the second, third, and even fourth density virial coefficients (B, C and D), has become more significant. To check the accuracy of these coefficients for helium-4 from ab initio calculations, the refractive-index gas thermometry (RIGT) method was developed, allowing for the simultaneous determination of thermodynamic temperatures and density virial coefficients. Using this technique, highly accurate experimental values of B, C and D for helium-4, as well as T–T90 values, were obtained for the range 5 K–25 K. Direct comparisons with the ab initio calculation density virial coefficients for helium-4 were conducted, revealing excellent agreement. Furthermore, good agreements of thermodynamic temperatures T between absolute RIGT and our previous single pressure RIGT (Gao et al 2021 Metrologia 58 059501) were achieved at temperatures from 5 K to 25 K, with differences within each standard uncertainty. This further strengthens our confidence in the comparisons made in this work. It is foreseeable that the rigorously verified ab initio calculations of the density virial coefficients for helium-4 will continue to be used to improve the measurement accuracy of helium-based primary reference standards for temperature and pressure.

Original content from this work may be used under the terms of the Creative Commons Attribution 4.0 license. Any further distribution of this work must maintain attribution to the author(s) and the title of the work, journal citation and DOI.
1. Introduction
Since the new SI came into force on 20 May 2019, the base unit the kelvin has been defined in terms of a fixed value of the Boltzmann constant k. According to the ‘Mise en pratique for the definition of the kelvin in the SI [1], high-accuracy thermodynamic temperature under the revised SI kelvin framework is achievable through cryogenic primary thermometry methods operating below approximately 20 K, particularly via primary gas thermometry. By which, thermodynamic temperature can be accurately determined with the help of the gaseous virial equation of state provided know the accurate values of virial coefficients in theory, see figure 1. This feasibility is fundamentally enabled by recent breakthroughs in ab initio calculation of density viral coefficients of helium [2–4]. For this reason, the virial coefficients of cryogenic gases, especially helium-4 (4He) and helium-3 (3He), are playing an ever more critical role in the establishment of primary reference standards for temperature by using several gas thermometry techniques, namely refractive-index gas thermometry (RIGT) [5–8], acoustic gas thermometry (AGT) [9], dielectric-constant gas thermometry (DCGT) [10]. Thus, the reliability of the values and uncertainties of these theoretical coefficients becomes more critical, especially those of the second, third and fourth density virial coefficients, B, C and D. Since their terms dominate the uncertainty budget at lower temperatures.
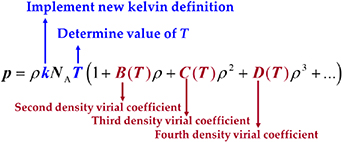
Figure 1. Thermodynamic temperature measurement traceable to the new kelvin using the gaseous virial equation of state to correct for the non-ideal behavior of the working gas.
Download figure:
Standard image High-resolution imageTo cross-validate theoretical helium-4 virial coefficients (B, C, D) and their uncertainties, we developed a RIGT methodology employing single-isotherm fitting. This approach simultaneously resolves thermodynamic temperature T and virial coefficients. By doing so, two critical objectives were achieved in this work (no new T–T90 reported in this work): first, demonstrated proof of principle of RIGT variants through consistency checks against our previous T determinations [11]; second, assessed the theoretical density viral coefficients of 4He by a direct comparison with our experimental values. It is foreseen that the verified state-of-the-art ab initio calculations of the density virial coefficients B, C and D for helium-4 will be used to improve the accuracy of primary gas thermometers and primary gas manometers.
The rest of the paper is structured as follows. In section 2 we present the methodology of RIGT, which can be used to experimentally determine density virial coefficient of gas. Determination of effective isothermal compressibility of the microwave resonator is presented in section 3. In section 4, we present direct comparisons between the experimental and ab initio results for the second, third and fourth density virial coefficients of 4He. A conclusion and perspectives in section 5 round off the paper.
2. Methodology
2.1. Principle of RIGT
The working principle of RIGT has been described widely elsewhere, including absolute RIGT as in [12, 13] and relative RIGT with measurements at a single pressure (SPRIGT) in [5] and constant refractive-index (CRIGT) in [8]. Based on our previous SPRIGT measurements (5 K–25 K) [5] with a reference thermodynamic temperatures TAGT calibrated via acoustic gas thermometry, we reanalyze these data in absolute RIGT way to simultaneously determine helium-4 density virial coefficients and thermodynamic temperatures, achieving two goals: validating RIGT variants through SPRIGT consistency checks [11], and directly testing theoretical virial coefficients against experimental values. Hereafter, only a brief introduction to absolute RIGT will be given.
2.1.1. Theoretical determination of gaseous refractive-index.
The refractive-index n is a function of the relative electric permittivity  r and the relative magnetic permeability μr of the gas [5]:

The former r is related to the molar gas density ρ via the Clausius–Mossotti equation [14]:
where A, B and C are dielectric virial coefficients, which, in the case of 4He, have been accurately determined by ab initio calculation (A, [15]; B, [16]; C [17]).
The relative magnetic permeability μr is obtained from the analogous Clausius–Mossotti equation for magnetism [14]:
where only the first diamagnetic virial coefficient Aμ (in this work the value in [18] for 4He) is required for the level of accuracy sought here.
Combining equations (1)–(3), one obtains the following expression for the theoretical refractive-index, hereafter referred to as ntheo:
where the molar density ρ is related to the pressure p and temperature T via the virial equation of state (VEOS)

where the second, third and fourth density virial coefficients (B, C and D) for 4He can be accurately determined by ab initio calculation methods (in this work those values in references, i.e.: B, [2]; C, [3]; D, [4] were employed). They are functions of temperature only. The universal gas constant R is the product of the Avogadro constant NA (=6.022 140 76 × 1023 mol−1) and the Boltzmann constant k (=1.380 649 × 10−23 J K−1) fixed in the new SI [19].
2.1.2. Experimental determination of gaseous refractive-index.
The experimental refractive-index of the working gas, hereafter referred to as nexp, can be obtained from the ratio of microwave resonance frequencies in a quasi-spherical copper resonator under vacuum f(T,0) and filled with gas at a pressure p, f(T,p) [5]:
where f is the resonance frequency and κT (T) is the isothermal compressibility of the resonator at temperature T [6, 20].
2.1.3. Absolute RIGT.
With the refinement of ab initio calculations over the last two decades, the uncertainties of the virial coefficients for 4He have been reduced by nearly one order of magnitude [2, 21–26]. This makes it possible to determine an unknown thermodynamic temperature T with RIGT by setting the experimental and theoretical refractive-index values equal at a single thermodynamic state point. This is called ‘direct (p, T) state evaluation’ method [12].
In this way, we can determine the unknown thermodynamic temperature T once nexp measurements have been completed under a given pressure, using numerical iteration method by minimizing the quantity  , with known accuracy ab initio values of various virial coefficients in equation (4) of the working gas. Note that numerical iteration calculations were based on the Levenberg–Marquardt algorithm [27] with a 0.1nK (i.e. 10–10 K) convergence criterion imposed on T to yield the required numerical accuracy [28].
2.2. Methods to determine thermodynamic temperature and density virial coefficients
Beside density virial coefficients, the methods presented below could also be used to determine the dielectric virial coefficients appearing in equation (2). To illustrate the principle, we describe only the determinations of T and B.
2.2.1. Single-isotherm fit RIGT.
In the ‘direct (p, T) state evaluation’ method, there is only one equation  , so only a single unknown quantity, in this case thermodynamic temperature T can be determined. However, if measurements are performed at two pressures along the same isotherm, the resulting two equations allow for the determination of two unknown quantities, both thermodynamic temperature T and the second density virial coefficient B from equation (5), or other virial coefficients such as C and D. By extension, if data are acquired at multiple pressures, a correspondingly larger number of unknown quantities may be determined. As shown in [28], by fitting experimentally measured n2expt isotherm data as a function of p to a polynomial of the form in equation (10), one can extract values of the thermodynamic temperature T and density virial coefficients (B, C) from the fitted values of the coefficients An, Bn and Cn in an indirect way via equations (11)–(13) in [28]. It is called the ‘ideal gas extrapolation’ analysis method [12]. This provides a way to determine the experimental density virial coefficients. However, it involves enhanced correlation between T, B and C, and some accuracy is lost when the simplified equations are used.
Instead of this, in the present work, we propose to determine the thermodynamic temperature T and density virial coefficients (B, C or D) simultaneously in a direct way of extrapolation of RIGT by minimizing the quantity  at multiple pressures
  with the help of known accurate values of other virial coefficients of the working gas from ab initio calculations. In this work, we refer to it as single-isotherm fit RIGT.
2.2.2. Multiple-isotherm fit RIGT.
Besides ‘direct (p, T) state evaluation’ and ‘ideal gas extrapolation’ RIGT, there also exist multiple ‘ideal gas extrapolation’ RIGTs performed on multiple isotherms, the ensemble of which is hereafter referred to as multiple-isotherm fit RIGT. This is implemented to determine simultaneously thermodynamic temperatures  and density virial coefficients (for example
  ) by minimizing the quantity
  at different pressures
  on multiple isotherms T using a numerical optimization algorithm. In this case, the uncertainty of
  and
and  might be reduced somewhat because of the greater number of degrees of freedom. Furthermore, when utilizing a functional relationship B = B(T, b), where the number of fitted parameters
  is less than the number of experimental data points for B, the uncertainties in both temperature (T) and the measured quantity
  will inherently decrease. This arises from the corresponding growth in statistical degrees of freedom, as used in dielectric-constant gas thermometry [29].
Currently, not only precise values of the density virial coefficients, dielectric virial coefficient and diamagnetic virial coefficient for helium-4 have been obtained, as listed in table 1, but also advancements have been made in determining the kT value of OFHC copper and Cu-ETP, thanks to the efforts of Rouke [6], Madonna Ripa et al [13] and the foundational work by Gaiser and Fellmuth [20]. These significant progressions have paved the way for directly determining pairs of values such as (T, B), (T, C) and even (T, D) through the application of the single-isotherm fit RIGT. Indeed, this is the approach employed in the present study.
Table 1. Reference data sources for physical gas properties of helium-4 by ab initio calculation method used in this work.
| Property | Best reference | Value (standard uncertainty) |
|---|---|---|
| Aμ | Puchalski et al [18] | −7.92115(13) × 10−6 cm3 mol−1 |
| A | Puchalski et al [15] | 0.517 254 08(5) cm3 mol−1 |
| B | Garberoglio and Harvey [16] | Sup. Mat.: Beps_He4.dat 10−3 × second col. (10−3 × half of third col.) |
| C | Garberoglio et al [17] | Table Ⅲ second col. (half of third col.) |
| B | Czachorowski et al [2] | Sup. Inf.: S4_virial_helium-4.txt second col. (third col.) |
| C | Binosi et al [3] | Table I second col. (half of third col.) |
| D | Garberoglio and Harvey [4] | Table I eighth col. (half of ninth col.) |
2.3. Uncertainty evaluation in RIGT
Here below only the determination of u(T) and u(B) is demonstrated, same for the pairs of values u(T) and u(C). Note that henceforth all uncertainties denote standard uncertainties unless otherwise stated.
The thermodynamic temperature T and the second density virial coefficient B are determined simultaneously by extrapolation of RIGT presented in section 2.2, using Levenberg–Marquardt optimization method. The same numerical relation can also be used to estimate the first derivatives of T and B with respect to the input parameters  , which are necessary to calculate their uncertainty budgets.
T and B are functions of the input parameters  , which is a long column vector. Each
  is a short column vector with I elements for I pressures, in the present work I = 4 corresponding to the four pressures 30 kPa, 60 kPa, 90 kPa and 120 kPa.
Due to the absence of experimentally accessible methods to isolate and quantify potential correlations between these variables, a conservative approach was adopted by treating them as uncorrelated throughout all uncertainty calculations in this work, unless explicitly stated otherwise.
where Y denotes either T or B; and m is the number of the type of input parameter of  .
.
For  , the variable
  can be estimated by

since they are functions of temperature only or constants on the isotherm, no matter under what pressures in gaseous phase.
As for pressure measurements, the main uncertainty component arises from the effective area of the piston,  , as shown in table 2 of our related article [30] with proportion 75.0% for 30 kPa, 90.9% for 60 kPa, 95.7% for 90 kPa and 96.8% for 120 kPa. This means the uncertainties of different pressures are almost totally correlated. Therefore, when the uncertainty contribution from p for T and B is calculated, the uncertainties of each pressure on the isotherm should change at the same time, i.e.
  , the same as in equation (9).
Table 2. Parameters for equations of the second, third and fourth density virial coefficients (B, C, D) and their standard uncertainties determined from ab initio calculations for helium-4.
| Valid range 0.5 K–1000 K | Valid range 0.5 K–3000 K | Valid range 2.6 K–2000 K | ||||||||||
|---|---|---|---|---|---|---|---|---|---|---|---|---|
| i | Y = B [2] | Y = u(B) [2] | Y = C [3] | Y = u(C) [3] | Y = D [4] | Y = u(D) [4] | ||||||
| ai | bi | ai | bi | ai | bi | ai | bi | ai | bi | ci | di | |
| 1 | −1.270 966 69 × 104 | −6.25 | 2.860 082 × 10−2 | −2.25 | 3.288 773 × 106 | −8.75 | 1.957 608 × 102 | −5.5 | −5.617 018 × 1010 | −10 | −5.752 223 × 10−1 | −2 |
| 2 | 6.372 139 34 × 104 | −6 | 3.162 001 × 10−2 | −1 | −1.051 565 × 107 | −8.5 | 2.810 140 × 101 | −2.25 | 4.737 802 × 1010 | −9.75 | 2.504 556 | −1.25 |
| 3 | −1.209 106 12 × 105 | −5.75 | 7.428 434 × 10−5 | −0.25 | 9.498 349 × 106 | −8.25 | 1.486 088 × 10−1 | −0.5 | −2.140 388 × 108 | −5.75 | −9.514 289 × 10−3 | 5 |
| 4 | 1.030 521 15 × 105 | −5.5 | −2.333 341 × 106 | −7.75 | 7.882 609 × 106 | −3 | 7.046 669 × 10−4 | 9.75 | ||||
| 5 | −3.334 308 59 × 104 | −5.25 | −5.747 775 × 104 | −2.75 | −5.856 457 × 105 | −1.5 | −5.006 727 × 10−4 | 10 | ||||
| 6 | 4.083 929 80 × 102 | −2.5 | −1.104 962 × 104 | −2 | 9.803 476 × 104 | −1 | ||||||
| 7 | −4.204 252 23 × 102 | −2 | 3.778 635 × 104 | −1.5 | 2.400 630 × 104 | −0.5 | ||||||
| 8 | −3.491 860 97 × 102 | −0.75 | −1.528 505 × 104 | −0.75 | −4.129 452 × 103 | −0.25 | ||||||
| 9 | 7.574 614 15 × 101 | −0.25 | 8.672 185 × 103 | −0.5 | 1.903 792 × 101 | 0.25 | ||||||
| 10 | −3.930 778 81 × 10−1 | 0.25 | −8.956 832 × 102 | −0.25 | ||||||||
| 11 | 1.435 005 88 × 10−3 | 0.75 | 2.775 174 × 101 | 0 | ||||||||
As for microwave measurements, the resonance frequencies measured under pressures, fp, for each microwave mode have different uncertainties,  . The variable
  of frequency under pressure
  was estimated from the solution of the following equations

where i = 1, 2, 3, 4, corresponding to the four pressures  kPa.
kPa.
Besides the above uncertainty components, the other four uncertainty contributions were also considered in the determination of u(T) and u(B). They arise from isotherm temperature stability  , microwave self-heating effects
  , the fitting model
  , and the mode scatter uncertainty, i.e. the spread of values determined by using different microwave modes
  .
.
The isotherm temperature stability uncertainty,  , includes two parts, one from the control temperature instability at each pressure with values less than 10 μK, and the other from the temperature difference at different pressures on the isotherm with typical values below 10 μK. The microwave self-heating effect uncertainty
  is much smaller, about 2 μK. The fitting model
  uses the Levenberg–Marquardt optimization algorithm to minimize
  . In the fitting, we can obtain not only T and B, but also their fitted standard uncertainties u(T) and u(B) related to the fitted model. The mode scatter uncertainty
  is calculated from the standard deviations of T and B values determined from the three microwave modes (TM11, TE11, TE13).
2.4. Equations for density virial coefficients
To better compare the results, we fitted the density virial coefficients and their uncertainties of helium-4, derived from the-state-of-art ab initio methods in literature, as smooth functions of temperature as the following two equations.
where Y represents B, C and D, along with their uncertainties u(B) and u(C). [Y] indicates the unit of Y, which is cm3·mol−1 for B and u(B), cm6·mol−2 for C and u(C), cm9⋅mol−3 for D and u(D).
Table 2 presents the parameters in the equations of the second, third, and fourth density virial coefficients (B [2], C [3], D [4]) and their standard uncertainties, determined through ab initio calculations, for helium-4. The valid temperature ranges for these coefficients and their uncertainties are: 0.5 K to 1000 K for B and u(B), 0.5 K to 3000 K for C and u(C), and 2.6 K to 2000 K for D and u(D).
Figure 2 illustrates the relative residuals of (B, C, D) against their standard uncertainties within these ranges. Specifically, the residuals of B are within 0.6 times u(B) across the entire range. For C, the residuals are within 1.5 times u(C) except at 6 K, where it is within 2 times u(C). For D, the residuals are within 1.6 times u(D) covering the whole range. For the relative residuals of their standard uncertainties, they do not exceed 5% of u(B), 30% of u(C), and 30% of u(D) except at 8 K up to 45%. The equations (12) and (13) are sufficient for describing the ab initio calculated data and enabling comparisons with the data obtained in this work.
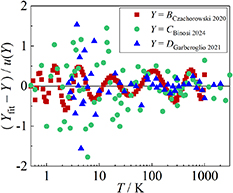
Figure 2. Relative residuals of the (B, C, D) equations (equation (12)) for helium 4. Ab initio data: B, Cachorowski et al [2]; C, Binosi et al. [3]; D, Garberoglio and Harvey [4].
Download figure:
Standard image High-resolution image3. Determination of isothermal compressibility
3.1. Measurement of the effective isothermal compressibility near neon triple point
The operational temperature range of our SPRIGT system (5 K–25 K) limits direct application of the reference methodology [6, 13], which requires precision measurements at the water triple point (TTPW, 273.16 K). We therefore developed an adapted methodology for determining κT in the vicinity of the neon triple point (TTPNe, 24.5561 K) through microwave measurements. This approach balances metrological rigor with practical constraints imposed by the system’s cryogenic operating regime, while maintaining traceability to primary thermometric standards through coordinated calibration protocols. The details will be introduced in this section.
3.1.1. Experimental method.
Experimental methods for the determination of the effective isothermal compressibility of the resonator have been reported in [6, 13]. From the equations (4) and (6), the isothermal compressibility κT can be experimentally determined by resonant frequency measurements at a thermodynamic state with known n and p. If measurements under multiple pressures on a known isotherm were implemented, κT can be derived by minimizing the objective function, |nexpt − ntheo|2, where the theoretical refractive index of the working gas ntheo is obtained from equations (4) and (5).
This was implemented in this work to obtain the κT value of our resonator by using the experimental data in our previous work [8], where resonant frequencies were measured at a known reference thermodynamic temperature Tref under four pressures, 30 kPa, 60 kPa, 90 kPa and 120 kPa. The Tref (= 24.554 98 K) was directly reproduced at the calibrated temperature value near triple point of neon by AGT with an offset of only 13 μK. The combined standard uncertainty of Tref is 0.17 mK, including the calibration uncertainty of 160 μK, and reproducibility of 60 μK [8]. The corresponding T90,ref (= 24.555 32 K) is the weighted readings of the three rhodium-iron resistance thermometers with standard uncertainty of 0.21 mK [8].
3.1.2. Experimental results.
Based on the above method, experimental isothermal compressibility κT and uncertainty u(κT) of the resonator was determined for the six microwave modes (TM11, TE11, TE12, TM13, TE13, TE14) at temperature near triple point of neon in this work. The results are listed in table 3. Good agreement was observed for κT among various microwave modes, with the exception of the TE12 mode, whose result deviated slightly but remained within an acceptable range. To increase reliability, average values of κT, avg and u(κT, avg) were derived as κT, avg6 = 7.01 (13) TPa−1 and κT, avg3 = 7.05 (10) TPa−1, corresponding to the six microwave modes and the three specific modes (TM11, TE11, TE13), respectively. The latter set of modes is consistent with those used in our previous work [5].
Table 3. Uncertainty budget for the determination of isothermal compressibility kT of Cu-ETP at temperature close to 24.5 K. All values of uncertainty contribution are in TPa−1. The three largest contributions in u(kT) are in boldface.
| No. | Uncertainty component | TM11 | TE11 | TE12 | TM13 | TE13 | TE14 | Average of 6 Modes | Average of 3 Modesa |
|---|---|---|---|---|---|---|---|---|---|
| 1 | TAGT measurement uncertainty  | 0.078 | 0.078 | 0.078 | 0.078 | 0.078 | 0.078 | 0.078 | 0.078 |
| 2 | Vacuum frequency  | 0.0016 | 0.0018 | 0.0047 | 0.0054 | 0.0046 | 0.0038 | 0.0036 | 0.0027 |
| 3 | Frequency under pressure  | 0.0052 | 0.0050 | 0.0065 | 0.0081 | 0.0063 | 0.0061 | 0.0062 | 0.0055 |
| 4 | Absolute pressure  | 0.061 | 0.061 | 0.061 | 0.061 | 0.061 | 0.061 | 0.061 | 0.061 |
| 5 | Hydrostatic head  | 0.0041 | 0.0041 | 0.0041 | 0.0041 | 0.0041 | 0.0041 | 0.0041 | 0.0041 |
| 6 | Pressure stability  | 0.000 46 | 0.000 46 | 0.000 46 | 0.000 46 | 0.000 46 | 0.000 46 | 0.000 46 | 0.000 46 |
| 7 | Second density virial coefficient  | 0.0075 | 0.0075 | 0.0075 | 0.0075 | 0.0075 | 0.0075 | 0.0075 | 0.0075 |
| 8 | Third density virial coefficient  | 0.000 16 | 0.000 16 | 0.000 16 | 0.000 16 | 0.000 16 | 0.000 16 | 0.000 16 | 0.000 16 |
| 9 | Fourth density virial coefficient  | 0.000 031 | 0.000 031 | 0.000 031 | 0.000 031 | 0.000 031 | 0.000 031 | 0.000 031 | 0.000 031 |
| 10 | First diamagnetic virial coefficient  | 0.000 0029 | 0.000 0029 | 0.000 0029 | 0.000 0029 | 0.000 0029 | 0.000 0029 | 0.000 0029 | 0.000 0029 |
| 11 | First dielectric virial coefficient  | 0.0011 | 0.0011 | 0.0011 | 0.0011 | 0.0011 | 0.0011 | 0.0011 | 0.0011 |
| 12 | Second dielectric virial coefficient  | 0.000 97 | 0.000 97 | 0.000 97 | 0.000 97 | 0.000 97 | 0.000 97 | 0.000 97 | 0.000 97 |
| 13 | Third dielectric virial coefficient  | 0.000 056 | 0.000 056 | 0.000 056 | 0.000 056 | 0.000 056 | 0.000 056 | 0.000 056 | 0.000 056 |
| 14 | Fitting model  | 0.0060 | 0.014 | 0.0024 | 0.0078 | 0.0028 | 0.048 | 0.013 | 0.008 |
| 15 | Mode scatter  a a | / | / | / | / | / | / | 0.083 | 0.032 |
| 16 | Combined standard uncertainty | 0.10 | 0.10 | 0.10 | 0.10 | 0.10 | 0.11 | 0.13 | 0.11 |
| TIPC-CAS | Measured kT value each mode | 7.05(10) | 7.08(10) | 6.86(10) | 7.07(10) | 7.02(10) | 6.97(11) | 7.01(13) | 7.05(11) |
| Measured kT value by fitting multiple modes (recommended value) | / | / | / | / | / | / | 7.01(10) | 7.05(10) | |
| NIST | OFHC Cu kT literature value [28, 31] | 7.04(10) | |||||||
| NRC | OFHC Cu kT literature value [6] | 7.044(34) | |||||||
aAverage value determined from the three microwave modes: TM11, TE11 and TE13.
As for the uncertainty, the two main uncertainty components for u(κT) are from the uncertainties of temperature and pressure measurements for each mode. While for u(κT, avg), another main uncertainty component is due to the consistency of different microwave modes. Furthermore, κT, avg and u(κT, avg) were also obtained by fitting multiple modes together using the objective function in section 3.1.1 with κT, avg6 = 7.01 (10) TPa−1 and κT, avg3 = 7.05 (10) TPa−1. This leads to no difference in κT but reduces the uncertainty u(κT) due to the increased degrees of freedom in the fitting process.
Figure 3 shows the comparison between measured κT of Cu-ETP from 6 microwave modes at temperature close to neon triple point and those values from literature [6, 13]. We found that our experimental κT of Cu-ETP has good agreement with extrapolated κT value of Cu-ETP [13], extrapolated κT value of OFHC Cu in [6] and κT of OFHC Cu calculated from literature value [28, 31]. This increases the confidence of the experimentally determined κT in this work.
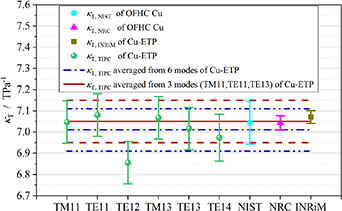
Figure 3. Measured κT of Cu-ETP from 6 microwave modes at the isotherm close to neon triple point. Symbols: circle, κT and combined standard uncertainty u(κT) of OFHC Cu calculated from literature value [28, 31], labeled as κT, NIST; triangle, extrapolated κT and u(κT) of OFHC Cu from literature [6], labeled as κT, NRC; square, extrapolated κT and u(κT) of Cu-ETP from literature [13], labeled as κT, INRiM; sphere, the fitted κT and u(κT) of Cu-ETP from each microwave mode performed at four helium pressures, (30, 60, 90, 120) kPa, labeled as κT, TIPC in this work. Lines: dash dotted and dash dot dotted lines, averaged values of κT, TIPC and u(κT, TIPC) of Cu-ETP from (TM11, TE11, TE12, TM13, TE13, TE14) modes; solid and dashed lines, averaged values of κT, TIPC and u(κT, TIPC) of Cu-ETP from (TM11, TE11, TE13) modes, employed in this work to be consistent with the microwave modes used in Run 10 of SPRIGT [5].
Download figure:
Standard image High-resolution image3.2. Extrapolation of the effective isothermal compressibility to lower temperatures
3.2.1. Extrapolation method.
At a given temperature T90 under the International Temperature Scale of 1990 (ITS-90), the isothermal compressibility κT can be derived from other material properties of the microwave resonator employed, as described in [6, 13, 20, 28]:
where κs is the adiabatic compressibility at the triple point of neon temperature (TTPNe, 24.5561 K). R is the internal radius of the microwave resonator at temperature T under vacuum. δ is the Anderson–Grüneisen parameter and γ is called Grüneisen parameter [13, 20]. αV is the volumetric thermal expansion coefficient, which is equal to 3 times of the linear thermal expansion coefficient αL (defined by dlnR/dT [32]). In this work, γ in [13] and δ in [13, 33, 34] were employed. At the triple point of neon, the difference between κs and κT of the microwave resonator at TTPNe is negligible with a value of 0.000444(11) TPa−1 (well within the experimental uncertainties given in table 4), allowing direct use of our measured κT(TTPNe) as κs(TTPNe) in the modified framework.
Table 4. Extrapolated κT values of copper from multiple laboratories across a temperature range of 5 K–273.16 K.
| T90/K | κT, NIST [28, 31] | κT, NRC [6] | κT, INRIM [13] | κT, TIPC this work |  |  |
|---|---|---|---|---|---|---|
| TPa−1 | TPa−1 | TPa−1 | TPa−1 | |||
| 5.0 | 7.04(10) | 7.043(43)a | / | 7.05(11) | 0.16 | 2.6 |
| 13.8033 | 7.04(10) | 7.043(39)a | 7.071(30) | 7.05(11) | 0.18 | 2.8 |
| 24.5561 | 7.04(10) | 7.044(34) | 7.071(30) | 7.05(10) | 0.18 | 2.9 |
| 54.3584 | 7.06(10) | 7.058(28) | 7.086(30) | 7.06(10) | 0.07 | 3.6 |
| 83.8058 | 7.09(10) | 7.093(21) | 7.122(27) | 7.10(10) | 0.33 | 4.8 |
| 161.405 96 | 7.21(10) | 7.227(12) | 7.260(27) | 7.23(11) | 0.25 | 9.2 |
| 273.16 | 7.45(11) | 7.4540(72) | 7.494(30) | 7.46(11) | 0.83 | 15.3 |
aExtrapolated by applying the methodology and experimental data outlined in [6].
3.2.2. Thermal expansion analysis in vacuum.
Figure 4 presents a comparative analysis of the thermal expansion coefficients between the experimentally measured αL and reference values αL, NIST from 5 K to 290 K. The experimental dataset, derived through multimodal measurement methodology [5], represents statistically averaged values obtained from TM11, TE11, TM12 and TE13 resonant modes. Notably, the measured deviations remain within the single standard deviation envelope (±σ) of αL, NIST throughout the cryogenic range (5 K–200 K), whereas in higher thermal regimes (210 K–290 K), discrepancies expand to double standard deviation thresholds (±2σ). Globally, the agreement between αL and αL, NIST demonstrates better consistency at lower temperature ranges compared to elevated temperatures. We attribute this temperature-dependent discrepancy primarily to thermal instability during measurement procedures. The observed noise levels at higher temperatures are directly linked to the inherent limitations of microwave scanning bandwidth in high-temperature regimes.
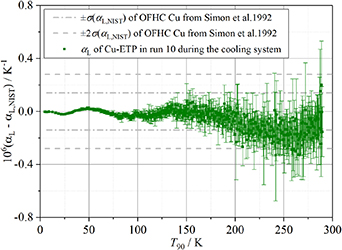
Figure 4. A comparison of the average values of the linear thermal expansion αL experimentally determined from modes TM11, TE11, TM12 and TE13, with those values calculated using the formula of Simon et al [31].
Download figure:
Standard image High-resolution image3.2.3. Extrapolation results from 5 K to 273.16 K.
In this work, the extrapolation of κT (isothermal compressibility) for Cu-ETP was performed following the methodology outlined in [6, 13]. Using equation (14), extrapolated κT values were determined at 5 K and the triple points of equilibrium hydrogen (e-H2), neon (Ne), oxygen (O2), argon (Ar), xenon (Xe), and water (TPW).
These extrapolated κT values for copper are listed in table 4. Figure 5 compares the extrapolated κT results from multiple laboratories over the temperature range of 5 K to 273.16 K, showing good agreement among all four datasets within their combined uncertainties. This indicates that the extrapolated κT in this work is reliable. Notably, the differences between the κT values from TIPC and NRC do not exceed 0.83 × u(κT, NRC) (where u denotes standard uncertainty), with even smaller deviations at lower temperatures, less than 0.2 ×u(κT, NRC) observed in the 5 K–25 K range. In other words, κT, TIPC (this work) and κT, NRC are statistically indistinguishable between 5 K and 25 K. The primary distinction lies in their uncertainties: κT, TIPC exhibits uncertainties 2.6–2.9 times larger than those of κT, NRC. These discrepancies could be further reduced in future work by performing measurements at the triple point of water, following the methodology demonstrated in [6, 13].
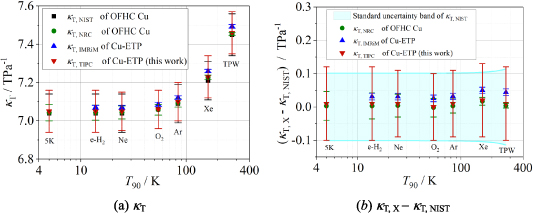
Figure 5. Comparison results of extrapolated κT of copper from multiple laboratories across a temperature range of 5 K–273.16 K. Symbols: square, κT, NIST of OFHC Cu calculated from literature value [28, 31]; circle, extrapolated κT, NRC of OFHC Cu from literature [6]; upper triangle, extrapolated κT, INRiM of Cu-ETP from literature [13]; lower triangle, κT, TIPC of Cu-ETP in this work. The error bar is the standard uncertainty of each κT.
Download figure:
Standard image High-resolution image4. Results and discussions
In this section, we present the results of the pairs of variables (T, B), (T, C), (T, D) using the single-isotherm fit RIGT method. These results are based on the same experimental data as our previous SPRIGT studies [5, 11], in which three different microwave modes (TM11, TE11, TE13) and four pressures (30 kPa, 60 kPa, 90 kPa, 120 kPa) as opposed to one were used to enhance the reliability of measurements. In this work, various ab initio virial coefficients of 4He listed in table 1 were employed. Furthermore, the values of isothermal compressibility, kT, were derived using the methodology developed by Gaiser and Fellmuth [20] and subsequently refined by Rouke [6] and Madonna Ripa et al [13].
4.1. Determination of T and B
4.1.1. Uncertainty budget.
Based on the method presented in section 2.3, uncertainty budgets were calculated for T and B, as shown in table 5. Combining the uncertainty components in quadrature from all sources listed in the table, we obtain the standard uncertainties in the T and B, u(T) and u(B). Figure 6 shows the uncertainty components for u(T) and u(B) at temperatures from 5 K to 24.5 K.
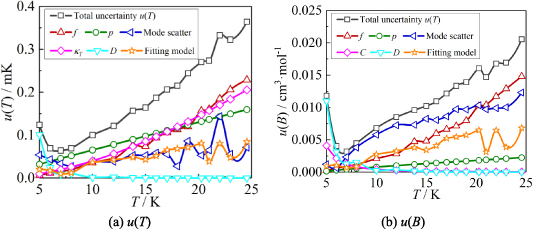
Figure 6. The six largest uncertainty components for T and B determined by the single-isotherm fit RIGT in this work. At the lowest temperature, the uncertainty originating from the fourth density virial coefficient D [4] becomes the dominant contribution to both u(T) and u(B).
Download figure:
Standard image High-resolution imageTable 5. Uncertainty budget for the determination of thermodynamic temperature T and the second density virial coefficient B by the single-isotherm fit RIGT at temperatures close to 5 K, 13.8 K and 24.5 K. All values of uncertainty contribution are in microkelvin (μK) for u(T) and in cm3 mol−1 for u(B). The five largest contributions in each column are in boldface.
| No. | Uncertainty component | T = 24.55538 K | B= 0.954 cm3 mol−1 | T = 13.80431 K | B= −11.845 cm3 mol−1 | T = 5.00028 K | B= −64.299 cm3 mol−1 |
|---|---|---|---|---|---|---|---|
| 1 | Isotherm temperature stability  | 21 | 1.4 × 10⁻⁵ | 3 | 6 × 10⁻⁶ | 2 | 3.2 × 10⁻⁵ |
| 2 | Microwave self-heating  | 2 | 1 × 10⁻⁶ | 2 | 4 × 10⁻⁶ | 2 | 3.3 × 10⁻⁵ |
| 3 | Vacuum frequency  | 172 | 0.0088 | 61 | 0.0031 | 5 | 0.00015 |
| 4 | Frequency under pressure  | 151 | 0.012 | 47 | 0.0036 | 4 | 0.000 21 |
| 5 | Compressibility  | 205 | 2.7 × 10⁻⁵ | 74 | 1.1 × 10⁻⁴ | 10 | 1.7 × 10⁻⁴ |
| 6 | Absolute pressure  | 159 | 0.0022 | 89 | 0.0012 | 31 | 0.000 13 |
| 7 | Hydrostatic head  | 9 | 2 × 10⁻⁵ | 9 | 8 × 10⁻⁷ | 8 | 7 × 10⁻⁵ |
| 8 | Pressure stability  | 3 | 1.7 × 10⁻⁴ | 1 | 4 × 10⁻⁵ | <1 | 4 × 10⁻⁵ |
| 9 | Third density virial coefficient  | <1 | 5 × 10⁻⁵ | 1 | 0.000 15 | 28 | 0.004 |
| 10 | Fourth density virial coefficient  | ≪1 | 1 × 10⁻⁵ | 1 | 0.000 18 | 101 | 0.011 |
| 11 | First diamagnetic virial coefficient  | ≪1 | 6 × 10⁻⁸ | ≪1 | 6 × 10⁻⁷ | ≪1 | 3 × 10⁻⁶ |
| 12 | First dielectric virial coefficient  | 2 | 2 × 10⁻⁷ | 1 | 6 × 10⁻⁷ | <1 | 3 × 10⁻⁶ |
| 13 | Second dielectric virial coefficient  | ≪1 | 1.7 × 10⁻⁴ | ≪1 | 1.7 × 10⁻⁴ | 1 | 9 × 10⁻⁵ |
| 14 | Third dielectric virial coefficient  | ≪1 | 2 × 10⁻⁵ | <1 | 3 × 10⁻⁵ | 1 | 0.0001 |
| 15 | Fitting model  | 85 | 0.0068 | 48 | 0.0038 | 19 | 0.0009 |
| 16 | Mode scatter  a a | 72 | 0.012 | 53 | 0.0073 | 54 | 0.0012 |
| 17 | Combined standard uncertainty | 364 | 0.021 | 157 | 0.010 | 124 | 0.012 |
aAverage value determined from the three microwave modes: TM11, TE11 and TE13 [5].
From figure 6(a), it is clear that in the temperature range 19 K–25 K, the dominant contribution for u(T) is the frequency uncertainties  and isothermal compressibility κT. The former is a combination of values in vacuum
  and under different pressures
  , which can be reduced with the help of microwave amplifiers as shown in literature [35, 36], while the latter can be further reduced in future work by following the methodology demonstrated in [6]. For 6 K–19 K, the pressure uncertainties
  becomes the dominant contribution for u(T), which is a combined uncertainty of that of the absolute pressure calibration
  , pressure stability
  and the uncertainty of the static head correction
  . The term
  is the main uncertainty component for
  , see table 5. At lowest temperature of 5 K, the uncertainties of the fourth density virial coefficient D [4] become the dominant contribution with the helium departs from ideal gas behavior. In the temperature range concerned, the maximum overall uncertainty of T is approximately 364 µK at temperature near 24.5 K, while the minimum is about 64 µK near 7 K.
From figure 6(b), we can see that in the temperature range 20 K–25 K, the three largest contributions for u(B) are the frequency uncertainties  , mode average of the three microwave modes
  , and fitting model
  , which could be reduced by using the multiple-isotherm fit RIGT with additional pressure data on the isothermal. For 7 K–20 K, the scatter of frequency measurements between the three microwave modes becomes the dominant contribution to u(B). This means the microwave measurements are the key aspect of high accuracy determination of the second density virial coefficient at higher temperatures. Like u(T), the uncertainties in the fourth density virial coefficient D [4] become the dominant contribution for u(B) as helium-4 departs increasingly from ideal gas behavior from 6 K down to 5 K. Unlike u(T), the uncertainty of isothermal compressibility
  and that of the pressure uncertainties
  are no longer the main uncertainty component for u(B). In the temperature range of interest, the maximum overall uncertainty of B is approximately 0.021 cm3 mol−1 at temperature near 24.5 K, whereas the minimum is about 0.0032 cm3 mol−1 at temperature approaching 7 K.
4.1.2. Comparison results.
Figure 7 shows the comparison results of T and B for 4He at temperatures from 5.0 K to 24.5 K, while table 6 provides the corresponding numerical values, associated uncertainty, and TRIGT T90 results. The latter quantifies the deviations between the measured temperature T and the ITS-90 temperature T90, following the same methodology as in our previous work [5, 11].
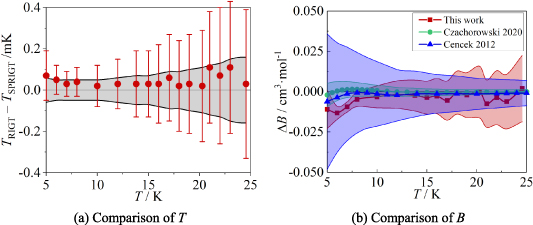
Figure 7. Comparison results for T and B. (a) TRIGT, determined by the single-isotherm fit RIGT in this work, the error bar denotes the uncertainty of TRIGT; TSPRIGT, determined by SPRIGT (a relative RIGT) in our previous work [11], the grey area denotes the uncertainty of TSPRIGT. (b) ΔB = B BEquation 12. Red square and shading show the differences and the standard uncertainty of B determined in this work. Green circle and shading show the results and the standard uncertainty of BCzachorowski of 4He from Czachorowski et al [2]. Blue upper triangle and shading show the differences and the standard uncertainty of BCencek of 4He from Cencek et al [23].
Download figure:
Standard image High-resolution imageTable 6. Thermodynamic temperature T and the second density virial coefficient B determined by the single-isotherm fit RIGT.
| TRIGT/K | u(TRIGT)/mK | B/cm3·mol−1 | u(B)/cm3·mol−1 | T90,CAS/Ka | u(T90,CAS)/mKa | TRIGT T90,CAS/mK T90,CAS/mK | u(TRIGT T90,CAS)/mK T90,CAS)/mK |
|---|---|---|---|---|---|---|---|
| 24.555 38 | 0.36 | 0.954 | 0.021 | 24.555 70 | 0.21 | −0.32 | 0.42 |
| 23.000 36 | 0.32 | −0.145 | 0.017 | 23.000 46 | 0.20 | −0.10 | 0.38 |
| 21.999 80 | 0.33 | −0.929 | 0.017 | 21.999 78 | 0.18 | 0.02 | 0.38 |
| 20.998 39 | 0.27 | −1.799 | 0.015 | 20.998 13 | 0.16 | 0.26 | 0.31 |
| 20.267 92 | 0.27 | −2.480 | 0.016 | 20.267 62 | 0.16 | 0.30 | 0.31 |
| 18.998 76 | 0.24 | −3.807 | 0.014 | 18.998 17 | 0.18 | 0.59 | 0.30 |
| 17.999 79 | 0.22 | −4.983 | 0.013 | 17.999 07 | 0.20 | 0.72 | 0.30 |
| 17.033 95 | 0.21 | −6.263 | 0.012 | 17.033 10 | 0.20 | 0.85 | 0.29 |
| 16.000 15 | 0.19 | −7.798 | 0.011 | 15.999 31 | 0.20 | 0.84 | 0.28 |
| 15.000 65 | 0.16 | −9.492 | 0.010 | 14.999 86 | 0.18 | 0.79 | 0.24 |
| 13.804 31 | 0.16 | −11.845 | 0.010 | 13.803 66 | 0.14 | 0.65 | 0.21 |
| 12.000 55 | 0.12 | −16.294 | 0.009 | 12.000 15 | 0.12 | 0.40 | 0.17 |
| 10.000 96 | 0.10 | −23.122 | 0.007 | 10.000 70 | 0.12 | 0.26 | 0.16 |
| 8.001 01 | 0.07 | −33.386 | 0.004 | 8.000 67 | 0.10 | 0.34 | 0.12 |
| 7.000 29 | 0.06 | −40.737 | 0.003 | 6.999 89 | 0.09 | 0.40 | 0.11 |
| 6.000 11 | 0.07 | −50.545 | 0.004 | 5.999 66 | 0.10 | 0.45 | 0.12 |
| 5.000 28 | 0.12 | −64.299 | 0.012 | 4.999 88 | 0.08 | 0.40 | 0.14 |
aValues are the same as those in table 9 of our previous work [5]. The subscript CAS means the T90 values are the weighted ones of the three calibrated rhodium iron resistance thermometers (RIRTs).
From figure 7(a), it is apparent there is good agreement between TRIGT determined by the single-isotherm fit RIGT in this work and TSPRIGT determined earlier by SPRIGT [5, 11]. All the TRIGT TSPRIGT differences lie within their uncertainties in the temperature range concerned, which suggests the determinations of T and B are reliable.
Figure 7(b) shows a comparison between the experimentally determined B of 4He obtained in this work and the ab initio calculation results reported by BCencek [23] and BCzachorowski [2]. Values of the coefficients BCzachorowski, BThis work and BCencek agree well with differences within their uncertainties in the temperature range concerned. This suggests once more that the present determination of B is reliable.
As for the uncertainty of B, figure 7(b) shows that u(BThis work) falls below u(BCencek) at temperatures below 16 K. The ratio of u(BCencek)/u(BThis work) can be up to 2.8 at 5 K. It shows that the uncertainties u(BCencek) estimated previously by other authors were too conservative [2]. Besides, it also suggests strongly that values of the second virial coefficients of 4He from Czachorowski et al [2] are the most accurate. Taking together, these findings should improve the accuracy of temperature and pressure measurements with 4He as the working gas.
4.2. Determination of T and C
So far, the reliability of the new values of B and u(B) [2] has been confirmed by direct evaluation method as in this work. Therefore, we are interested in assessing the reliability of the values of C and u(C) of 4He from Garberoglio et al [37] and new values from Binosi et al [3] by comparing them with the high accuracy experimental values determined here.
4.2.1. Uncertainty budget.
Based on the method presented in section 2.3, and latest values of B and u(B) from [2], uncertainty budgets of T and C were carried out. The results are shown in table 7. Combining the uncertainty components in quadrature from all sources listed in the table, we obtain the standard uncertainties u(T) and u(C). Figure 8 shows the uncertainty components for u(T) and u(C) at temperatures from 5.0 K to 24.5 K.
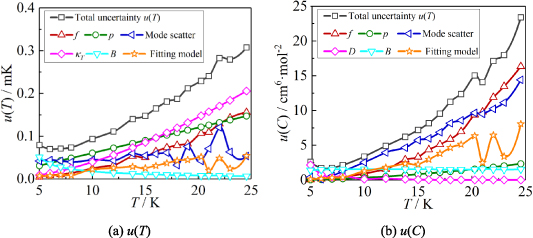
Figure 8. The six largest uncertainty components for T and C determined by the single-isotherm fit RIGT in this work. At the lowest temperature, the uncertainties originating from the second and fourth density virial coefficient B [2] and D [4] become the dominant component for u(T) and u(C), respectively.
Download figure:
Standard image High-resolution imageTable 7. Uncertainty budget for the determination of thermodynamic temperature T and the third density virial coefficient C by the single-isotherm fit RIGT at temperatures close to 5 K, 13.8 K and 24.5 K. All values of uncertainty contribution are in microkelvin (μK) for u(T) and in cm6 mol−2 for u(C). The five largest contributions in each column are in boldface.
| No. | Uncertainty component | T = 24.55540 K | C= 275.0 cm6 mol−2 | T = 13.80431 K | C= 397.4 cm6 mol−2 | T = 5.00024 K | C= 982.7 cm6 mol−2 |
|---|---|---|---|---|---|---|---|
| 1 | Isotherm temperature stability  | 21 | 1.2 × 10⁻⁴ | 3 | 6.1 × 10⁻⁵ | 2 | 2.4 × 10⁻⁴ |
| 2 | Microwave self-heating  | 2 | 1.1 × 10⁻⁵ | 2 | 4.7 × 10⁻⁵ | 2 | 2.6 × 10⁻⁴ |
| 3 | Vacuum frequency  | 125 | 9.4 | 44 | 1.8 | 4 | 0.029 |
| 4 | Frequency under pressure  | 93 | 13 | 29 | 2.3 | 3 | 0.040 |
| 5 | Compressibility  | 206 | 0.012 | 73 | 0.09 | 9 | 0.037 |
| 6 | Absolute pressure  | 147 | 2.3 | 83 | 0.68 | 30 | 0.021 |
| 7 | Hydrostatic head  | 9 | 0.015 | 8 | 0.0068 | 8 | 0.016 |
| 8 | Pressure stability  | 2 | 0.18 | 1 | 0.011 | <1 | 0.011 |
| 9 | Second density virial coefficient  | 7 | 1.5 | 12 | 1.6 | 51 | 1.4 |
| 10 | Fourth density virial coefficient  | ≪1 | 0.0074 | <1 | 0.12 | 28 | 2.2 |
| 11 | First diamagnetic virial coefficient  | ≪1 | 0.0065 | ≪1 | 0.0073 | <1 | 0.0031 |
| 12 | First dielectric virial coefficient  | 2 | 0.0067 | 1 | 0.0067 | <1 | 0.0025 |
| 13 | Second dielectric virial coefficient  | 1 | 0.21 | 1 | 0.11 | 1 | 0.018 |
| 14 | Third dielectric virial coefficient  | ≪1 | 0.026 | ≪1 | 0.026 | <1 | 0.022 |
| 15 | Fitting model  | 54 | 8.1 | 29 | 2.3 | 7 | 0.12 |
| 16 | Mode scatter  a a | 54 | 14 | 60 | 4.7 | 42 | 0.39 |
| 17 | Combined standard uncertainty | 308 | 23 | 140 | 6.2 | 79 | 2.6 |
aAverage value determined from the three microwave modes: TM11, TE11 and TE13 [5].
From figure 8(a), it is clear that in the temperature range 17 K–25 K, the dominant contribution for u(T) are uncertainty of isothermal compressibility  and those of pressure
  and frequency
  with nearly the same values. The pressure uncertainty
  becomes the largest contribution for u(T) in the range 8 K–17 K, the main uncertainty component of which is
  . At lower temperatures down to 5 K, the uncertainties of the second density virial coefficient B [2] become dominant as helium exhibits increasingly non-ideal gas behaviors. In the investigated temperature range, the maximum overall uncertainty in T is approximately 308 µK at temperature near 24.5 K, while the minimum is about 70 µK at temperature close to 6 K.
From figure 8(b), we can see that in the temperature range 14 K–25 K, the three largest contributions for u(C) are the frequency uncertainties  , mode consistency of the three microwave modes
  , and fitting model
  . For 10 K–20 K, the mode consistency of the three microwave modes becomes the dominant contribution for u(C). For 6 K–10 K, the uncertainties of the second density virial coefficient B [2] become the dominant contribution for u(C). At lower temperatures down to 5 K, where helium-4 behaves less like an ideal gas, the uncertainty associated with the fourth density virial coefficient D [4] becomes the dominant contribution. In the investigated temperature range, the uncertainty of isothermal compressibility
  and that of the pressure uncertainties
  are not the main uncertainty components for u(C). The maximum overall uncertainty of C is approximately 23 cm6 mol−2 at temperature approaching 24.5 K, while the minimum is about 1.7 cm6 mol−2 at temperature around 6 K.
4.2.2. Comparison results.
Figure 9 shows the comparison results for T and C of 4He at temperatures from 5.0 K to 24.5 K, while table 8 lists the corresponding numerical values, associated uncertainty, and  results. From figure 9(a), we can see that there is good agreement between TRIGT determined by the single-isotherm fit RIGT in this work and TSPRIGT determined by SPRIGT in our earlier work [11]. All the
  differences lie within their uncertainties, which boosts confidence in the experimental determination of T and C.
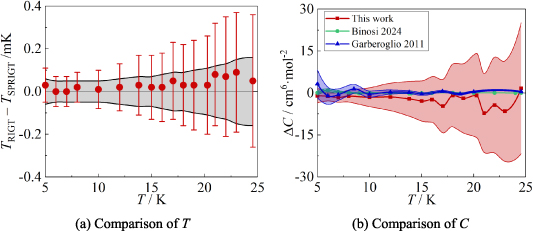
Figure 9. Comparison results for T and C. (a) TRIGT, determined by the single-isotherm fit RIGT in this work, the error bar denotes the uncertainty of TRIGT; TSPRIGT, determined by SPRIGT (a relative RIGT) in our previous work [11], the grey area denotes the uncertainty of TSPRIGT. (b) ΔC = C CEquation 12. Red square and shading show the differences and the standard uncertainty of C determined in this work. Green circle and shading show the results and the standard uncertainty of CBinosi of 4He from Binosi et al [3]. Blue upper triangle and shading show the differences and the standard uncertainty of CGarberoglio of 4He from Garberoglio et al [37].
Download figure:
Standard image High-resolution imageTable 8. Thermodynamic temperature T and the third density virial coefficient C determined by the single-isotherm fit RIGT.
| TRIGT/K | u(TRIGT)/mK | C/cm6 · mol−2 | u(C)/cm6 · mol−2 | T90,CAS/Ka | u(T90,CAS)/mKa | TRIGT T90,CAS/mK T90,CAS/mK | u(TRIGT T90,CAS)/mK T90,CAS)/mK |
|---|---|---|---|---|---|---|---|
| 24.55540 | 0.31 | 275.0 | 23 | 24.55570 | 0.21 | −0.30 | 0.37 |
| 23.00034 | 0.28 | 276.5 | 18 | 23.00046 | 0.20 | −0.12 | 0.34 |
| 21.99980 | 0.28 | 285.7 | 17 | 21.99978 | 0.18 | 0.02 | 0.33 |
| 20.99836 | 0.24 | 290.8 | 14 | 20.99813 | 0.16 | 0.23 | 0.29 |
| 20.26793 | 0.23 | 303.4 | 15 | 20.26762 | 0.16 | 0.31 | 0.28 |
| 18.99876 | 0.21 | 314.9 | 12 | 18.99817 | 0.18 | 0.59 | 0.28 |
| 17.99980 | 0.19 | 327.4 | 11 | 17.99907 | 0.20 | 0.73 | 0.28 |
| 17.033 94 | 0.18 | 336.2 | 9.5 | 17.033 10 | 0.20 | 0.84 | 0.27 |
| 16.000 14 | 0.16 | 354.2 | 8.2 | 15.999 31 | 0.20 | 0.83 | 0.26 |
| 15.000 64 | 0.15 | 371.3 | 7.2 | 14.999 86 | 0.18 | 0.78 | 0.23 |
| 13.804 31 | 0.14 | 397.4 | 6.2 | 13.803 66 | 0.14 | 0.65 | 0.20 |
| 12.000 54 | 0.11 | 448.1 | 4.9 | 12.000 15 | 0.12 | 0.39 | 0.16 |
| 10.000 95 | 0.09 | 529.0 | 3.4 | 10.000 70 | 0.12 | 0.25 | 0.15 |
| 8.000 99 | 0.07 | 655.2 | 2.1 | 8.000 67 | 0.10 | 0.32 | 0.12 |
| 7.000 26 | 0.07 | 743.5 | 1.7 | 6.999 89 | 0.09 | 0.37 | 0.11 |
| 6.000 06 | 0.07 | 854.7 | 1.7 | 5.999 66 | 0.10 | 0.40 | 0.12 |
| 5.000 24 | 0.08 | 982.7 | 2.6 | 4.999 88 | 0.08 | 0.36 | 0.11 |
aValues are the same as those in table 9 of our previous work [5]. The subscript CAS means the T90 values are the weighted ones of the three calibrated RIRTs.
Figure 9(b) compares the C values determined experimentally in this work with the ab initio calculation results for 4He reported by Garberoglio et al [37] and Binosi et al [3]. It is evident that CThis work, CBinosi and CGarberoglio show good agreement with differences within their combined standard uncertainties in the temperature range of interest. This reinforces confidence in the values of CThis work, CBinosi and CGarberoglio. Furthermore, regarding the uncertainty of C, it is notable that u(CThis work) becomes lower than u(CGarberoglio) for temperatures below 7 K. Specifically, at 5 K, u(CGarberoglio) could be improved by a factor of u(CGarberoglio)/u(CThis work) ≈ 2, which indicates that the previously estimated uncertainties u(CGarberoglio) maybe too conservative. Additionally, the findings strongly suggest that the third virial coefficients of 4He reported by Binosi et al [3] are the most precise one. Taking together, these findings on B and C should enhance the accuracy of temperature and pressure measurements utilizing 4He as the working gas in future.
4.3. Determination of T and D
So far, the reliability of the new values of B and u(B) [2] and C and u(C) [3] have been confirmed by direct evaluation method as in this work. From sections 3.1 and 3.2, we know that the values of D and u(D) play an important role in the determination of values of T, B and C at lower temperatures close to 5 K. Therefore, we are interested in assessing the reliability of the values of D and u(D) of 4He from Shaul et al [24] and Garberoglio et al [4] by comparing them with the high accuracy experimental values determined here.
4.3.1. Uncertainty budget.
Based on the method outlined in section 2.3 and utilizing latest values of B and u(B) from [2], as well as the updated values of C and u(C) from [3], the uncertainty budgets for T and D were evaluated. The results are shown in table 9. Combining the uncertainty components in quadrature from all sources listed in the table, we obtained the standard uncertainties u(T) and u(D). Figure 10 shows the uncertainty components for u(T) and u(D) at temperatures from 5.0 K to 24.5 K.
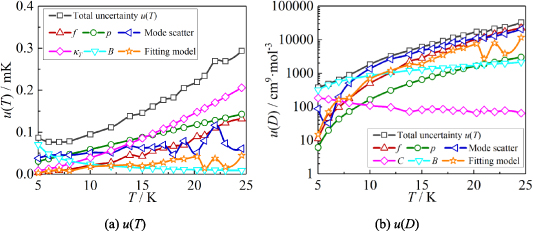
Figure 10. The six largest uncertainty components for T and D determined by the single-isotherm fit RIGT in this work. At higher temperatures, the uncertainty of D is abnormal, since the impact of the D was too small and therefore drowned by the background noise of measurements. At lowest temperature, the uncertainties originating from the second and third density virial coefficient B [2] and C [3] become the dominant component for u(T) and u(D), respectively.
Download figure:
Standard image High-resolution imageTable 9. Uncertainty budget for the determination of thermodynamic temperature T and the fourth density virial coefficient D by the single-isotherm fit RIGT at temperatures close to 5 K, 13.8 K and 24.5 K. All values of uncertainty contribution are in microkelvin (μK) for u(T) and in cm9mol−3 for u(D). The five largest contributions in each column are in boldface.
| No. | Uncertainty component | T = 7.00025 K | D = 8271 cm9 mol−3 | T = 6.00004 K | D= 12 660 cm9 mol−3 | T = 5.00023 K | D= 19 260 cm9 mol−3 |
|---|---|---|---|---|---|---|---|
| 1 | Isotherm temperature stability  | 8 | ≪1 | 2 | ≪1 | 2 | ≪1 |
| 2 | Microwave self-heating  | 2 | ≪1 | 2 | ≪1 | 2 | ≪1 |
| 3 | Vacuum frequency  | 7 | 46 | 5 | 22 | 3 | 6 |
| 4 | Frequency under pressure  | 6 | 86 | 4 | 40 | 2 | 10 |
| 5 | Compressibility  | 18 | 16 | 12 | 11 | 8 | 7 |
| 6 | Absolute pressure  | 41 | 43 | 35 | 20 | 29 | 5 |
| 7 | Hydrostatic head  | 9 | 3 | 9 | 3 | 9 | 3 |
| 8 | Pressure stability  | 1 | 6 | 1 | 2 | <1 | 2 |
| 9 | Second density virial coefficient  | 38 | 563 | 48 | 448 | 70 | 319 |
| 10 | Third density virial coefficient  | 2 | 151 | 5 | 169 | 11 | 184 |
| 11 | First diamagnetic virial coefficient  | <1 | 3 | <1 | 2 | <1 | <1 |
| 12 | First dielectric virial coefficient  | 1 | 3 | 1 | 2 | <1 | <1 |
| 13 | Second dielectric virial coefficient  | <1 | 3 | <1 | 2 | <1 | <1 |
| 14 | Third dielectric virial coefficient  | <1 | 7 | <1 | 5 | <1 | 5 |
| 15 | Fitting model  | 10 | 165 | 7 | 71 | 3 | 15 |
| 16 | Mode scatter  a a | 46 | 197 | 44 | 33 | 38 | 88 |
| 17 | Combined standard uncertainty | 77 | 646 | 77 | 487 | 87 | 379 |
aAverage value determined from the three microwave modes: TM11, TE11 and TE13 [5].
From figure 10(a), it is clear that in the temperature range 10 K–25 K, the dominant contribution for u(T) are those of isothermal compressibility  , pressure
  , frequency
  and mode consistency of the three microwave modes
  . At lower temperatures down to 5 K, the uncertainties of the second density virial coefficient B become the dominant contribution as helium exhibits increasingly non-ideal gas behavior. In the explored temperature range, the maximum overall uncertainty in T is approximately 294 µK at temperature near 24.5 K, while the minimum is about 77 µK at temperature close to 7 K.
From figure 10(b), we can see at temperatures from 8 K to 25 K, the uncertainty of D is significantly anomalous, exhibiting a wide variation in relative uncertainty from 16% to 850%. Furthermore, at those temperatures the positive and negative sign of D in table 10 is random. These findings demonstrate that the density virial coefficient D and its uncertainty u(D), determined via single-isotherm fit RIGT within the 8 K–25 K range, exhibit insufficient metrological significance. This limitation arises principally because the pressure variation induced by D-term contribution becomes statistically indistinguishable from the measured uncertainty u(p)/p at elevated temperatures, as shown in figure 11. Crucially, this observation does not invalidate the single-isotherm fit methodology for D-determination but rather defines its domain of applicability constrained by relative uncertainty thresholds of pressure. As for temperatures 5 K–7 K, the uncertainties of D are reasonable, and these data are the valid ones in this work. At lower temperatures, the second density virial coefficient B [2] becomes the dominant component for u(D). The maximum overall uncertainty of D is approximately 646 cm9 mol−3 at temperature near 7 K, whereas the minimum is about 379 cm9 mol−3 at 5 K.
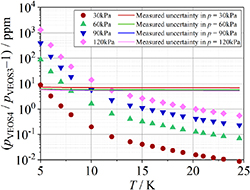
Figure 11. Relative pressure change arises from the D-term contribution in the virial equation (equation (5)). The subscripts VEOS3 and VEOS4 mean the third and fourth order viral equation respectively. In our previous work [5], the typical measurement uncertainty u(p)/p are 7.0 ppm, 5.8 ppm, 5.5 ppm, 5.4 ppm for pressures 30 kPa, 60 kPa, 90 kPa, 120 kPa, respectively.
Download figure:
Standard image High-resolution imageTable 10. Thermodynamic temperature T and the fourth density virial coefficient D determined by the single-isotherm fit RIGT. Only three values for 5 K, 6 K and 7 K were valid since only four lower pressures, i.e. (30, 60, 90, 120) kPa, were carried out, for which the effect of the term Dρ4 in the VEOS is too small compared with the measurement noise. Therefore, it is difficult to distinguish and extract D correctly at temperatures above 8 K; otherwise, higher pressures would need to be implemented. Boldface values of D and u(D) indicate valid results, whereas italicized entries designate invalid ones.
| TRIGT/K | u(TRIGT)/mK | D/cm9 mol−3 | u(D)/cm9 mol−3 | T90,CAS/Ka | u(T90,CAS)/mKa | TRIGT T90,CAS/mK T90,CAS/mK | u(TRIGT T90,CAS)/mK T90,CAS)/mK |
|---|---|---|---|---|---|---|---|
| 24.55541 | 0.29 | 3866 | 32 986 | 24.55570 | 0.21 | −0.29 | 0.36 |
| 23.00033 | 0.27 | −6574 | 23 624 | 23.00046 | 0.20 | −0.13 | 0.34 |
| 21.99980 | 0.27 | −4028 | 21 520 | 21.99978 | 0.18 | 0.02 | 0.32 |
| 20.99835 | 0.23 | −6474 | 16 733 | 20.99813 | 0.16 | 0.22 | 0.28 |
| 20.26794 | 0.22 | 643 | 17 363 | 20.26762 | 0.16 | 0.32 | 0.27 |
| 18.99876 | 0.21 | 327 | 13 480 | 18.99817 | 0.18 | 0.59 | 0.28 |
| 17.99980 | 0.18 | 1175 | 11 591 | 17.99907 | 0.20 | 0.73 | 0.27 |
| 17.03393 | 0.18 | −2239 | 9187 | 17.03310 | 0.20 | 0.83 | 0.27 |
| 16.00014 | 0.16 | 423 | 7423 | 15.99931 | 0.20 | 0.83 | 0.26 |
| 15.00064 | 0.15 | 275 | 6116 | 14.99986 | 0.18 | 0.78 | 0.23 |
| 13.80430 | 0.14 | 972 | 4811 | 13.80366 | 0.14 | 0.64 | 0.20 |
| 12.00054 | 0.11 | 1837 | 3283 | 12.00015 | 0.12 | 0.39 | 0.16 |
| 10.00095 | 0.09 | 3127 | 1843 | 10.00070 | 0.12 | 0.25 | 0.15 |
| 8.00098 | 0.08 | 5650 | 888 | 8.00067 | 0.10 | 0.31 | 0.13 |
| 7.00025 | 0.08 | 8271 | 646 | 6.99989 | 0.09 | 0.36 | 0.12 |
| 6.00004 | 0.08 | 12 660 | 487 | 5.99966 | 0.10 | 0.38 | 0.13 |
| 5.00023 | 0.09 | 19 260 | 379 | 4.99988 | 0.08 | 0.35 | 0.12 |
aValues are the same as those in table 9 of our previous work [5]. The subscript CAS means the T90 values are the weighted ones of the three calibrated RIRTs.
4.3.2. Comparison results.
Figure 12 shows the comparison results for T and D of 4He at temperatures from 5.0 K to 24.5 K, while table 10 lists their values, uncertainty, and T T90 results. From figure 12(a), we can see that there is good agreement between TRIGT determined by the single-isotherm fit RIGT in this work and TSPRIGT determined by SPRIGT in our earlier work [11]. All the TRIGT
 TSPRIGT differences lie within their uncertainties, which boosts confidence in the experimental determination of T and D.
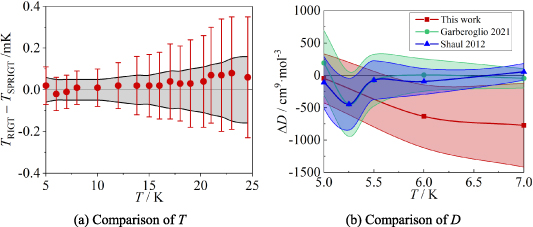
Figure 12. Comparison results for T and D. (a) TRIGT, determined by the single-isotherm fit RIGT in this work, the error bar denotes the uncertainty of TRIGT; TSPRIGT, determined by SPRIGT (a relative RIGT) in our previous work [11], the grey area denotes the standard uncertainty of TSPRIGT. (b) ΔD = D DEquation 12. Red square and shading show the results and the standard uncertainty of D in this work. Green circle and shading show the differences and the standard uncertainty of DGarberoglio of 4He from Garberoglio and Harvey [4]. Blue upper triangle and shading show the differences and the standard uncertainty of DShaul of 4He from Shaul et al [24].
Download figure:
Standard image High-resolution image
Figure 12(b) compares the D values obtained from this experimental work with those derived from ab initio calculations for 4He by Shaul et al [24] and Garberoglio and Harvey [4] at temperatures close to 5 K, 6 K and 7 K. DThis work, DGarberoglio and DShaul show good agreement with differences within their combined standard uncertainties across the relevant temperature range. This agreement enhances the credibility of the D values, despite the absence of a complete uncertainty report for DShaul. Notably, u(DThis work) becomes smaller than u(DGarberoglio) at 5 K, indicating a potential improvement in uncertainty by a factor of at least u(DGarberoglio)/u(DThis work) = 1.3 at that temperature. This underscores the need for more precise calculations of D, particularly at temperatures below 5 K.
Additionally, Wheatley et al [38] recently developed a four-body nonadditive potential to calculate the fourth virial coefficient of Helium-4. Their results, DWheatley, align well with DGarberoglio within their combined standard uncertainties from 10 K to 2000 K. Regarding uncertainties, u(DWheatley) is lower than u(DGarberoglio) for temperatures ranging from 400 K to 2000 K, but higher for temperatures below 400 K, with an average ratio of u(DWheatley)/ u(DGarberoglio) of approximately 1.3. This indicates that the D values obtained by Garberoglio and Harvey [4] are the most accurate ab initio calculations of the fourth virial coefficients of 4He currently available for cryogenic gas metrology.
5. Conclusion and perspectives
In this work, an experimental methodology was developed to determine simultaneously density virial coefficients of the working gas and thermodynamic temperature. In fact, we can also simultaneously determine the triplet (T, B, C) or the quartet of values (T, B, C, D) with the help of the single-isotherm fit or multiple-isotherm fit RIGT methods, provided measurements at more pressures on one isotherm were performed. This will be one of our aims in future work.
Using single-isotherm fit RIGT, high accuracy values of (TRIGT, B), (TRIGT, C) and (TRIGT, D) of helium-4 were determined at temperatures from 5 K to 25 K. In these cases, we find that the measured thermodynamic temperatures TRIGT have good agreement with TSPRGT, determined previously using single-pressure measurements [5, 11], with differences lying within their standard uncertainty. This suggests the experimentally determined values of B, C and D are reliable in this work. As for thermodynamic temperature uncertainty, u(TRIGT), its three largest contributions arise from isothermal compressibility uncertainty  , microwave resonance frequency uncertainty
  and gaseous pressure uncertainty
  for higher temperatures close to 24.5 K and density virial coefficients B and D for lower temperatures close to 5 K, all of which could be improved in future.
To validate the reliability of the coefficients and assess their uncertainties, we directly compared the experimental values of B, C, and D for 4He against ab initio calculations. The results show that the values of BThis work of 4He lie in good agreement with those from ab initio calculations by Cencek et al [23] and Czachorowski et al [2]. The same goes for CThis work of 4He and those from Garberoglio et al [37] and Binosi et al [3] with most differences lying within their uncertainties. Besides, the three main uncertainty components for both u(B) and u(C) are the frequency uncertainties  , mode consistency of the three microwave modes
  , and fitting model
  . Notably, the frequency uncertainties can be reduced by using microwave amplifiers, as demonstrated in [8]. For D, only three values were determined at 5 K, 6 K and 7 K, as only four lower pressures (no more than 120 kPa) were used to measure the refractive index of helium-4. In this case, the effect of the term Dρ4 in the VEOS is too small compared to the measurement noise, making it difficult to distinguish and extract D correctly for temperatures above 8 K. Furthermore, we find that the ab initio calculations u(DGarberoglio) [4] is larger than that determined in this work with the ratio u(DGarberoglio)/u(DThis work) = 1.3 at 5 K, which means u(DGarberoglio) could be further improved in future with more accuracy ab initio calculation method, especially for those temperatures below 2.6 K (current low-temperature limit for ab initio calculations of D in helium).
The most accurate values of B and C for 4He to date have been obtained by Czachorowski et al [2] and Binosi et al [3]. Very soon, there will be a need for more tightly constrained values of D, one of the current limits on accuracy on temperature measurements by refractive index gas thermometry. As for the experiment in future, we are also interested in the accurate and simultaneous determination of thermodynamic temperature and two or three density virial coefficients, i;e., (T, B, C) or (T, B, C, D) by measurements at multiple pressures on an isotherm first for helium-4, helium-3 and ultimately other noble gases, especially like neon and argon.
Acknowledgments
This work was supported by the National Natural Science Foundation of China (Grant No. 52125602 and 52006231), the National Key Research and Development Program of China (Grant No. 2022YFE0210200, 2022YFE0116100), the Strategic Priority Research Program of Chinese Academy of Sciences (Grant No. XDA0520303), the Director’s Fund of Technical Institute of Physics and Chemistry CAS (Grant No. E3A9T101) and the Key Research Program of the State Key Laboratory of Cryogenic Science and Technology (Grant No. E5AST101). Haiyang Zhang was supported by the Youth Innovation Promotion Association CAS (Grant No. 2022028). This work was carried out within the framework of the DireK-T project. The Project (22IEM02 DireK-T) has received funding from the European Partnership on Metrology, co-financed from the European Union’s Horizon Europe Research and Innovation Programme and by the Participating States.
The authors acknowledge Giovanni Garberoglio, Allan H. Harvey, Daniele Binosi and Jakub Lang for sharing results of their theoretical calculation of C on 4He prior to publication. We also acknowledge colleagues in our own institute and elsewhere, Laurent Pitre, Mark Plimmer, Er Cang Luo, Fernando Sparasci, Zhen Zhang, Ying Ma, Dong Xu Han, Chang Zhao Pan, Hui Chen and Jiang Feng Hu, especially, for the constant support over the years of Mike. R. Moldover and Richard Rusby.