

New features and major changes coming to DevTools in Chrome 67 include:
- Search across all network headers
- CSS variable value previews in the Styles pane
- Copy as fetch
- New audits, desktop configuration options, and viewing traces
- Stop infinite loops
- User Timing in the Performance tabs
- JavaScript VM instances clearly listed in the Memory panel
- The Network tab in the Sources panel has been renamed to the Page tab
- Dark theme updates
- Certificate transparency information in the Security panel
- Site isolation features in the Performance panel
Video version of the release notes:
Search across all network headers and responses
Open the Network panel then press Command+F (Mac) or Control+F (Windows, Linux, ChromeOS) to open the new Network Search pane. DevTools searches the headers and bodies of all network requests for the query that you provide.
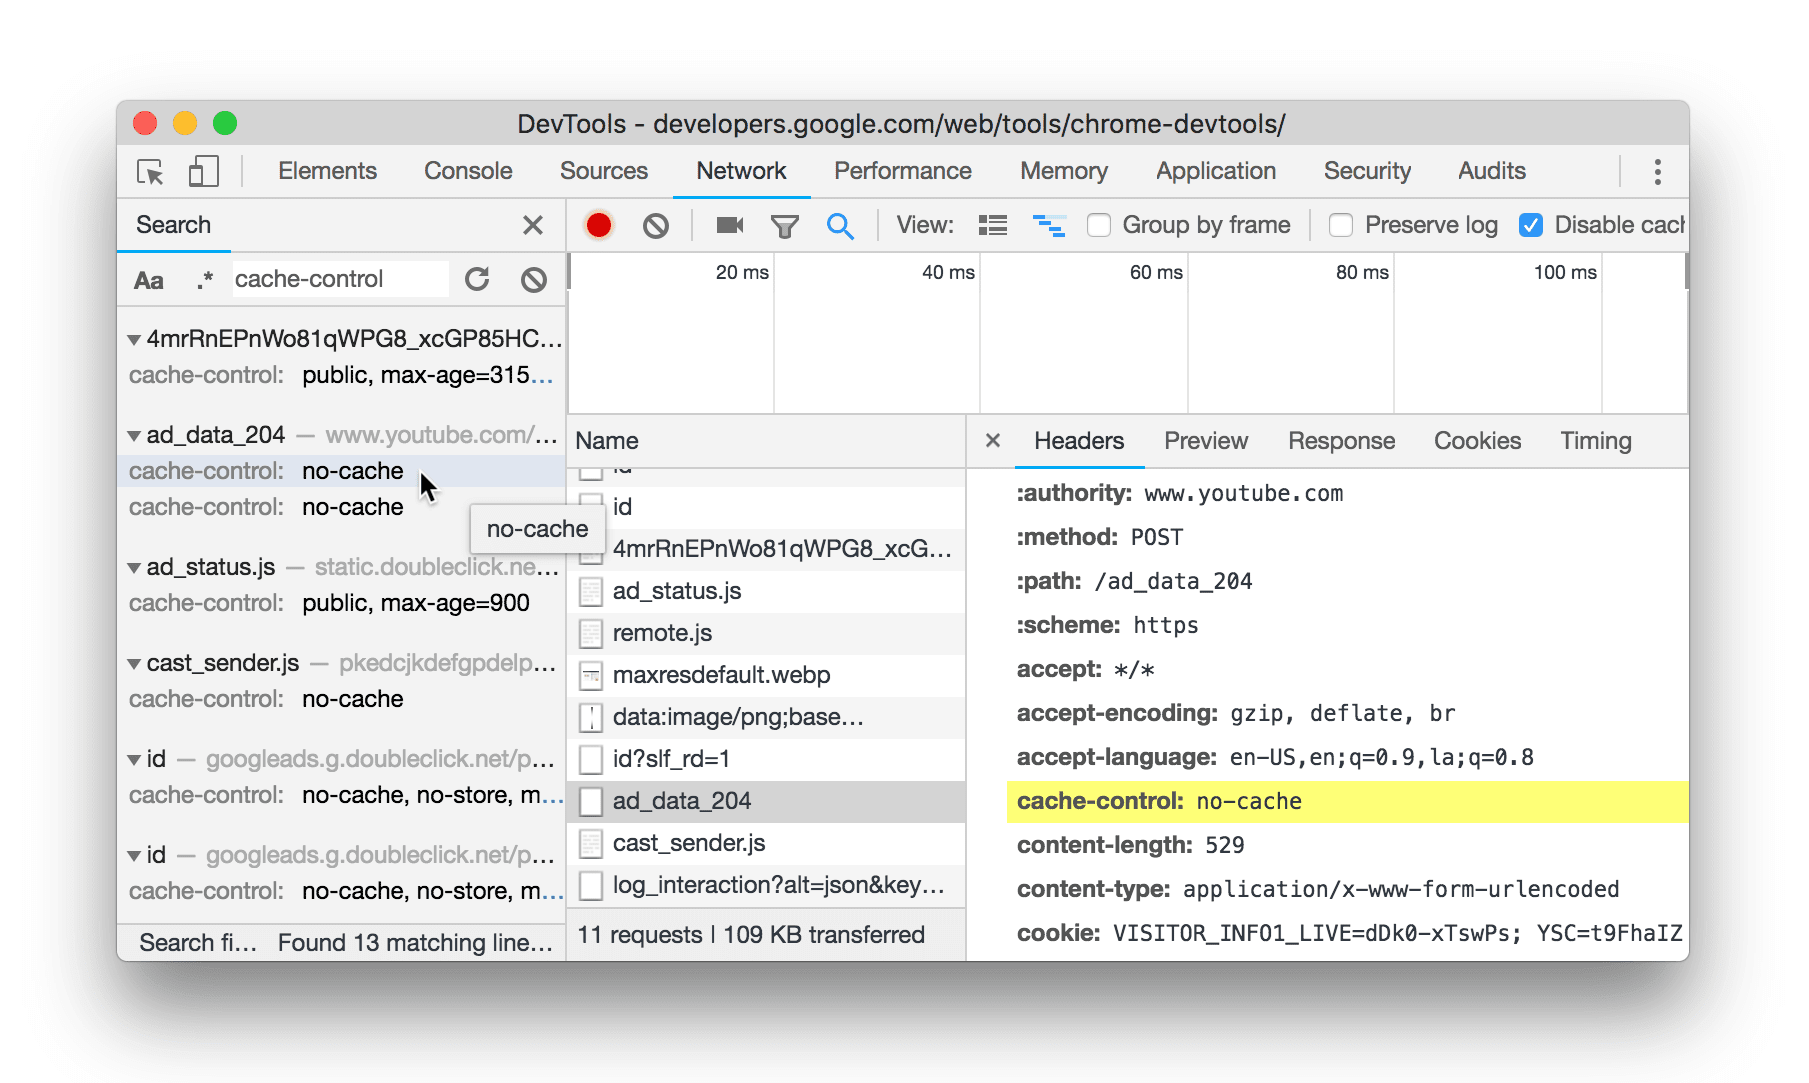
Figure 1. Searching for the text cache-control with the new Network Search pane
Click Match Case ![]() to make your query
case-sensitive. Click Use Regular Expression
to make your query
case-sensitive. Click Use Regular Expression
![]() to show any results that match
the pattern you provide. You don't need to wrap your RegEx in forward slashes.
to show any results that match
the pattern you provide. You don't need to wrap your RegEx in forward slashes.

Figure 2. A regular expression query in the Network Search pane.
Search pane UI updates
The UI of the Global Search pane now matches the UI of the new Network Search pane. It now also pretty-prints results to aid scannability.
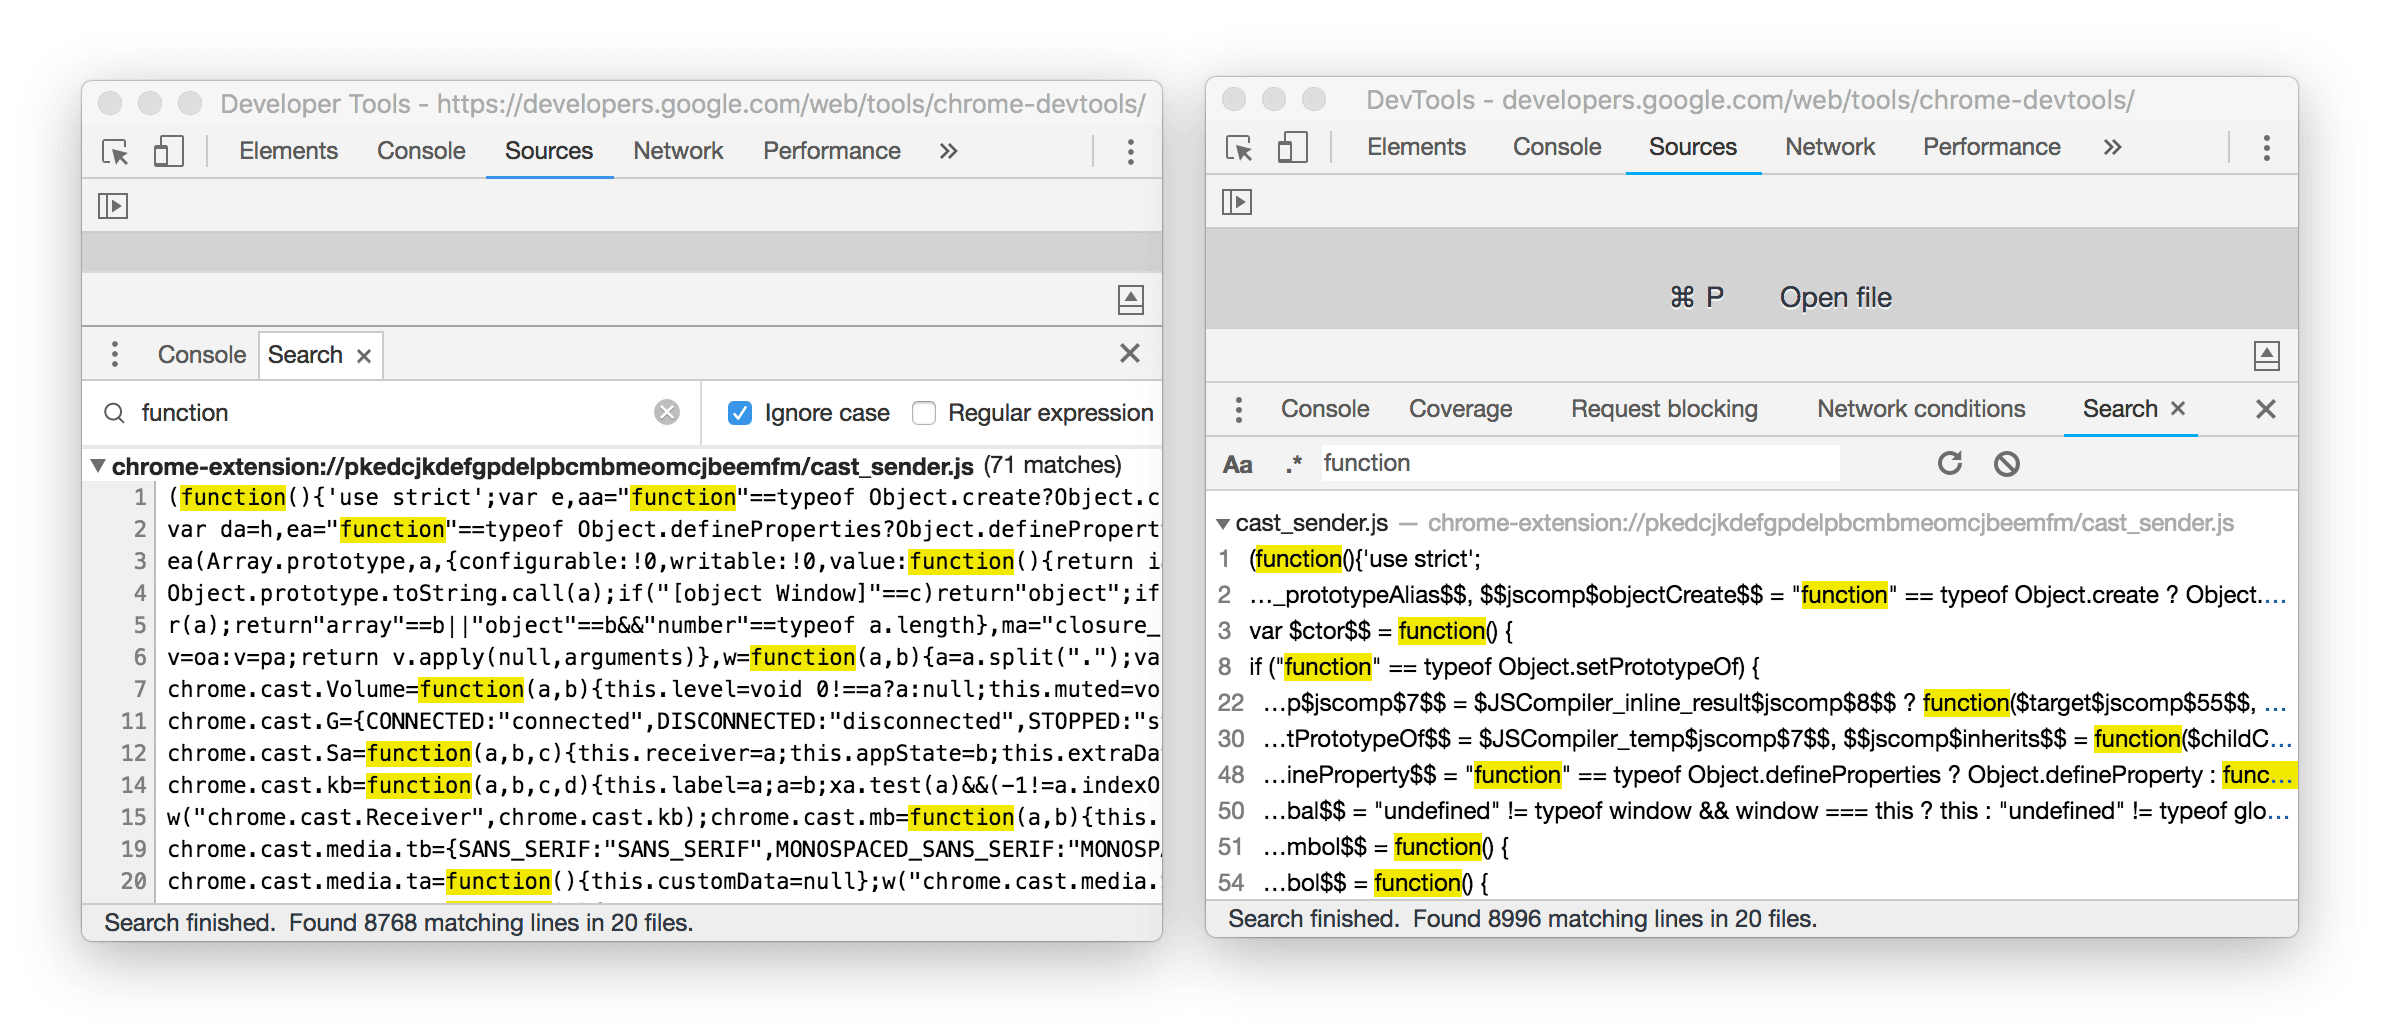
Figure 3. The old UI on the left, and the new UI on the right
Press Command+Option+F (Mac) or Control+Shift+F (Windows, Linux, ChromeOS) to open Global Search. You can also open it via the Command Menu.
CSS variable value previews in the Styles pane
When the value of a CSS color property, such as background-color or color, is set to a CSS
variable, DevTools now shows a preview of that color.
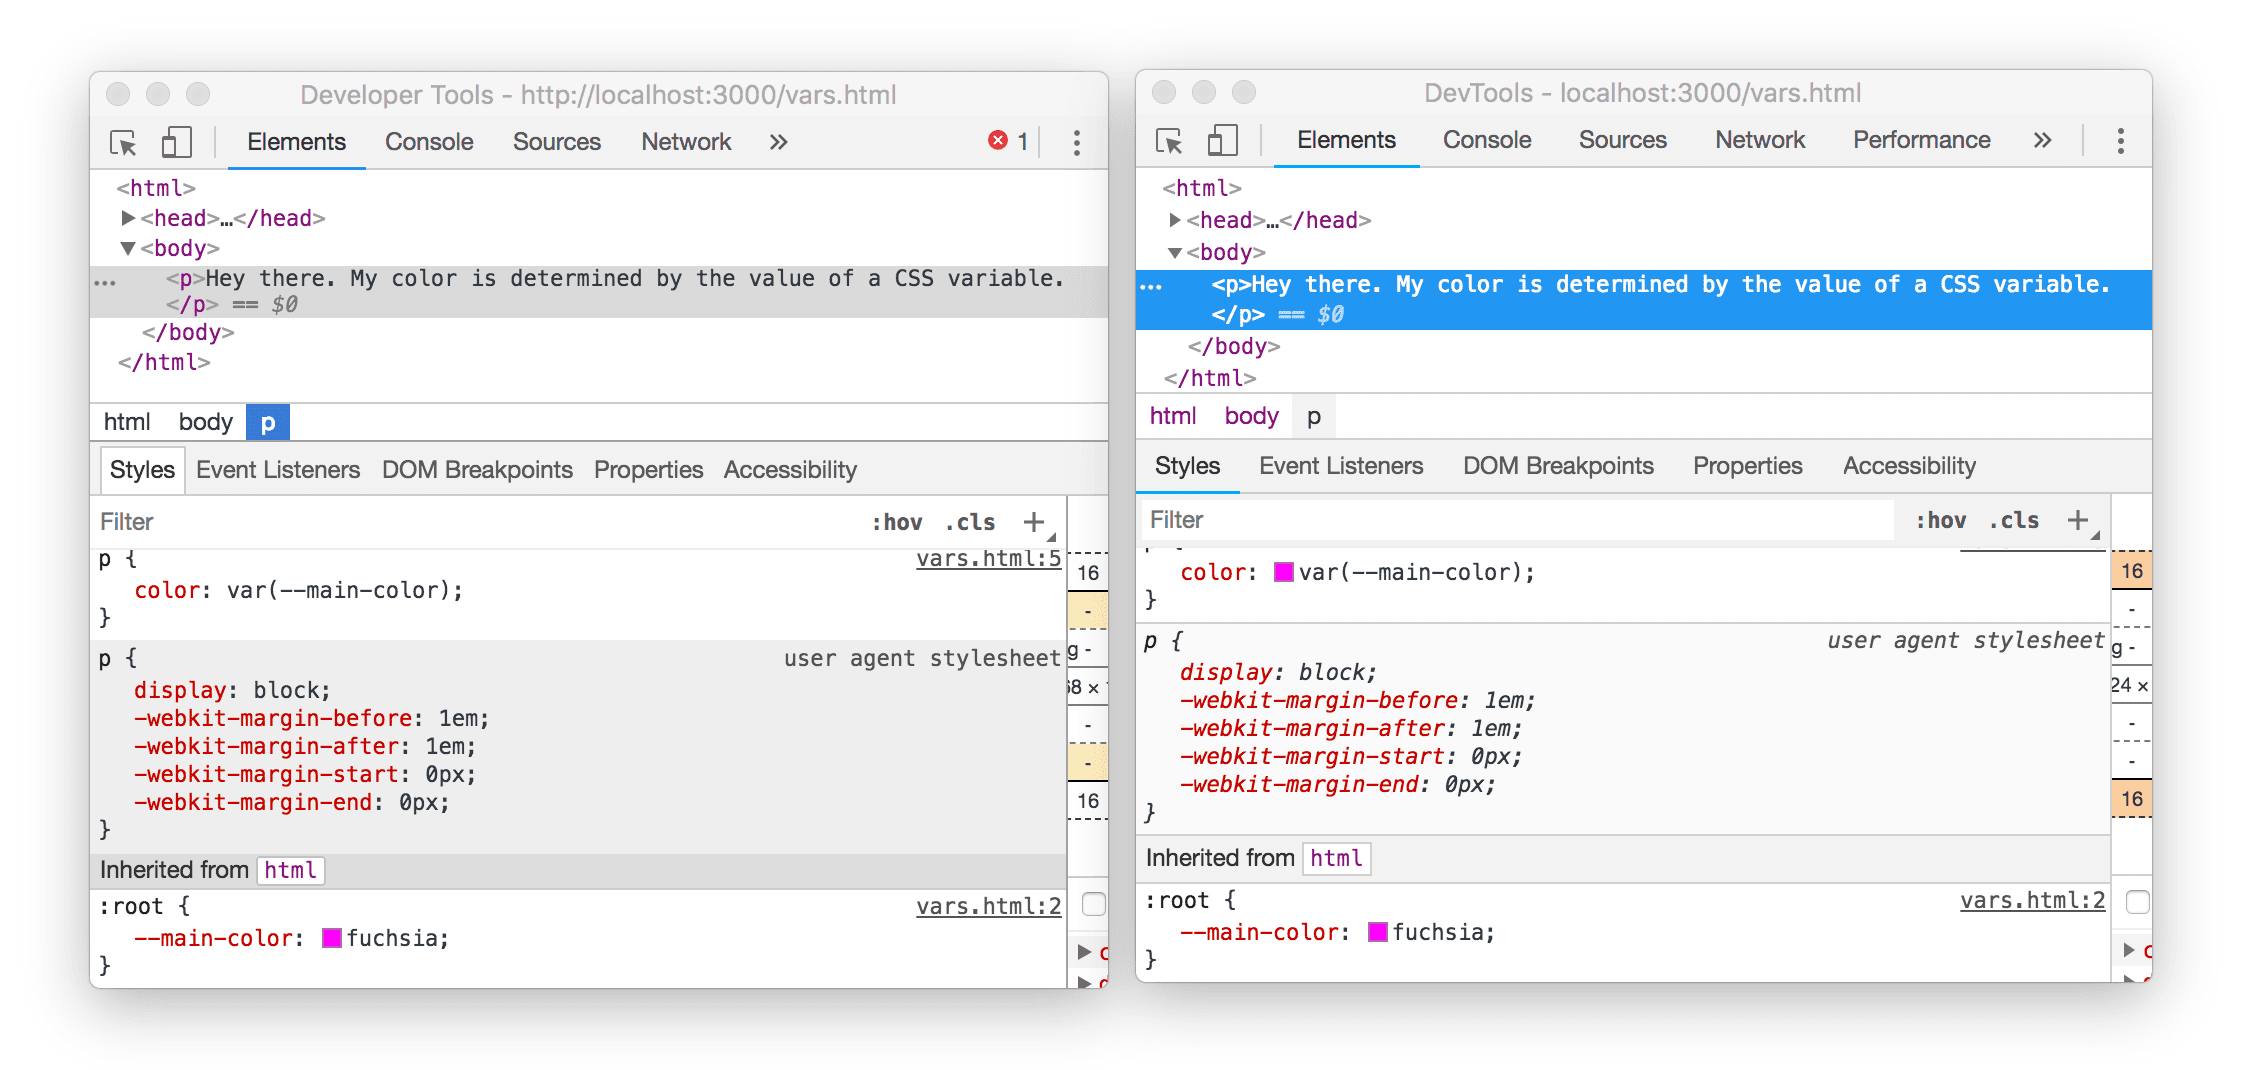
Figure 4. In the old UI on the left, there is no color preview next to
color: var(--main-color), whereas in the new UI on the right, there is
Copy as fetch
Right-click a network request then select Copy > Copy As Fetch to copy the
fetch()-equivalent code for that request to your clipboard.
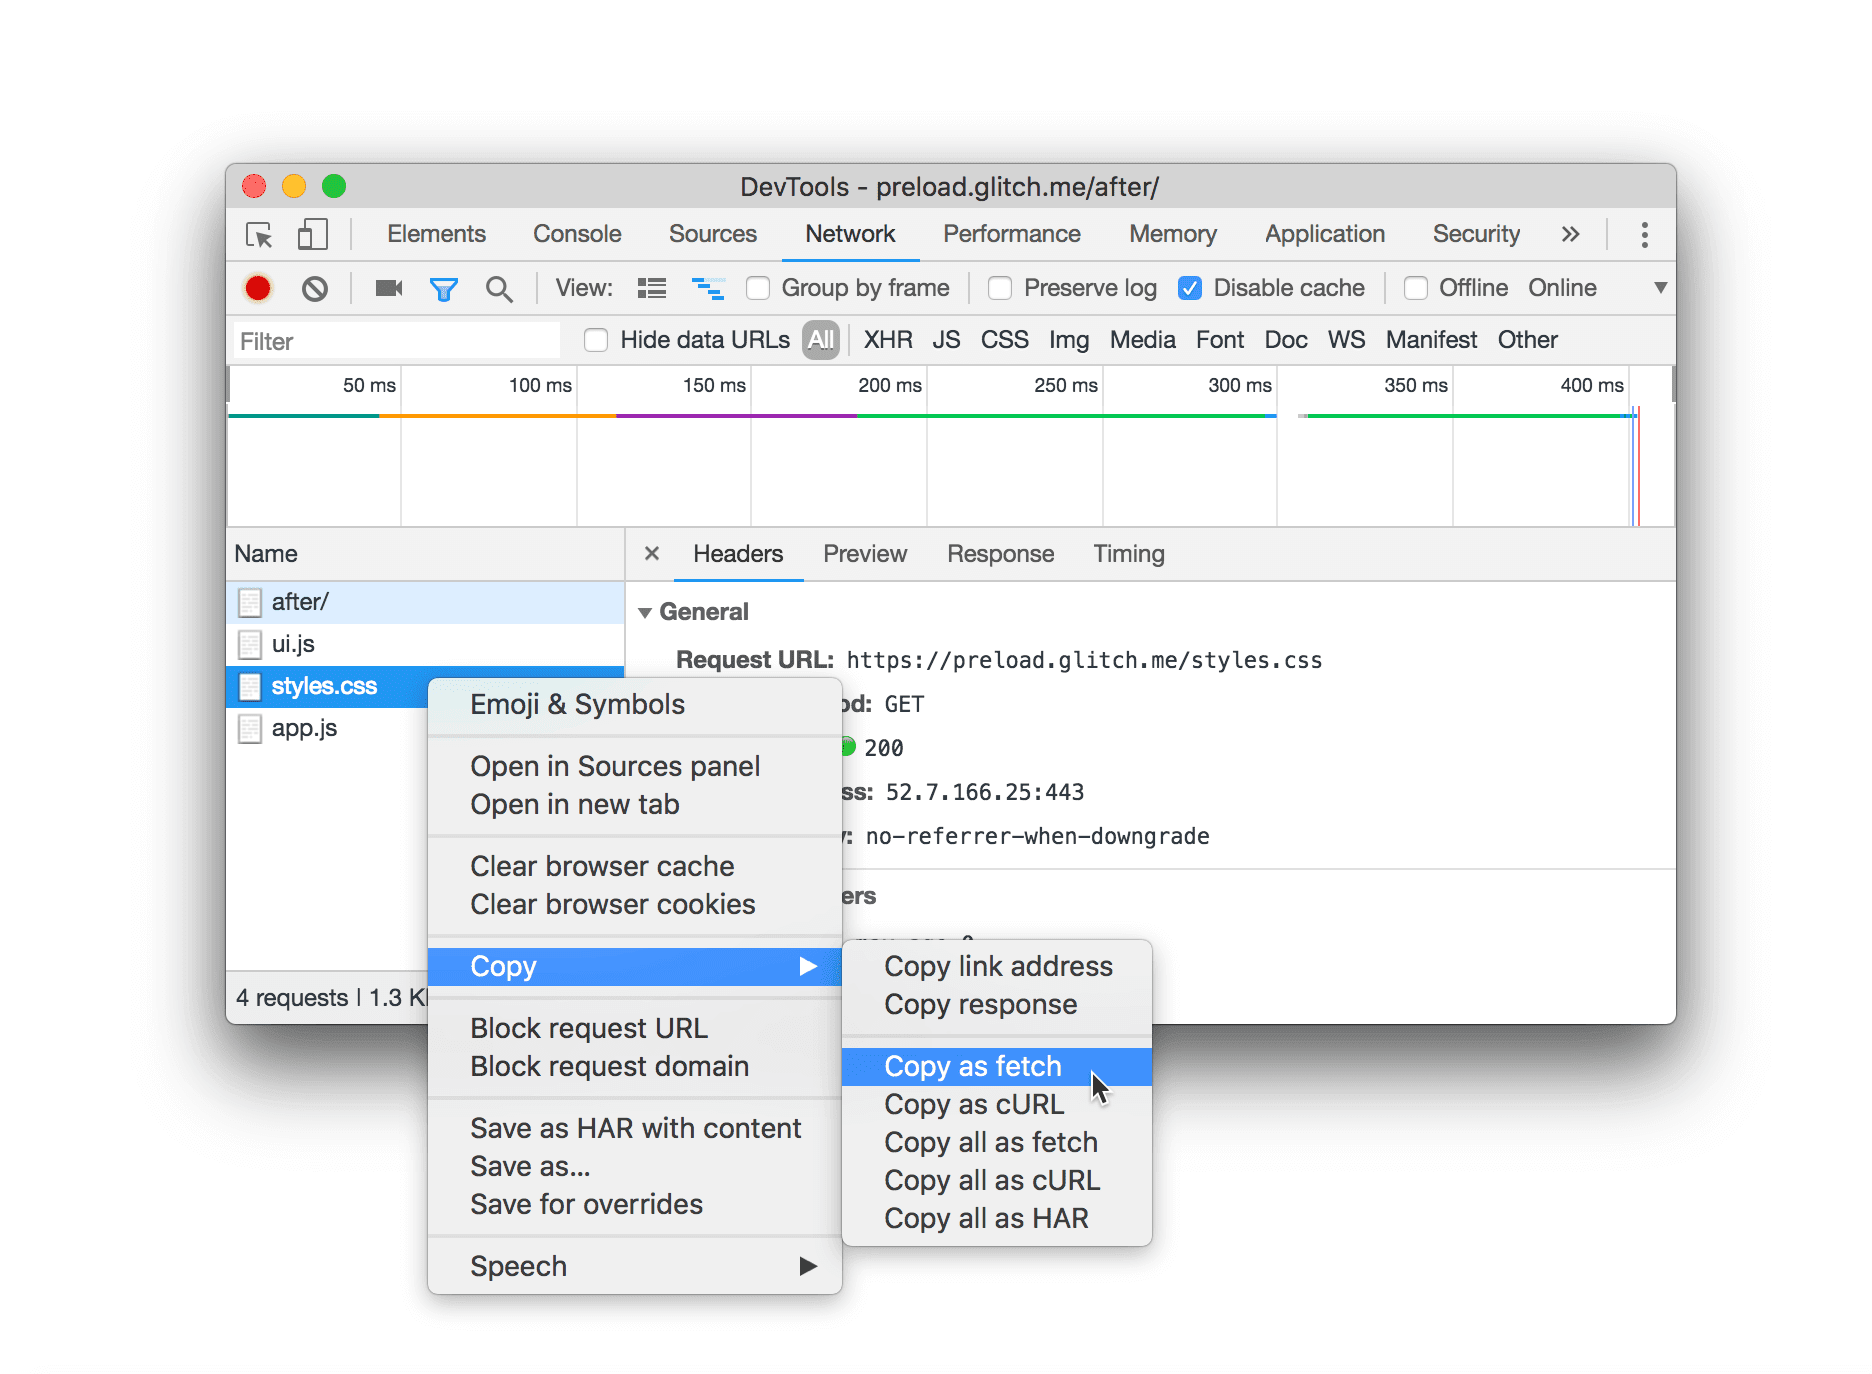
Figure 5. Copying the fetch()-equivalent code for a request
DevTools produces code like the following:
fetch("https://preload.glitch.me/styles.css", {
  "credentials": "omit",
  "headers": {},
  "referrer": "https://preload.glitch.me/after/",
  "referrerPolicy": "no-referrer-when-downgrade",
  "body": null,
  "method": "GET",
  "mode": "cors"
});
Audits panel updates
New audits
The Audits panel has 2 new audits, including:
- Preload key requests. Preloading requests can speed up page load time by giving hints to the browser to download resources that are important for your Critical Rendering Path as soon as possible.
- Avoid invisible text while webfonts are loading. Ensuring that text is visible while webfonts load makes the page more useful to users faster.
New configuration options
You can now configure the Audits panel to:
- Preserve desktop viewport and user agent settings. In other words, you can prevent the Audits panel from simulating a mobile device.
- Disable network and CPU throttling.
- Preserve storage, such as LocalStorage and IndexedDB, across audits.
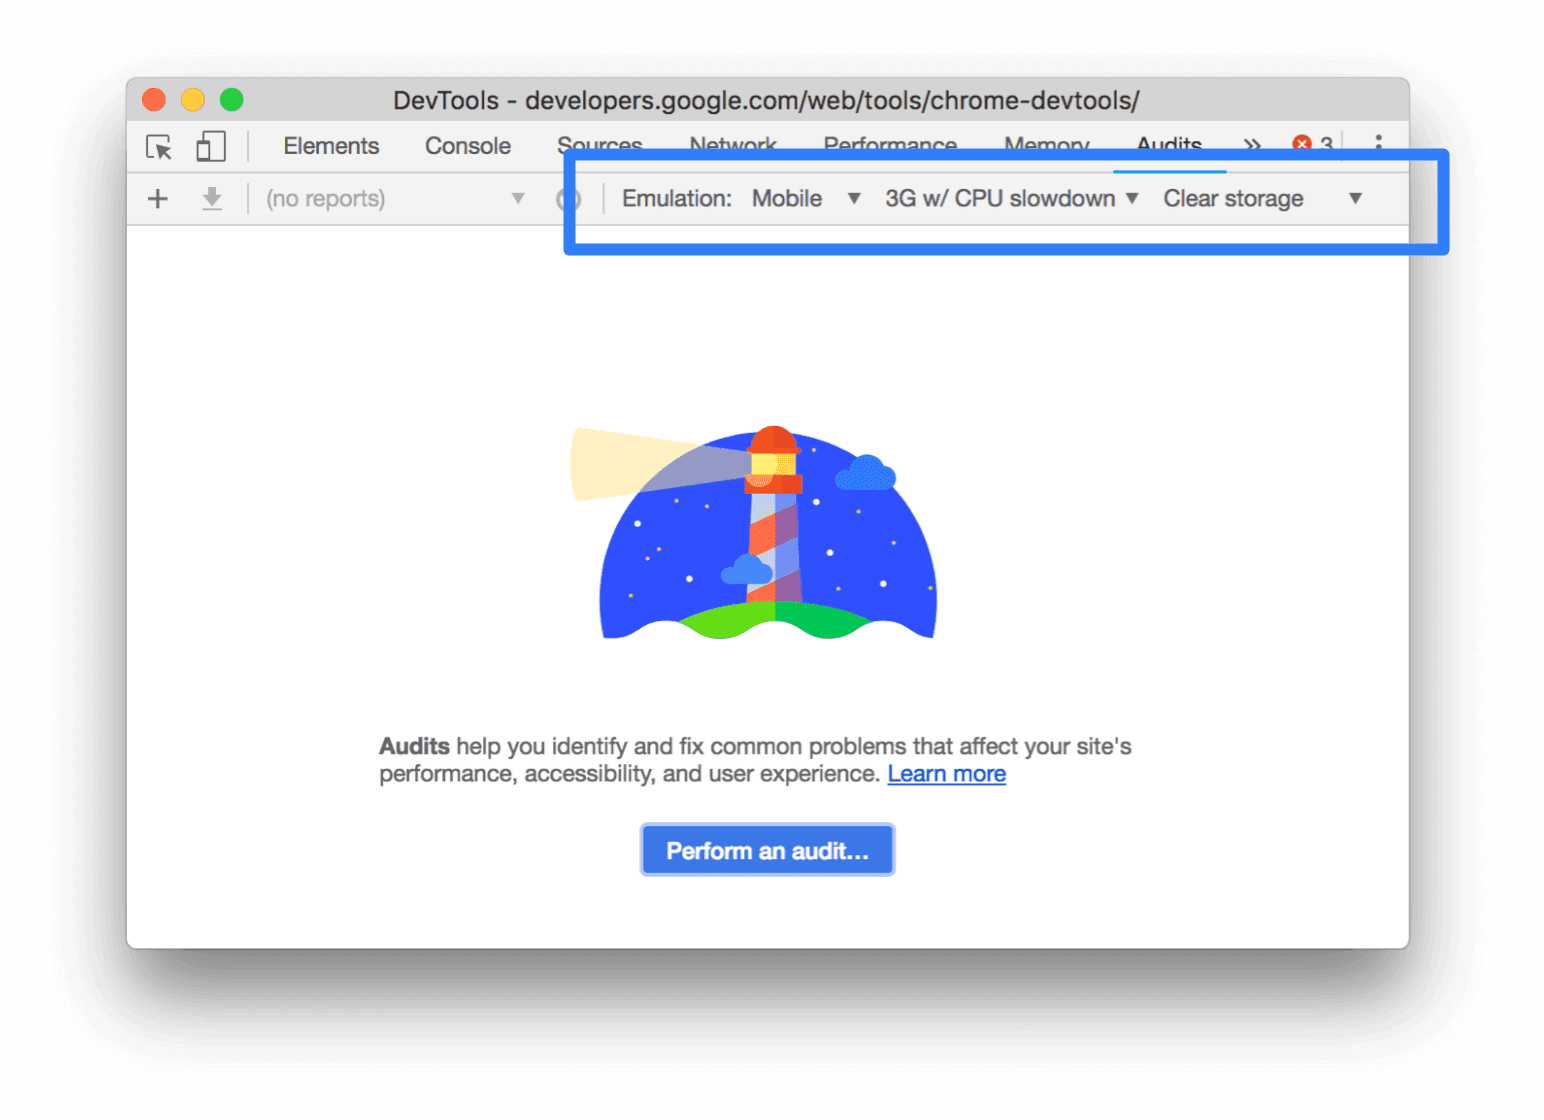
Figure 6. New audit configuration options
View traces
After auditing a page, click View Trace to view the load performance data that your audit is based off of in the Performance panel.
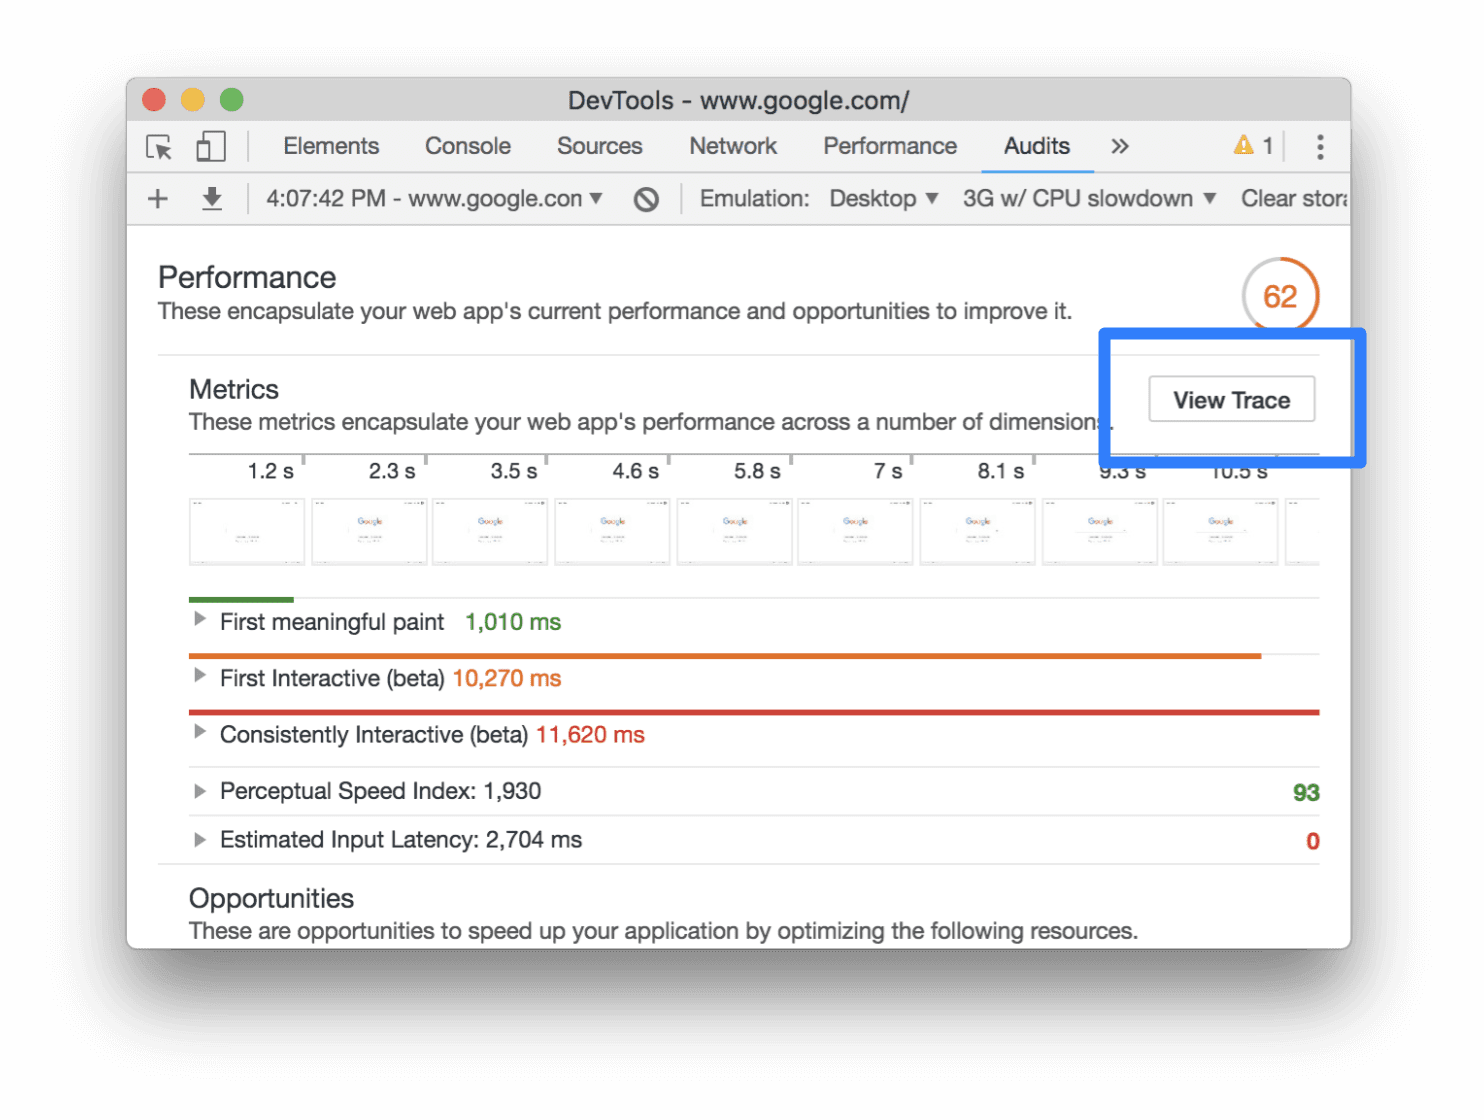
Figure 7. The View Trace button
Stop infinite loops
If you work with for loops, do...while loops, or recursion a lot, you've probably executed an
infinite loop by mistake while developing your site. To stop the infinite loop, you can now:
- Open the Sources panel.
- Click Pause
 . The button changes to Resume
Script Execution
. The button changes to Resume
Script Execution  .
. - Hold Resume Script Execution
 then select Stop
Current JavaScript Call
then select Stop
Current JavaScript Call  .
.
In the video above, the clock is being updated via a setInterval() timer. Clicking Start
Infinite Loop runs a do...while loop that never stops. The interval resumes because it wasn't
running when Stop Current JavaScript Call  was
selected.
was
selected.
User Timing in the Performance tabs
When viewing a Performance recording, click the User Timing section to view User Timing measures in the Summary, Bottom-Up, Call Tree and Event Log tabs.
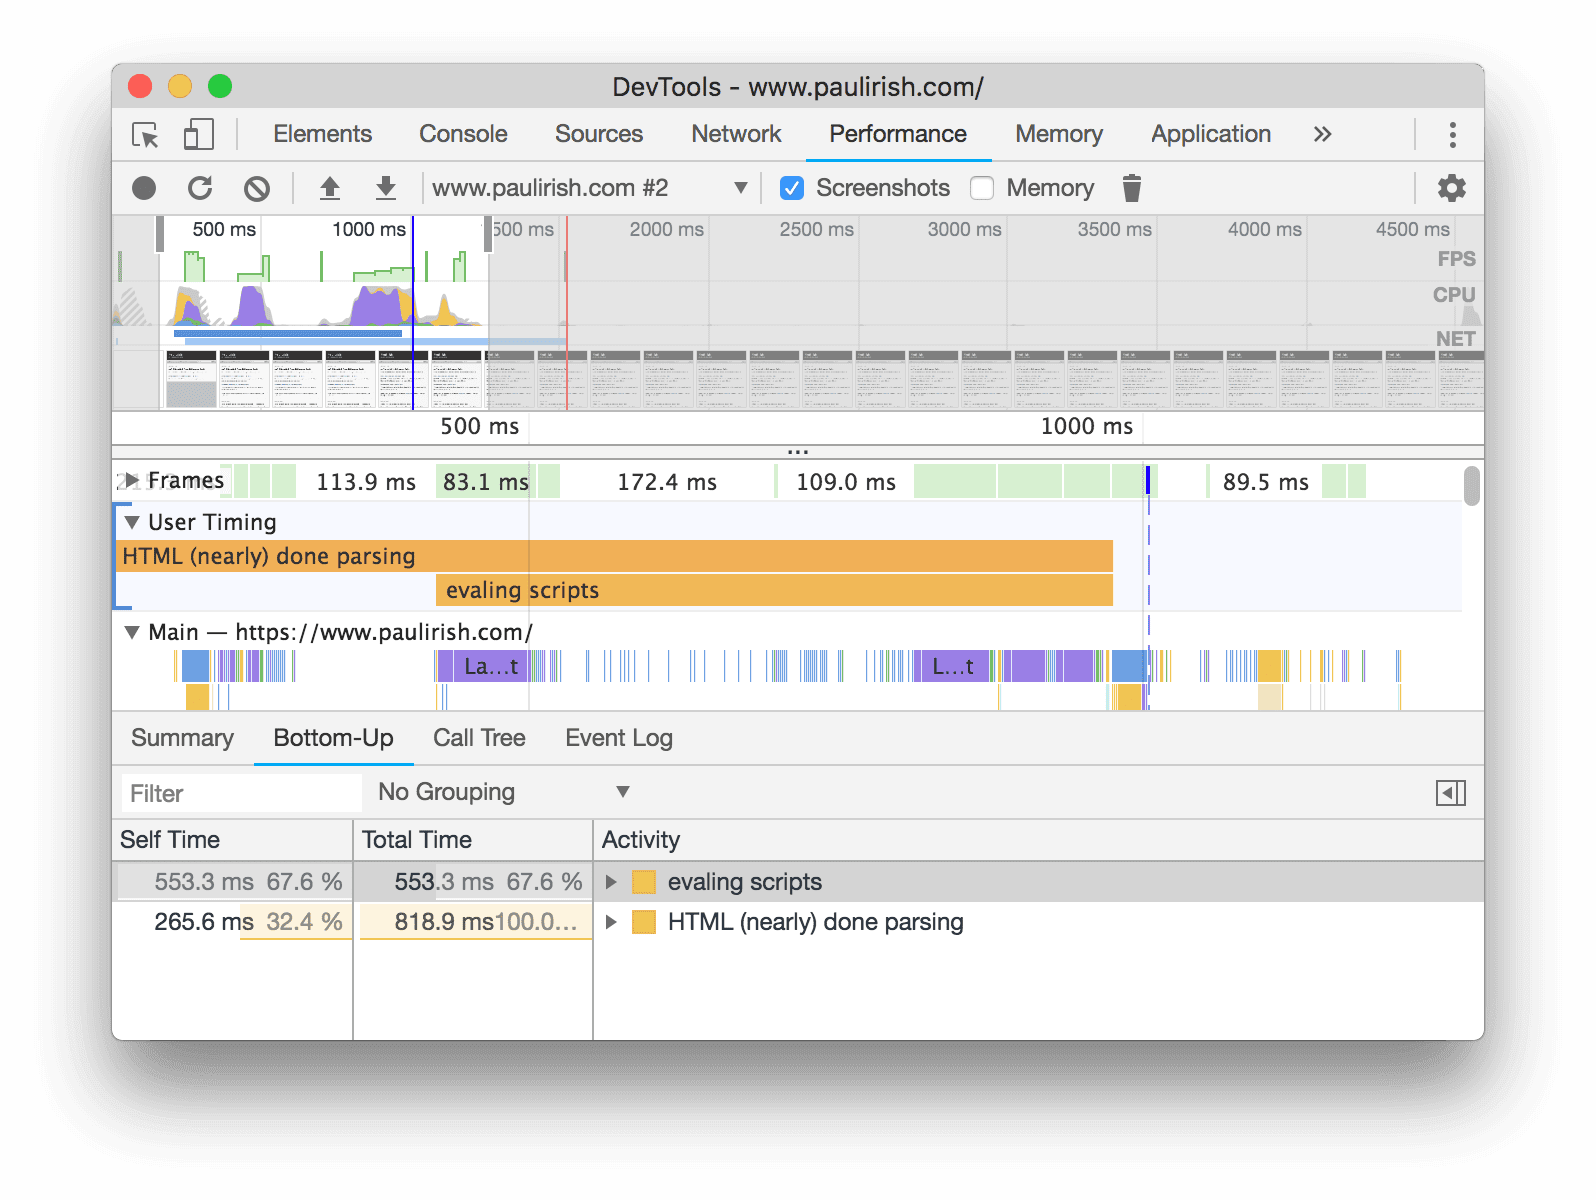
Figure 8. Viewing User Timing measures in the Bottom-Up tab. The blue bar to the left of the User Timing section indicates that it is selected.
In general, you can now select any of the sections (Main Thread, User Timing, GPU, ScriptStreamer, and so on) and view that section's activity in the tabs.
Select JavaScript VM instances in the Memory panel
The Memory panel now clearly lists out all JavaScript VM instances associated with a page, rather than hiding them behind the Target dropdown menu as before.

Figure 9. In the old UI on the left, the JavaScript VM instances are hidden behind the Target dropdown menu, whereas in the new UI on the right they are shown in the Select JavaScript VM Instance table
Next to the developers.google.com instance there are 2 values: 8.7 MB and 13.3 MB. The left
value represents memory allocated because of JavaScript. The right value represents all OS memory
that is being allocated because of that VM instance. The right value is inclusive of the left value.
In Chrome's Task Manager, the left value corresponds to JavaScript Memory and the right value
corresponds to Memory Footprint.
Network tab renamed to Page tab
On the Sources panel, the Network tab is now called the Page tab.

Figure 10. In the old UI on the left, the tab showing the page's resources is called Network, whereas in the new UI on the right it's called Page
Dark theme updates
Chrome 67 ships with a number of minor changes to the dark theme color scheme. For example, the breakpoint icons and the current line of execution are now green.

Figure 11. A screenshot of the new breakpoint icon and current line of execution color scheme
Certificate transparency in the Security panel
The Security panel now reports certificate transparency information.
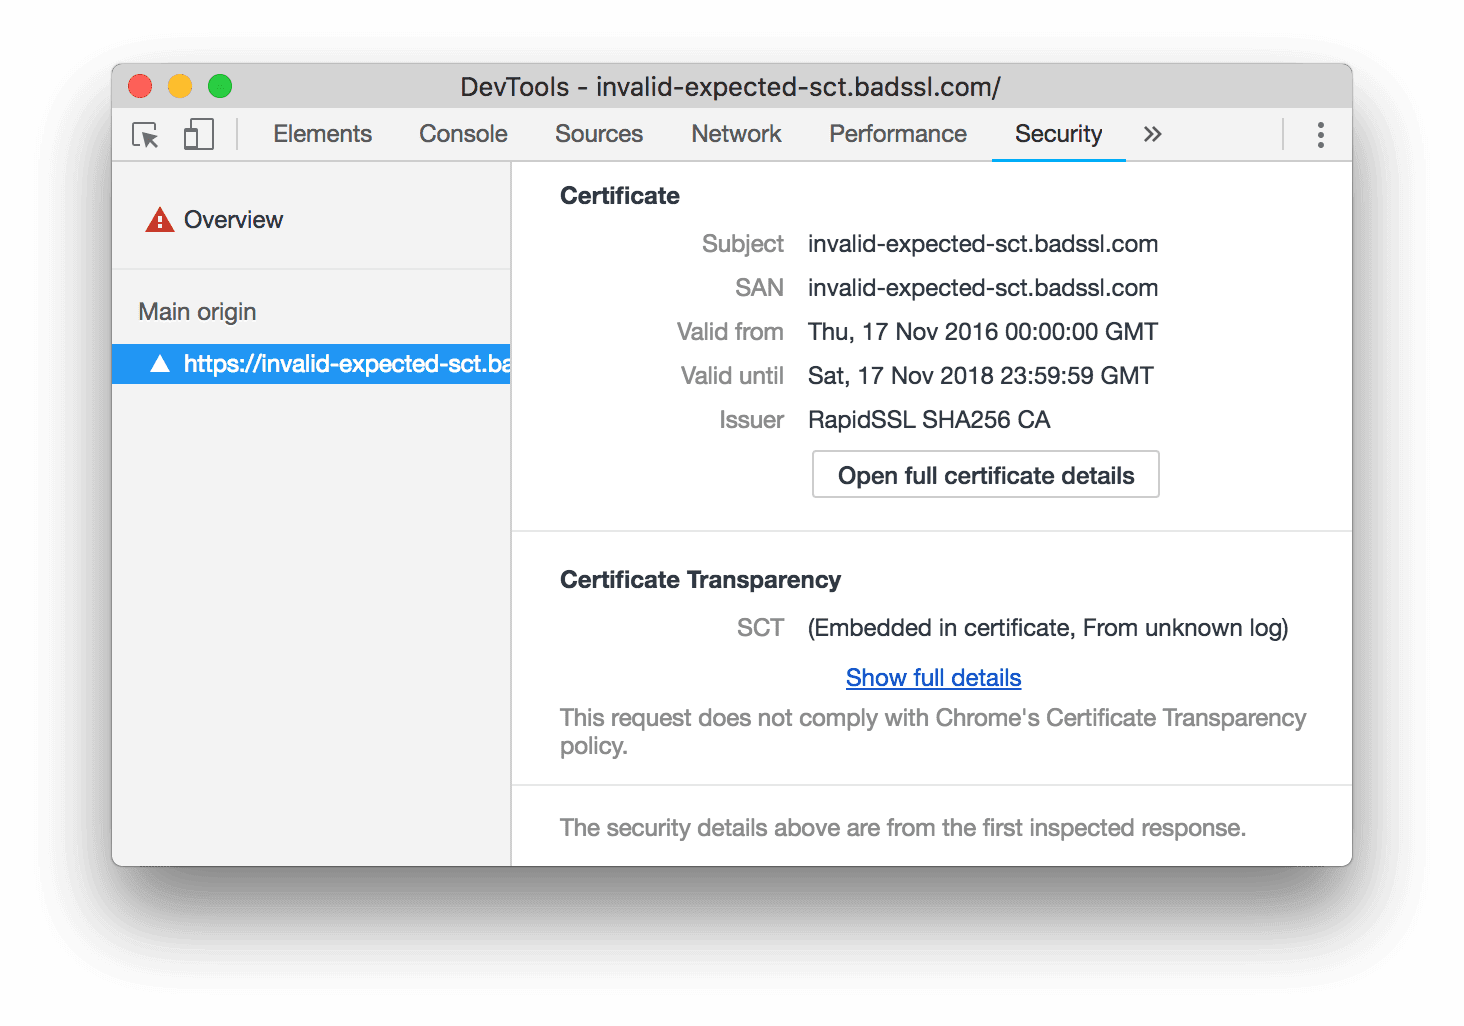
Figure 12. Certification transparency information in the Security panel
Site Isolation in the Performance panel
If you've got Site Isolation enabled, the Performance panel now provides a flame chart for each process so that you can see the total work that each process is causing.
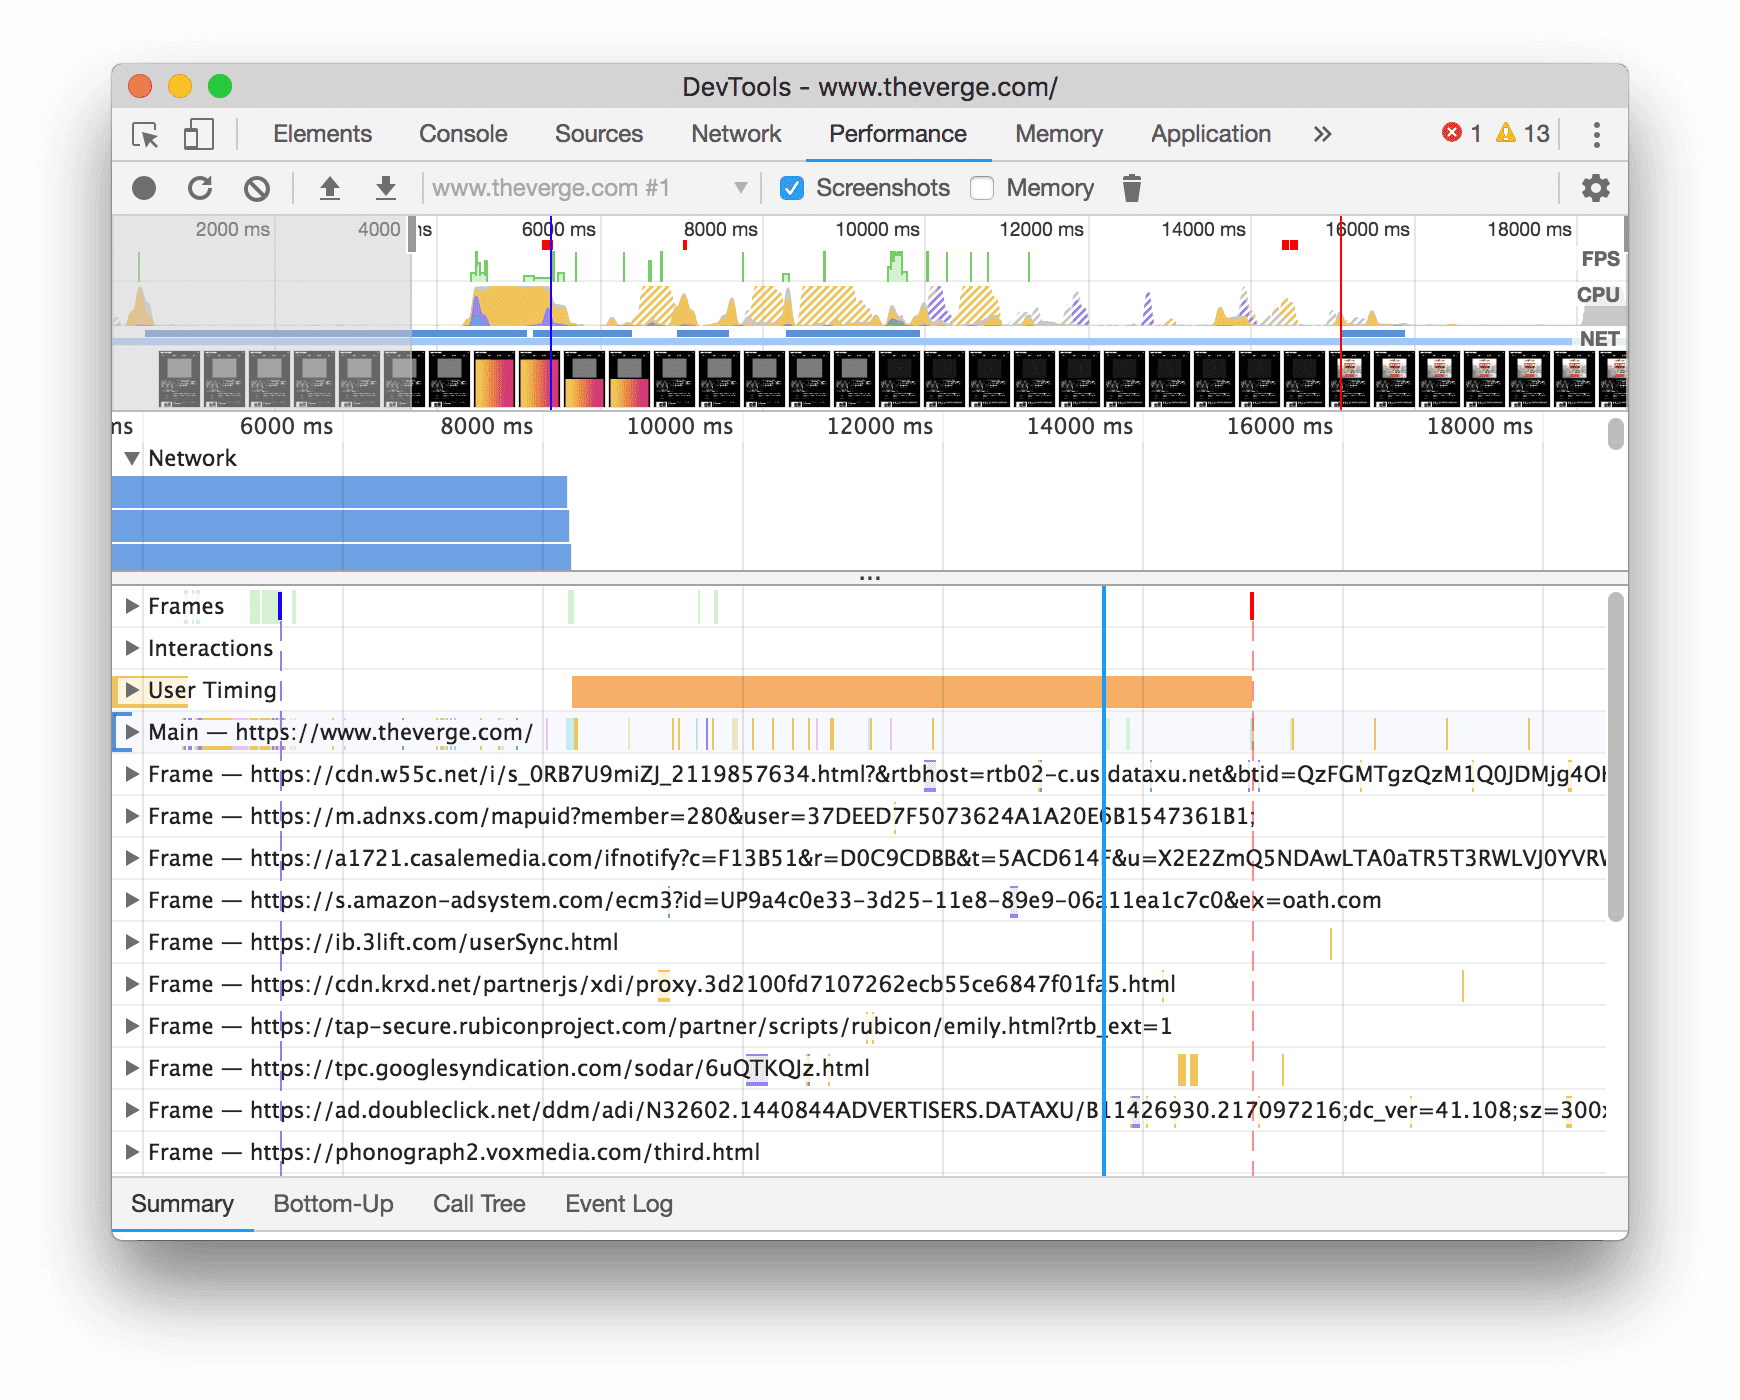
Figure 13. Per-process flame charts in a Performance recording
Download the preview channels
Consider using the Chrome Canary, Dev or Beta as your default development browser. These preview channels give you access to the latest DevTools features, test cutting-edge web platform APIs, and find issues on your site before your users do!
Getting in touch with the Chrome DevTools team
Use the following options to discuss the new features and changes in the post, or anything else related to DevTools.
- Submit a suggestion or feedback to us via crbug.com.
- Report a DevTools issue using the More options
 > Help > Report a DevTools issues in DevTools.
 - Tweet at @ChromeDevTools.
- Leave comments on our What's new in DevTools YouTube videos or DevTools Tips YouTube videos.
What's new in DevTools
A list of everything that has been covered in the What's new in DevTools series.
- Console insights by Gemini are going live in most European countries
- Performance panel updates
- Enhanced Network track
- Customize performance data with extensibility API
- Details in the Timings track
- Copy all listed requests in the Network panel
- Faster heap snapshots with named HTML tags and less clutter
- Open Animations panel to capture animations and edit @keyframes live
- Lighthouse 12.1.0
- Accessibility improvements
- Miscellaneous highlights
- Inspect CSS anchor positioning in the Elements panel
- Sources panel improvements
- Enhanced 'Never Pause Here'
- New scroll snap event listeners
- Network panel improvements
- Updated network throttling presets
- Service worker information in custom fields of the HAR format
- Send and receive WebSocket events in the Performance panel
- Miscellaneous highlights
- Performance panel improvements
- Move and hide tracks with updated track configuration mode
- Ignore scripts in the flame chart
- Throttle down the CPU by 20 times
- Performance insights panel will be deprecated
- Find excessive memory usage with new filters in heap snapshots
- Inspect storage buckets in Application > Storage
- Disable self-XSS warnings with a command-line flag
- Lighthouse 12.0.0
- Miscellaneous highlights
- Understand errors and warnings in the Console better with Gemini
- @position-try rules support in Elements > Styles
- Sources panel improvements
- Configure automatic pretty-printing and bracket closing
- Handled rejected promises are recognized as caught
- Error causes in the Console
- Network panel improvements
- Inspect Early Hints headers
- Hide the Waterfall column
- Performance panel improvements
- Capture CSS selector statistics
- Change order and hide tracks
- Ignore retainers in the Memory panel
- Lighthouse 11.7.1
- Miscellaneous highlights
- New Autofill panel
- Enhanced network throttling for WebRTC
- Scroll-driven animations support in the Animations panel
- Improved CSS nesting support in Elements > Styles
- Enhanced Performance panel
- Hide functions and their children in the flame chart
- Arrows from selected initiators to events they initiated
- Lighthouse 11.6.0
- Tooltips for special categories in Memory > Heap snapshots
- Application > Storage updates
- Bytes used for shared storage
- Web SQL is fully deprecated
- Coverage panel improvements
- The Layers panel might be deprecated
- JavaScript Profiler deprecation: Phase four, final
- Miscellaneous highlights
- Find the Easter egg
- Elements panel updates
- Emulate a focused page in Elements > Styles
- Color Picker, Angle Clock, and Easing Editor in
var()fallbacks - CSS length tool is deprecated
- Popover for the selected search result in the Performance > Main track
- Network panel updates
- Clear button and search filter in the Network > EventStream tab
- Tooltips with exemption reasons for third-party cookies in Network > Cookies
- Enable and disable all breakpoints in Sources
- View loaded scripts in DevTools for Node.js
- Lighthouse 11.5.0
- Accessibility improvements
- Miscellaneous highlights
- The official collection of Recorder extensions is live
- Network improvements
- Failure reason in the Status column
- Improved Copy submenu
- Performance improvements
- Breadcrumbs in the Timeline
- Event initiators in the Main track
- JavaScript VM instance selector menu for Node.js DevTools
- New shortcut and command in Sources
- Elements improvements
- The ::view-transition pseudo-element is now editable in Styles
- The align-content property support for block containers
- Posture support for emulated foldable devices
- Dynamic theming
- Third-party cookies phaseout warnings in the Network and Application panels
- Lighthouse 11.4.0
- Accessibility improvements
- Miscellaneous highlights
- Elements improvements
- Streamlined filter bar in the Network panel
@font-palette-valuessupport- Supported case: Custom property as a fallback of another custom property
- Improved source map support
- Performance panel improvements
- Enhanced Interactions track
- Advanced filtering in Bottom-Up, Call Tree, and Event Log tabs
- Indentation markers in the Sources panel
- Helpful tooltips for overridden headers and content in the Network panel
- New Command Menu options for adding and removing request blocking patterns
- The CSP violations experiment is removed
- Lighthouse 11.3.0
- Accessibility improvements
- Miscellaneous highlights
- Third-party cookie phaseout
- Analyze your website's cookies with the Privacy Sandbox Analysis Tool
- Enhanced ignore listing
- Default exclusion pattern for node_modules
- Caught exceptions now stop execution if caught or passing through non-ignored code
x_google_ignoreListrenamed toignoreListin source maps- New input mode toggle during remote debugging
- The Elements panel now shows URLs for #document nodes
- Effective Content Security Policy in the Application panel
- Improved animation debugging
- 'Do you trust this code?' dialog in Sources and self-XSS warning in Console
- Event listener breakpoints in web workers and worklets
- The new media badge for
<audio>and<video> - Preloading renamed to Speculative loading
- Lighthouse 11.2.0
- Accessibility improvements
- Miscellaneous highlights
- Improved @property section in Elements > Styles
- Editable @property rule
- Issues with invalid @property rules are reported
- Updated list of devices to emulate
- Pretty-print inline JSON in script tags in Sources
- Autocomplete private fields in Console
- Lighthouse 11.1.0
- Accessibility improvements
- Web SQL deprecation
- Screenshot aspect ratio validation in Application > Manifest
- Miscellaneous highlights
- New section for custom properties in Elements > Styles
- More local overrides improvements
- Enhanced search
- Improved Sources panel
- Streamlined workspace in the Sources panel
- Reorder panes in Sources
- Syntax highlighting and pretty-printing for more script types
- Emulate prefers-reduced-transparency media feature
- Lighthouse 11
- Accessibility improvements
- Miscellaneous highlights
- Network panel improvements
- Override web content locally even faster
- Override the content of XHR and fetch requests
- Hide Chrome extension requests
- Human-readable HTTP status codes
Performance: See the changes in fetch priority for network events
- Sources settings enabled by default: Code folding and automatic file reveal
- Improved debugging of third-party cookie issues
- New colors
- Lighthouse 10.4.0
- Debug preloading in the Application panel
- The C/C++ WebAssembly debugging extension for DevTools is now open source
- Miscellaneous highlights
- (Experimental) New rendering emulation: prefers-reduced-transparency
- (Experimental) Enhanced Protocol monitor
- Improved debugging of missing stylesheets
- Linear timing support in Elements > Styles > Easing Editor
- Storage buckets support and metadata view
- Lighthouse 10.3.0
- Accessibility: Keyboard commands and improved screen reading
- Miscellaneous highlights
- Elements improvements
- New CSS subgrid badge
- Selector specificity in tooltips
- Values of custom CSS properties in tooltips
- Sources improvements
- CSS syntax highlighting
- Shortcut to set conditional breakpoints
- Application > Bounce Tracking Mitigations
- Lighthouse 10.2.0
- Ignore content scripts by default
- Network > Response improvements
- Miscellaneous highlights
- WebAssembly debugging support
- Improved stepping behavior in Wasm apps
- Debug Autofill using the Elements panel and Issues tab
- Assertions in Recorder
- Lighthouse 10.1.1
- Performance enhancements
- performance.mark() shows timing on hover in Performance > Timings
- profile() command populates Performance > Main
- Warning for slow user interactions
- Web Vitals updates
- JavaScript Profiler deprecation: Phase three
- Miscellaneous highlights
- Override network response headers
- Nuxt, Vite, and Rollup debugging improvements
- CSS improvements in Elements > Styles
- Invalid CSS properties and values
- Links to key frames in the animation shorthand property
- New Console setting: Autocomplete on Enter
- Command Menu emphasizes authored files
- JavaScript Profiler deprecation: Stage two
- Miscellaneous highlights
- Recorder updates
- Recorder replay extensions
- Record with pierce selectors
- Export recordings as Puppeteer scripts with Lighthouse analysis
- Get extensions for Recorder
- Elements > Styles updates
- CSS documentation in the Styles pane
- CSS nesting support
- Marking logpoints and conditional breakpoints in the Console
- Ignore irrelevant scripts during debugging
- JavaScript Profiler deprecation started
- Emulate reduced contrast
- Lighthouse 10
- Miscellaneous highlights
- Debugging HD color with the Styles pane
- Enhanced breakpoint UX
- Customizable Recorder shortcuts
- Better syntax highlight for Angular
- Reorganize caches in the Application panel
- Miscellaneous highlights
- Clearing Performance Panel on reload
- Recorder updates
- View and highlight the code of your user flow in the Recorder
- Customize selector types of a recording
- Edit user flow while recording
- Automatic in-place pretty print
- Better syntax highlight and inline preview for Vue, SCSS and more
- Ergonomic and consistent Autocomplete in the Console
- Miscellaneous highlights
- Recorder: Copy as options for steps, in-page replay, step's context menu
- Show actual function names in performance's recordings
- New keyboard shortcuts in the Console & Sources panel
- Improved JavaScript debugging
- Miscellaneous highlights
- [Experimental] Enhanced UX in managing breakpoints
- [Experimental] Automatic in-place pretty print
- Hints for inactive CSS properties
- Auto-detect XPath and text selectors in the Recorder panel
- Step through comma-separated expressions
- Improved Ignore list setting
- Miscellaneous highlights
- Customize keyboard shortcuts in DevTools
- Toggle light and dark themes with keyboard shortcut
- Highlight C/C++ objects in the Memory Inspector
- Support full initiator information for HAR import
- Start DOM search after pressing
Enter - Display
startandendicons foralign-contentCSS flexbox properties - Miscellaneous highlights
- Group files by Authored / Deployed in the Sources panel
- Linked stack traces for asynchronous operations
- Automatically ignore known third-party scripts
- Improved call stack during debugging
- Hiding ignore-listed sources in the Sources panel
- Hiding ignore-listed files in the Command Menu
- New Interactions track in the Performance panel
- LCP timings breakdown in the Performance Insights panel
- Auto-generate default name for recordings in the Recorder panel
- Miscellaneous highlights
- Step-by-step replay in the Recorder
- Support mouse over event in the Recorder panel
- Largest Contentful Paint (LCP) in the Performance insights panel
- Identify flashes of text (FOIT, FOUT) as potential root causes for layout shifts
- Protocol handlers in the Manifest pane
- Top layer badge in the Elements panel
- Attach Wasm debugging information at runtime
- Support live edit during debugging
- View and edit @scope at rules in the Styles pane
- Source map improvements
- Miscellaneous highlights
- Restart frame during debugging
- Slow replay options in the Recorder panel
- Build an extension for the Recorder panel
- Group files by Authored / Deployed in the Sources panel
- New User Timings track in the Performance insights panel
- Reveal assigned slot of an element
- Simulate hardware concurrency for Performance recordings
- Preview non-color value when autocompleting CSS variables
- Identify blocking frames in the Back/forward cache pane
- Improved autocomplete suggestions for JavaScript objects
- Source maps improvements
- Miscellaneous highlights
- Capture double-click and right-click events in the Recorder panel
- New timespan and snapshot mode in the Lighthouse panel
- Improved zoom control in the Performance Insights panel
- Confirm to delete a performance recording
- Reorder panes in the Elements panel
- Picking a color outside of the browser
- Improved inline value preview during debugging
- Support large blobs for virtual authenticators
- New keyboard shortcuts in the Sources panel
- Source maps improvements
- Preview feature: New Performance insights panel
- New shortcuts to emulate light and dark themes
- Improved security on the Network Preview tab
- Improved reloading at breakpoint
- Console updates
- Cancel user flow recording at the start
- Display inherited highlight pseudo-elements in the Styles pane
- Miscellaneous highlights
- [Experimental] Copy CSS changes
- [Experimental] Picking color outside of browser
- Import and export recorded user flows as a JSON file
- View cascade layers in the Styles pane
- Support for the
hwb()color function - Improved the display of private properties
- Miscellaneous highlights
- [Experimental] New timespan and snapshot mode in the Lighthouse panel
- View and edit @supports at rules in the Styles pane
- Support common selectors by default
- Customize the recording's selector
- Rename a recording
- Preview class/function properties on hover
- Partially presented frames in the Performance panel
- Miscellaneous highlights
- Throttling WebSocket requests
- New Reporting API pane in the Application panel
- Support wait until element is visible/clickable in the Recorder panel
- Better console styling, formatting and filtering
- Debug Chrome extension with source map files
- Improved source folder tree in the Sources panel
- Display worker source files in the Sources panel
- Chrome's Auto Dark Theme updates
- Touch-friendly color-picker and split pane
- Miscellaneous highlights
- Preview feature: Full-page accessibility tree
- More precise changes in the Changes tab
- Set longer timeout for user flow recording
- Ensure your pages are cacheable with the Back/forward cache tab
- New Properties pane filter
- Emulate the CSS forced-colors media feature
- Show rulers on hover command
- Support
row-reverseandcolumn-reversein the Flexbox editor - New keyboard shortcuts to replay XHR and expand all search results
- Lighthouse 9 in the Lighthouse panel
- Improved Sources panel
- Miscellaneous highlights
- [Experimental] Endpoints in the Reporting API pane
- Preview feature: New Recorder panel
- Refresh device list in Device Mode
- Autocomplete with Edit as HTML
- Improved code debugging experience
- Syncing DevTools settings across devices
- Preview feature: New CSS Overview panel
- Restored and improved CSS length edit and copy experince
- Emulate the CSS prefers-contrast media feature
- Emulate the Chrome's Auto Dark Theme feature
- Copy declarations as JavaScript in the Styles pane
- New Payload tab in the Network panel
- Improved the display of properties in the Properties pane
- Option to hide CORS errors in the Console
- Proper
Intlobjects preview and evaluation in the Console - Consistent async stack traces
- Retain the Console sidebar
- Deprecated Application cache pane in the Application panel
- [Experimental] New Reporting API pane in the Application panel
- New CSS length authoring tools
- Hide issues in the Issues tab
- Improved the display of properties
- Lighthouse 8.4 in the Lighthouse panel
- Sort snippets in the Sources panel
- New links to translated release notes and report a translation bug
- Improved UI for DevTools command menu
- Use DevTools in your preferred language
- New Nest Hub devices in the Device list
- Origin trials in the Frame details view
- New CSS container queries badge
- New checkbox to invert the network filters
- Upcoming deprecation of the Console sidebar
- Display raw
Set-Cookiesheaders in the Issues tab and Network panel - Consistent display native accessors as own properties in the Console
- Proper error stack traces for inline scripts with #sourceURL
- Change color format in the Computed pane
- Replace custom tooltips with native HTML tooltips
- [Experimental] Hide issues in the Issues tab
- Editable CSS container queries in the Styles pane
- Web bundle preview in the Network panel
- Attribution Reporting API debugging
- Better string handling in the Console
- Improved CORS debugging
- Lighthouse 8.1
- New note URL in the Manifest pane
- Fixed CSS matching selectors
- Pretty-printing JSON responses in the Network panel
- CSS grid editor
- Support for
constredeclarations in the Console - Source order viewer
- New shortcut to view frame details
- Enhanced CORS debugging support
- Rename XHR label to Fetch/XHR
- Filter Wasm resource type in the Network panel
- User-Agent Client Hints for devices in the Network conditions tab
- Report Quirks mode issues in the Issues tab
- Include Compute Intersections in the Performance panel
- Lighthouse 7.5 in the Lighthouse panel
- Deprecated "Restart frame" context menu in the call stack
- [Experimental] Protocol monitor
- [Experimental] Puppeteer Recorder
- Web Vitals information pop up
- New Memory inspector
- Visualize CSS scroll-snap
- New badge settings pane
- Enhanced image preview with aspect ratio information
- New network conditions button with options to configure
Content-Encodings - shortcut to view computed value
accent-colorkeyword- Categorize issue types with colors and icons
- Delete Trust tokens
- Blocked features in the Frame details view
- Filter experiments in the Experiments setting
- New
Vary Headercolumn in the Cache storage pane - Support JavaScript private brand check
- Enhanced support for breakpoints debugging
- Support hover preview with
[]notation - Improved outline of HTML files
- Proper error stack traces for Wasm debugging
- New CSS flexbox debugging tools
- New Core Web Vitals overlay
- Moved issue count to the Console status bar
- Report Trusted Web Activity issues
- Format strings as (valid) JavaScript string literals in the Console
- New Trust Tokens pane in the Application panel
- Emulate the CSS color-gamut media feature
- Improved Progressive Web Apps tooling
- New
Remote Address Spacecolumn in the Network panel - Performance improvements
- Display allowed/disallowed features in the Frame details view
- New
SamePartycolumn in the Cookies pane - Deprecated non-standard
fn.displayNamesupport - Deprecation of
Don't show Chrome Data Saver warningin the Settings menu - [Experimental] Automatic low-contrast issue reporting in the Issues tab
- [Experimental] Full accessibility tree view in the Elements panel
- Debugging support for Trusted Types violations
- Capture node screenshot beyond viewport
- New Trust Tokens tab for network requests
- Lighthouse 7 in the Lighthouse panel
- Support forcing the CSS
:targetstate - New shortcut to duplicate element
- Color pickers for custom CSS properties
- New shortcuts to copy CSS properties
- New option to show URL-decoded cookies
- Clear only visible cookies
- New option to clear third-party cookies in the Storage pane
- Edit User-Agent Client Hints for custom devices
- Persist "record network log" setting
- View WebTransport connections in the Network panel
- "Online" renamed to "No throttling"
- New copy options in the Console, Sources panel, and Styles pane
- New Service Workers information in the Frame details view
- Measure Memory information in the Frame details view
- Provide feedback from the Issues tab
- Dropped frames in the Performance panel
- Emulate foldable and dual-screen in Device Mode
- [Experimental] Automate browser testing with Puppeteer Recorder
- [Experimental] Font editor in the Styles pane
- [Experimental] CSS flexbox debugging tools
- [Experimental] New CSP Violations tab
- [Experimental] New color contrast calculation - Advanced Perceptual Contrast Algorithm (APCA)
- Faster DevTools startup
- New CSS angle visualization tools
- Emulate unsupported image types
- Simulate storage quota size in the Storage pane
- New Web Vitals lane in the Performance panel
- Report CORS errors in the Network panel
- Cross-origin isolation information in the Frame details view
- New Web Workers information in the Frame details view
- Display opener frame details for opened windows
- Open Network panel from the Service Workers pane
- Copy property value
- Copy stacktrace for network initiator
- Preview Wasm variable value on mouseover
- Evaluate Wasm variable in the Console
- Consistent units of measurement for file/memory sizes
- Highlight pseudo elements in the Elements panel
- [Experimental] CSS Flexbox debugging tools
- [Experimental] Customize chords keyboard shortcuts
- New CSS Grid debugging tools
- New WebAuthn tab
- Move tools between top and bottom panel
- New Computed sidebar pane in the Styles pane
- Grouping CSS properties in the Computed pane
- Lighthouse 6.3 in the Lighthouse panel
performance.mark()events in the Timings section- New
resource-typeandurlfilters in the Network panel - Frame details view updates
- Deprecation of
Settingsin the More tools menu - [Experimental] View and fix color contrast issues in the CSS Overview panel
- [Experimental] Customize keyboard shortcuts in DevTools
- New Media panel
- Capture node screenshots using Elements panel context menu
- Issues tab updates
- Emulate missing local fonts
- Emulate inactive users
- Emulate
prefers-reduced-data - Support for new JavaScript features
- Lighthouse 6.2 in the Lighthouse panel
- Deprecation of "other origins" listing in the Service Workers pane
- Show coverage summary for filtered items
- New frame details view in Application panel
- Accessible color suggestion in the Styles pane
- Reinstate Properties pane in the Elements panel
- Human-readable
X-Client-Dataheader values in the Network panel - Auto-complete custom fonts in the Styles pane
- Consistently display resource type in Network panel
- Clear buttons in the Elements and Network panels
- Style editing for CSS-in-JS frameworks
- Lighthouse 6 in the Lighthouse panel
- First Meaningful Paint (FMP) deprecation
- Support for new JavaScript features
- New app shortcut warnings in the Manifest pane
- Service worker
respondWithevents in the Timing tab - Consistent display of the Computed pane
- Bytecode offsets for WebAssembly files
- Line-wise copy and cut in Sources Panel
- Console settings updates
- Performance panel updates
- New icons for breakpoints, conditional breakpoints, and logpoints
- Fix site issues with the new Issues tab
- View accessibility information in the Inspect Mode tooltip
- Performance panel updates
- More accurate promise terminology in the Console
- Styles pane updates
- Deprecation of the Properties pane in the Elements panel
- App shortcuts support in the Manifest pane
- Emulate vision deficiencies
- Emulate locales
- Cross-Origin Embedder Policy (COEP) debugging
- New icons for breakpoints, conditional breakpoints, and logpoints
- View network requests that set a specific cookie
- Dock to left from the Command Menu
- The Settings option in the Main Menu has moved
- The Audits panel is now the Lighthouse panel
- Delete all Local Overrides in a folder
- Updated Long Tasks UI
- Maskable icon support in the Manifest pane
- Moto G4 support in Device Mode
- Cookie-related updates
- More accurate web app manifest icons
- Hover over CSS
contentproperties to see unescaped values - Source map errors in the Console
- Setting for disabling scrolling past the end of a file
- Support for
letandclassredeclarations in the Console - Improved WebAssembly debugging
- Request Initiator Chains in the Initiator tab
- Highlight the selected network request in the Overview
- URL and path columns in the Network panel
- Updated User-Agent strings
- New Audits panel configuration UI
- Per-function or per-block code coverage modes
- Code coverage must now be initiated by a page reload
- Debug why a cookie was blocked
- View cookie values
- Simulate different prefers-color-scheme and prefers-reduced-motion preferences
- Code coverage updates
- Debug why a network resource was requested
- Console and Sources panels respect indentation preferences again
- New shortcuts for cursor navigation
- Multi-client support in the Audits panel
- Payment Handler debugging
- Lighthouse 5.2 in the Audits panel
- Largest Contentful Paint in the Performance panel
- File DevTools issues from the Main Menu
- Copy element styles
- Visualize layout shifts
- Lighthouse 5.1 in the Audits panel
- OS theme syncing
- Keyboard shortcut for opening the Breakpoint Editor
- Prefetch cache in the Network panel
- Private properties when viewing objects
- Notifications and push messages in the Application panel
- Autocomplete with CSS values
- A new UI for network settings
- WebSocket messages in HAR exports
- HAR import and export buttons
- Real-time memory usage
- Service worker registration port numbers
- Inspect Background Fetch and Background Sync events
- Puppeteer for Firefox
- Meaningful presets when autocompleting CSS functions
- Clear site data from the Command Menu
- View all IndexedDB databases
- View a resource's uncompressed size on hover
- Inline breakpoints in the Breakpoints pane
- IndexedDB and Cache resource counts
- Setting for disabling the detailed Inspect tooltip
- Setting for toggling tab indentation in the Editor
- Highlight all nodes affected by CSS property
- Lighthouse v4 in the Audits panel
- WebSocket binary message viewer
- Capture area screenshot in the Command Menu
- Service worker filters in the Network panel
- Performance panel updates
- Long tasks in Performance panel recordings
- First Paint in the Timing section
- Bonus tip: Shortcut for viewing RGB and HSL color codes (video)
- Logpoints
- Detailed tooltips in Inspect Mode
- Export code coverage data
- Navigate the Console with a keyboard
- AAA contrast ratio line in the Color Picker
- Save custom geolocation overrides
- Code folding
- Frames tab renamed to Messages tab
- Bonus tip: Network panel filtering by property (video)
- Visualize performance metrics in the Performance panel
- Highlight text nodes in the DOM Tree
- Copy the JS path to a DOM node
- Audits panel updates, including a new audit that detects JS libraries and new keywords for accessing the Audits panel from the Command Menu
- Bonus tip: Use Device Mode to inspect media queries (video)
- Hover over a Live Expression result to highlight a DOM node
- Store DOM nodes as global variables
- Initiator and priority information now in HAR imports and exports
- Access the Command Menu from the Main Menu
- Picture-in-Picture breakpoints
- Bonus tip: Use
monitorEvents()to log a node's fired events in the Console (video) - Live Expressions in the Console
- Highlight DOM nodes during Eager Evaluation
- Performance panel optimizations
- More reliable debugging
- Enable network throttling from the Command Menu
- Autocomplete Conditional Breakpoints
- Break on AudioContext events
- Debug Node.js apps with ndb
- Bonus tip: Measure real world user interactions with the User Timing API
- Eager Evaluation
- Argument hints
- Function autocompletion
- ES2017 keywords
- Lighthouse 3.0 in the Audits panel
- BigInt support
- Adding property paths to the Watch pane
- "Show timestamps" moved to Settings
- Bonus tip: Lesser-known Console methods (video)
- Search across all network headers
- CSS variable value previews
- Copy as fetch
- New audits, desktop configuration options, and viewing traces
- Stop infinite loops
- User Timing in the Performance tabs
- JavaScript VM instances clearly listed in the Memory panel
- Network tab renamed to Page tab
- Dark theme updates
- Certificate transparency information in the Security panel
- Site isolation features in the Performance panel
- Bonus tip: Layers panel + Animations Inspector (video)
- Blackboxing in the Network panel
- Auto-adjust zooming in Device Mode
- Pretty-printing in the Preview and Response tabs
- Previewing HTML content in the Preview tab
- Local Overrides support for styles inside of HTML
- Bonus tip: Blackbox framework scripts to make Event Listener Breakpoints more useful
- Local Overrides
- New accessibility tools
- The Changes tab
- New SEO and performance audits
- Multiple recordings in the Performance panel
- Reliable code stepping with workers in async code
- Bonus tip: Automate DevTools actions with Puppeteer (video)
- Performance Monitor
- Console Sidebar
- Group similar Console messages
- Bonus tip: Toggle hover pseudo-class (video)
- Multi-client remote debugging support
- Workspaces 2.0
- 4 new audits
- Simulate push notifications with custom data
- Trigger background sync events with custom tags
- Bonus tip: Event listener breakpoints (video)
- Top-level await in the Console
- New screenshot workflows
- CSS Grid highlighting
- A new Console API for querying objects
- New Console filters
- HAR imports in the Network panel
- Previewable cache resources
- More predictable cache debugging
- Block-level code coverage
- Mobile device throttling simulation
- View storage usage
- View when a service worker cached responses
- Enable the FPS meter from the Command Menu
- Set mousewheel behavior to zoom or scroll
- Debugging support for ES6 modules
- New Audits panel
- 3rd-Party Badges
- A new gesture for Continue To Here
- Step into async
- More informative object previews in the Console
- More informative context selection in the Console
- Real-time updates in the Coverage tab
- Simpler network throttling options
- Async stacks on by default
- CSS and JS code coverage
- Full-page screenshots
- Block requests
- Step over async await
- Unified Command Menu